Participant characteristics
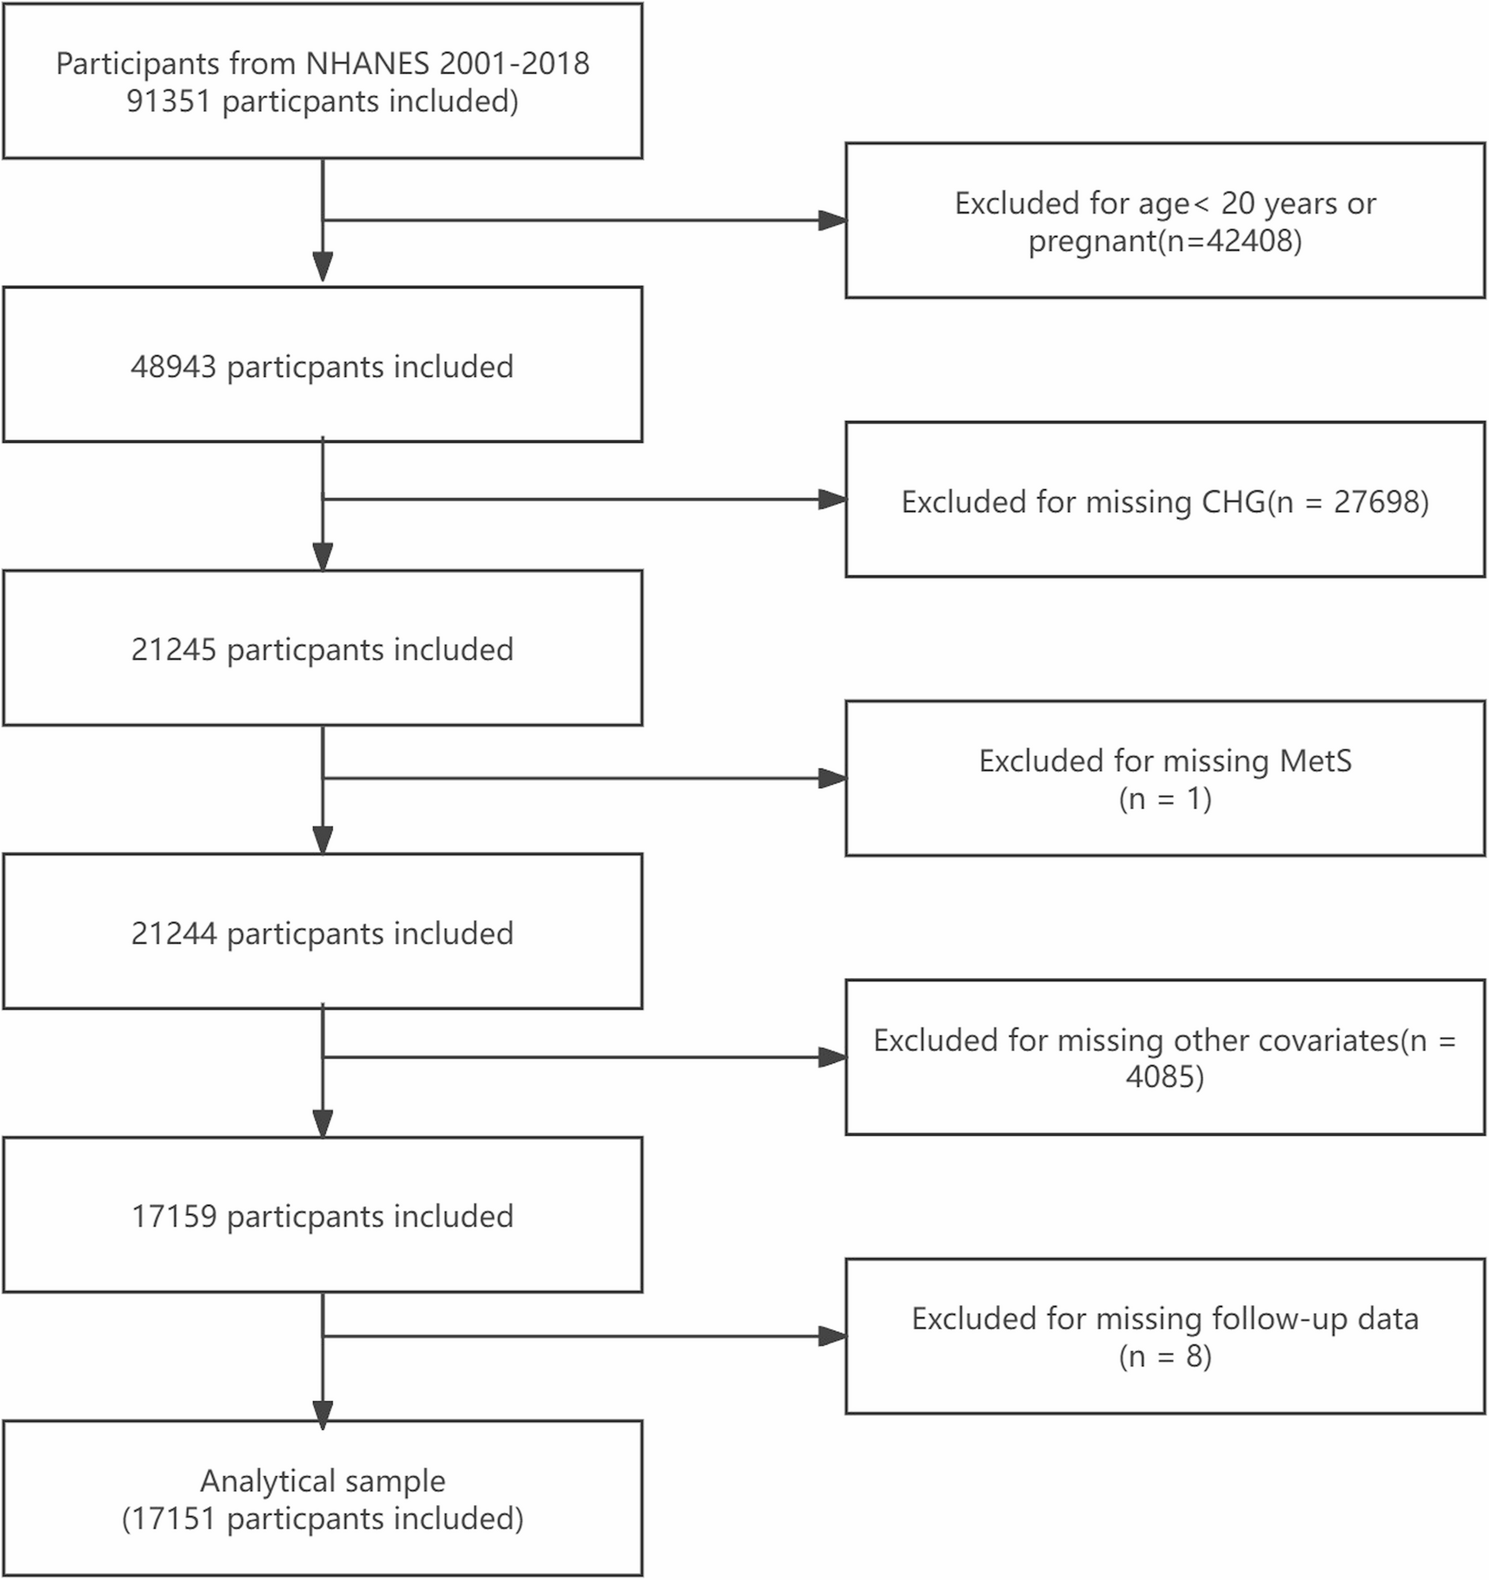
After eliminating noninclusion individuals, the analysis included 17,151 participants. The fundamental clinical and demographic traits of the study population are shown in Table 1. The average age of the population was 47.42 years, with 8,690 males (50.67%). In total, 6,187 participants were diagnosed with MetS. The participants in the MetS cohort were predominantly older and had a greater proportion of females; a greater proportion of white people; a lower educational attainment; a lower percentage of people who were never married; a higher proportion with a PIR below 3; and a greater likelihood of obesity. Additionally, in the MetS group, the proportions of former smokers were greater, and now drinkers were fewer, whereas the levels of eGFR, TBil, and ALB were lower. Conversely, the concentrations of ALT, AST, UA, BUN, and LDH markedly increased, and the HEI-2015 score decreased. Table S4 provides specifics about the individual characteristics grouped by CHG index quartiles. Compared with participants with lower CHG, those with higher CHG had a greater percentage of men and seemed to be older, a greater percentage of Mexican Americans and other Hispanic, a lower proportion with above high school, a higher proportion of married or cohabitating individuals, and an increased proportion with a PIR < 3. Additionally, the prevalence of obesity, former smokers, now smokers, and former alcohol consumers was also higher. Furthermore, this group had lower eGFRs, while ALT, AST, UA, BUN, and LDH levels were higher, and their HEI-2015 scores were relatively lower.
Associations between the CHG index and MetS
The CHG index and the risk of MetS were found to be significantly positively correlated (Table 2). After thoroughly controlling for possible confounders, an increase of one standard deviation in CHG was correlated with a 0.447 increase in the risk of MetS (OR = 1.447 [1.418, 1.478]). Further quartile-based subgroup analysis revealed a clear dose‒response relationship between CHG levels and MetS risk. Compared with the lowest CHG quartile, the chance of developing MetS increased by 1.416 (OR = 2.416 [1.992, 2.929]) in Q2, 6.067 (OR = 7.067 [5.879, 8.494]) in Q3, and 30.643 (OR = 31.643 [25.908, 38.646]) in Q4. Smooth curve fitting revealed a U-shaped nonlinear CHG-MetS relationship (Fig. 2). Further piecewise logistic regression and threshold effect analysis revealed that, when CHG < 46.12, the risk of MetS decreased with increasing CHG (OR = 0.748 [0.630, 0.888]), whereas the risk of MetS increased sharply with increasing CHG levels when CHG > 46.12 (OR = 1.466 [1.442, 1.491]) (Table S5).
Smooth curve fitting analysis of the associations between the CHG index and MetS, adjusted for age, sex, race, education level, marital status, PIR, BMI, drinking status, smoking status, eGFR, ALT, AST, TBil, ALB, UA, BUN, LDH and HEI-2015
Figure 3 displays the findings of subgroup analyses examining the associations among MetS risk and the CHG index as continuous variables, including age, sex, BMI, alcohol consumption, and smoking status. Among all the subgroups, CHG was significantly positively correlated with MetS. Interaction tests revealed that this association was stronger in younger people, women, obese individuals, and those who had never smoked or drank.
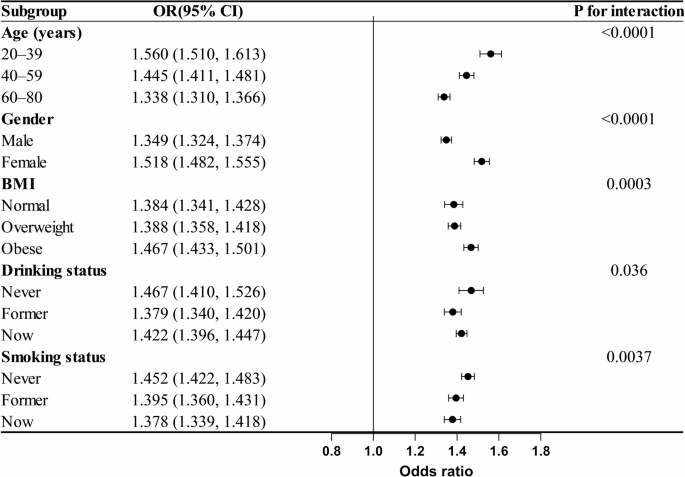
Subgroup analysis of the associations between the CHG index and MetS, adjusted for age, sex, race, education level, marital status, PIR, BMI, drinking status, smoking status, eGFR, ALT, AST, TBil, ALB, UA, BUN, LDH and HEI-2015
Associations between the CHG index and mortality risk in the MetS population
The average follow-up period was 8.78 years, during which 1,292 (20.8%) deaths from all-cause Mortality and 444 (7.1%) CVD-related deaths were recorded among individuals with MetS. After stratifying by CHG quartile, the all-cause Mortality rates in individuals with MetS were 353 (22.8%), 291 (18.8%), 293 (18.9%), and 355 (22.9%) across the respective quartiles. Additionally, CVD deaths were recorded as 111 (7.1%), 109 (7.0%), 94 (6.0%), and 130 (8.4%) in each quartile. The findings of the multivariable weighted Cox regression Model revealed that CHG significantly increased the risk of both all-cause Mortality and CVD mortality in the MetS cohort. Upon controlling for other covariates, every 1 standard deviation increase in CHG level correlated with a 2.2% increase in the risk of death from all causes (HR = 1.022 [1.005, 1.038]) and a 2.5% increase in CVD mortality risk (HR = 1.025 [1.001, 1.050]). This association exhibited a clear dose‒response relationship across different CHG quartiles (trend P < 0.05). Compared with the lowest CHG quartile, the highest quartile had a 40.4% increase in all-cause mortality risk (HR = 1.404 [1.182, 1.667]) and a 63.9% increase in CVD mortality risk (HR = 1.639 [1.254, 2.144]) in MetS individuals (Table 3). Smooth curve fitting further suggested a U-shaped nonlinear relationship between CHG and all-cause and CVD mortality (Fig. 4). Piecewise regression and threshold effect analysis revealed that, when CHG < 52.67, the risk for all-cause death decreased with increasing CHG (HR = 0.919 [0.867, 0.974]), whereas the risk increased significantly when CHG > 52.67 (HR = 1.083 [1.059, 1.107]). A similar trend was observed for CVD mortality: when CHG < 50.82, the risk decreased with increasing CHG (HR = 0.885 [0.792, 0.990]), whereas the risk increased sharply after CHG > 50.82 (HR = 1.063 [1.034, 1.092]) (Table S6).
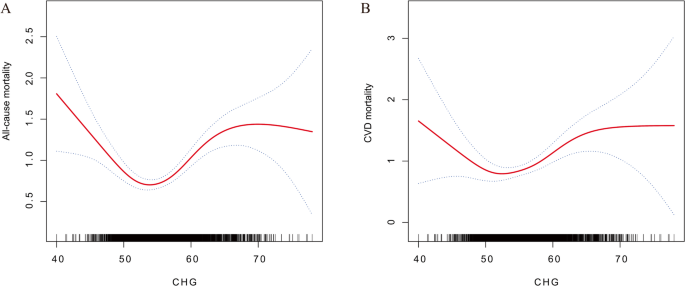
Smooth curve fitting analysis of the associations between the CHG index and all-cause mortality (A) and CVD mortality (B) in patients with MetS. Adjusted for age, sex, race, education level, marital status, PIR, BMI, drinking status, smoking status, eGFR, ALT, AST, TBil, ALB, UA, BUN, LDH and HEI-2015
Kaplan‒Meier survival curves revealed a nonlinear relationship between CHG quartiles and all-cause mortality in people with MetS. Throughout the follow-up duration, the survival probability for individuals in the middle CHG quartiles (Q2 and Q3) was significantly greater than those in the lowest (Q1) and highest (Q4) quartiles. The Q3 group presented the best survival curve, followed by the Q2 group, whereas the Q1 and Q4 groups presented the lowest survival rates, suggesting that extreme CHG levels at both extremes correspond to a greater chance of death from all causes. The same pattern was observed in the survival analysis of CVD mortality. The individuals in the middle CHG quartiles (Q2 and Q3) maintained higher CVD-specific survival rates throughout the follow-up, whereas those in the Q1 and Q4 groups presented relatively higher CVD mortality risk (log-rank P = 0.029). This phenomenon further supports the hypothesis of a U-shaped nonlinear relationship between CHG and death risk (Fig. 5).
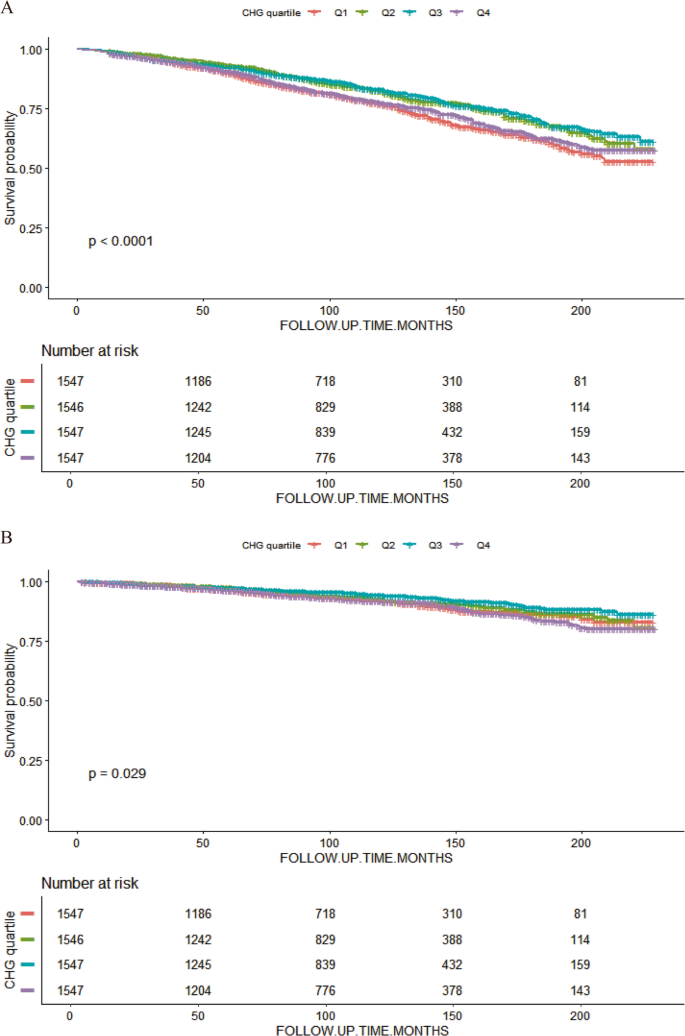
K‒M survival analysis of MetS patients in different CHG quartile groups: all-cause mortality (A) and CVD mortality (B)
Further subgroup analysis findings indicated that CHG was positively correlated with Mortality risk across all subgroups. Age Moderated the relationship between CHG and all-cause mortality, with a significant association observed within the 40–59 years age group, whereas no statistically significant associations were found among the 20–39 and 60–80 years age brackets. In the CVD mortality analysis, the smoking status subgroup showed a significant interaction, demonstrating a significant relationship between CHG and CVD mortality risk across never smokers and former smokers, both of which were statistically significant; in contrast, the association was not significant in current smokers, suggesting that the predictive effect of CHG may be diminished or masked by other risk factors in this population (Fig. 6).
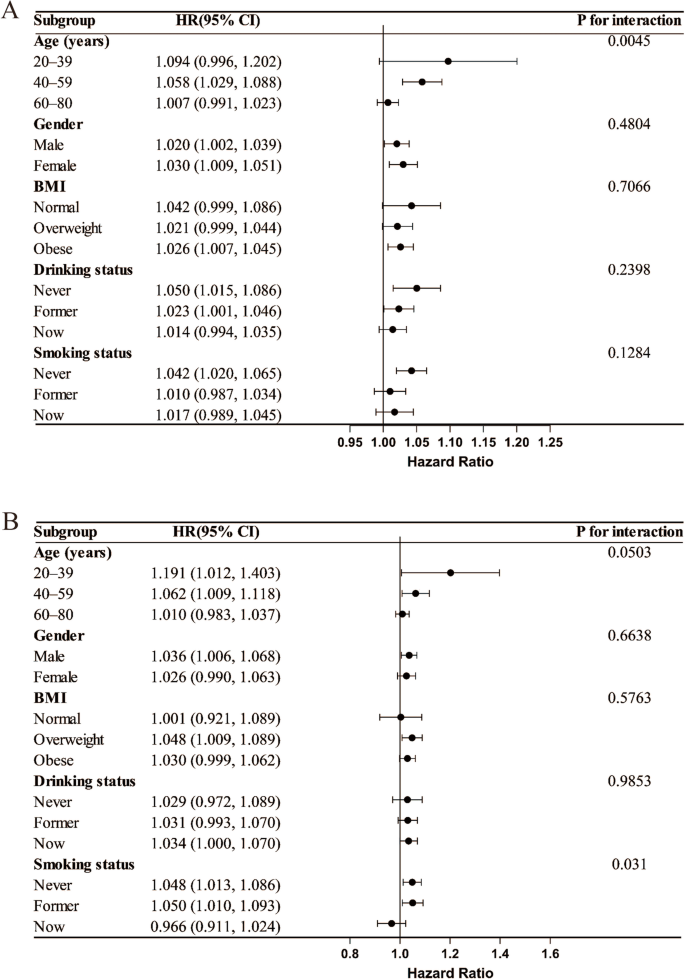
Subgroup analysis of the associations between the CHG index and all-cause mortality (A) and CVD mortality (B) in patients with MetS, adjusted for age, sex, race, education level, marital status, PIR, BMI, drinking status, smoking status, eGFR, ALT, AST, TBil, ALB, UA, BUN, LDH and HEI-2015
Sensitivity analysis
After performing multiple imputation for the missing covariates, we reanalysed the data, and the findings indicated that CHG maintained a substantial positive association with MetS. For each standard deviation of CHG, the chance of MetS increased 0.403 (OR = 1.403 [1.385, 1.421]). Compared with those in the Q1 group, hazards in the Q4 group increased by 29.065 (OR = 30.065 [26.111, 34.617]) (Table S7). Additionally, for each standard deviation increase in CHG, the all-cause Mortality risk for individuals with MetS increased by 0.024 (OR = 1.024 [1.010, 1.039]), the mortality risk of the Q4 group was 0.376 greater than that of the Q1 group (OR = 1.376 [1.174, 1.614]), the CVD Mortality risk increased by 0.032 (OR = 1.032 [1.008, 1.056]), and the risk of the Q4 group was 0.615 greater than that of the Q1 group (OR = 1.615 [1.265, 2.062]) (Table S8). The association between the CHG index and MetS-HDL and MetS-FBG is shown in Table S9. For each standard deviation increase in CHG, the risk of MetS-HDL increases by 0.308 (OR = 1.308 [1.283, 1.333]), and the risk of MetS-FBG increases by 0.394 (OR = 1.394 [1.365, 1.423]).Compared with the Q1 group, the risk in the MetS-HDL Q4 group increased by 13.318 (OR = 14.318 [11.503, 17.821]), and the risk in the MetS-FBG Q4 group increased by 39.387 (OR = 40.387 [30.415, 53.627]).
After excluding those that failed to fulfil the inclusion standards, the final valid population in the CHARLS analysis consisted of 5,998 participants, with an average age of 59.02 years, and 2,791 (46.53%) were male. Overall, 2,496 individuals were identified as having MetS (Table S10). The multivariate logistic regression analysis results indicated a substantial positive association between CHG and MetS in the CHARLS database. For each standard deviation increase in CHG, the probability of MetS increased 0.546 (OR = 1.546 [1.505, 1.588]). Compared with that in the Q1 group, the risk within the Q4 group increased 56.03-fold (OR = 56.03 [43.222, 72.634]) (Table S11). Smooth curve fitting further elucidated the nonlinear association between CHG and MetS (Figure S2). In the CHARLS cohort, with an average follow-up of 8.43 years, 233 cases (9.3%) of all-cause Mortality occurred among MetS patients. After stratification by CHG quartile, the number of all-cause deaths for MetS patients was 46 (7.3%), 44 (7.0%), 63 (10%), and 80 (12.8%). Multivariate weighted Cox regression Models indicated a significant positive association between CHG and the risk of all-cause Mortality in individuals with MetS. After adjusting for all covariates, with every standard unit increase in CHG, the risk of all-cause death increased by 4.4% (HR = 1.044 [1.015, 1.075]). This association exhibited a clear dose‒response relationship across different CHG quartiles (trend P < 0.05). In contrast with the lowest quartile group of CHG, the probability of all-cause death for MetS patients with the highest CHG quartile increased by 66.5% (HR = 1.665 [1.148, 2.415]) (Table S12). Smooth curve fitting further suggested a “U”-shaped nonlinear association with CHG and all-cause mortality (Figure S3). Piecewise regression and threshold effect analysis revealed that, when CHG < 52.03, the all-cause mortality risk decreased as CHG increased (HR = 0.775 [0.668, 0.898]); when CHG > 52.03, the risk significantly increased (HR = 1.378 [1.174, 1.618]) (Table S13). Kaplan‒Meier survival curves revealed a nonlinear association between CHG quartile levels and all-cause mortality in individuals with MetS. During the follow-up period, the Q2 group presented the best survival curve, which further supported the hypothesis of a “U”-shaped nonlinear relationship between CHG and death risk (Figure S4).