Data source and study population
This study employed a retrospective design, utilizing data from the Medical Information Mart for Intensive Care IV (MIMIC-IV, version 3.0), which encompasses comprehensive information on all patients admitted to Beth Israel Deaconess Medical Center between 2008 and 2022. The MIMIC-IV database, developed by the Massachusetts Institute of Technology Computational Physiology Laboratory, is a publicly available resource that includes detailed clinical data on patients admitted to the intensive care unit (ICU). Our research team completed the Collaborative Institutional Training Initiative course, successfully passed the “Conflict of Interest” and “Study Data or Specimens Only” exams, and obtained approval for access to the MIMIC-IV database.
Sepsis was identified according to the Sepsis-3 criteria, which require a suspected or confirmed infection accompanied by an acute increase in Sequential Organ Failure Assessment (SOFA) score of ≥ 2 points. Infection and respiratory failure was determined using a combination of International Classification of Diseases, Ninth and Tenth Revision (ICD-9/10) diagnostic codes, administration of antimicrobial agents, microbiological test results, and laboratory evidence of systemic inflammation. Culture positivity was not required for inclusion.
Based on the Surviving Sepsis Campaign Guidelines and previous research, the diagnostic criteria for SALI in this study were an international normalized ratio greater than 1.5 and a total bilirubin level exceeding 2 mg/dL (34.2 µmol/L) within the first 24 h of ICU admission in patients with sepsis [15,16,17,18].
To reduce potential misclassification of SALI due to pre-existing liver conditions, we excluded patients with any documented diagnosis of chronic liver disease or cirrhosis prior to ICU admission, based on structured ICD-9/10 codes, including viral hepatitis, alcohol-related liver disease, autoimmune hepatitis, chronic hepatic failure, and hepatic malignancies.
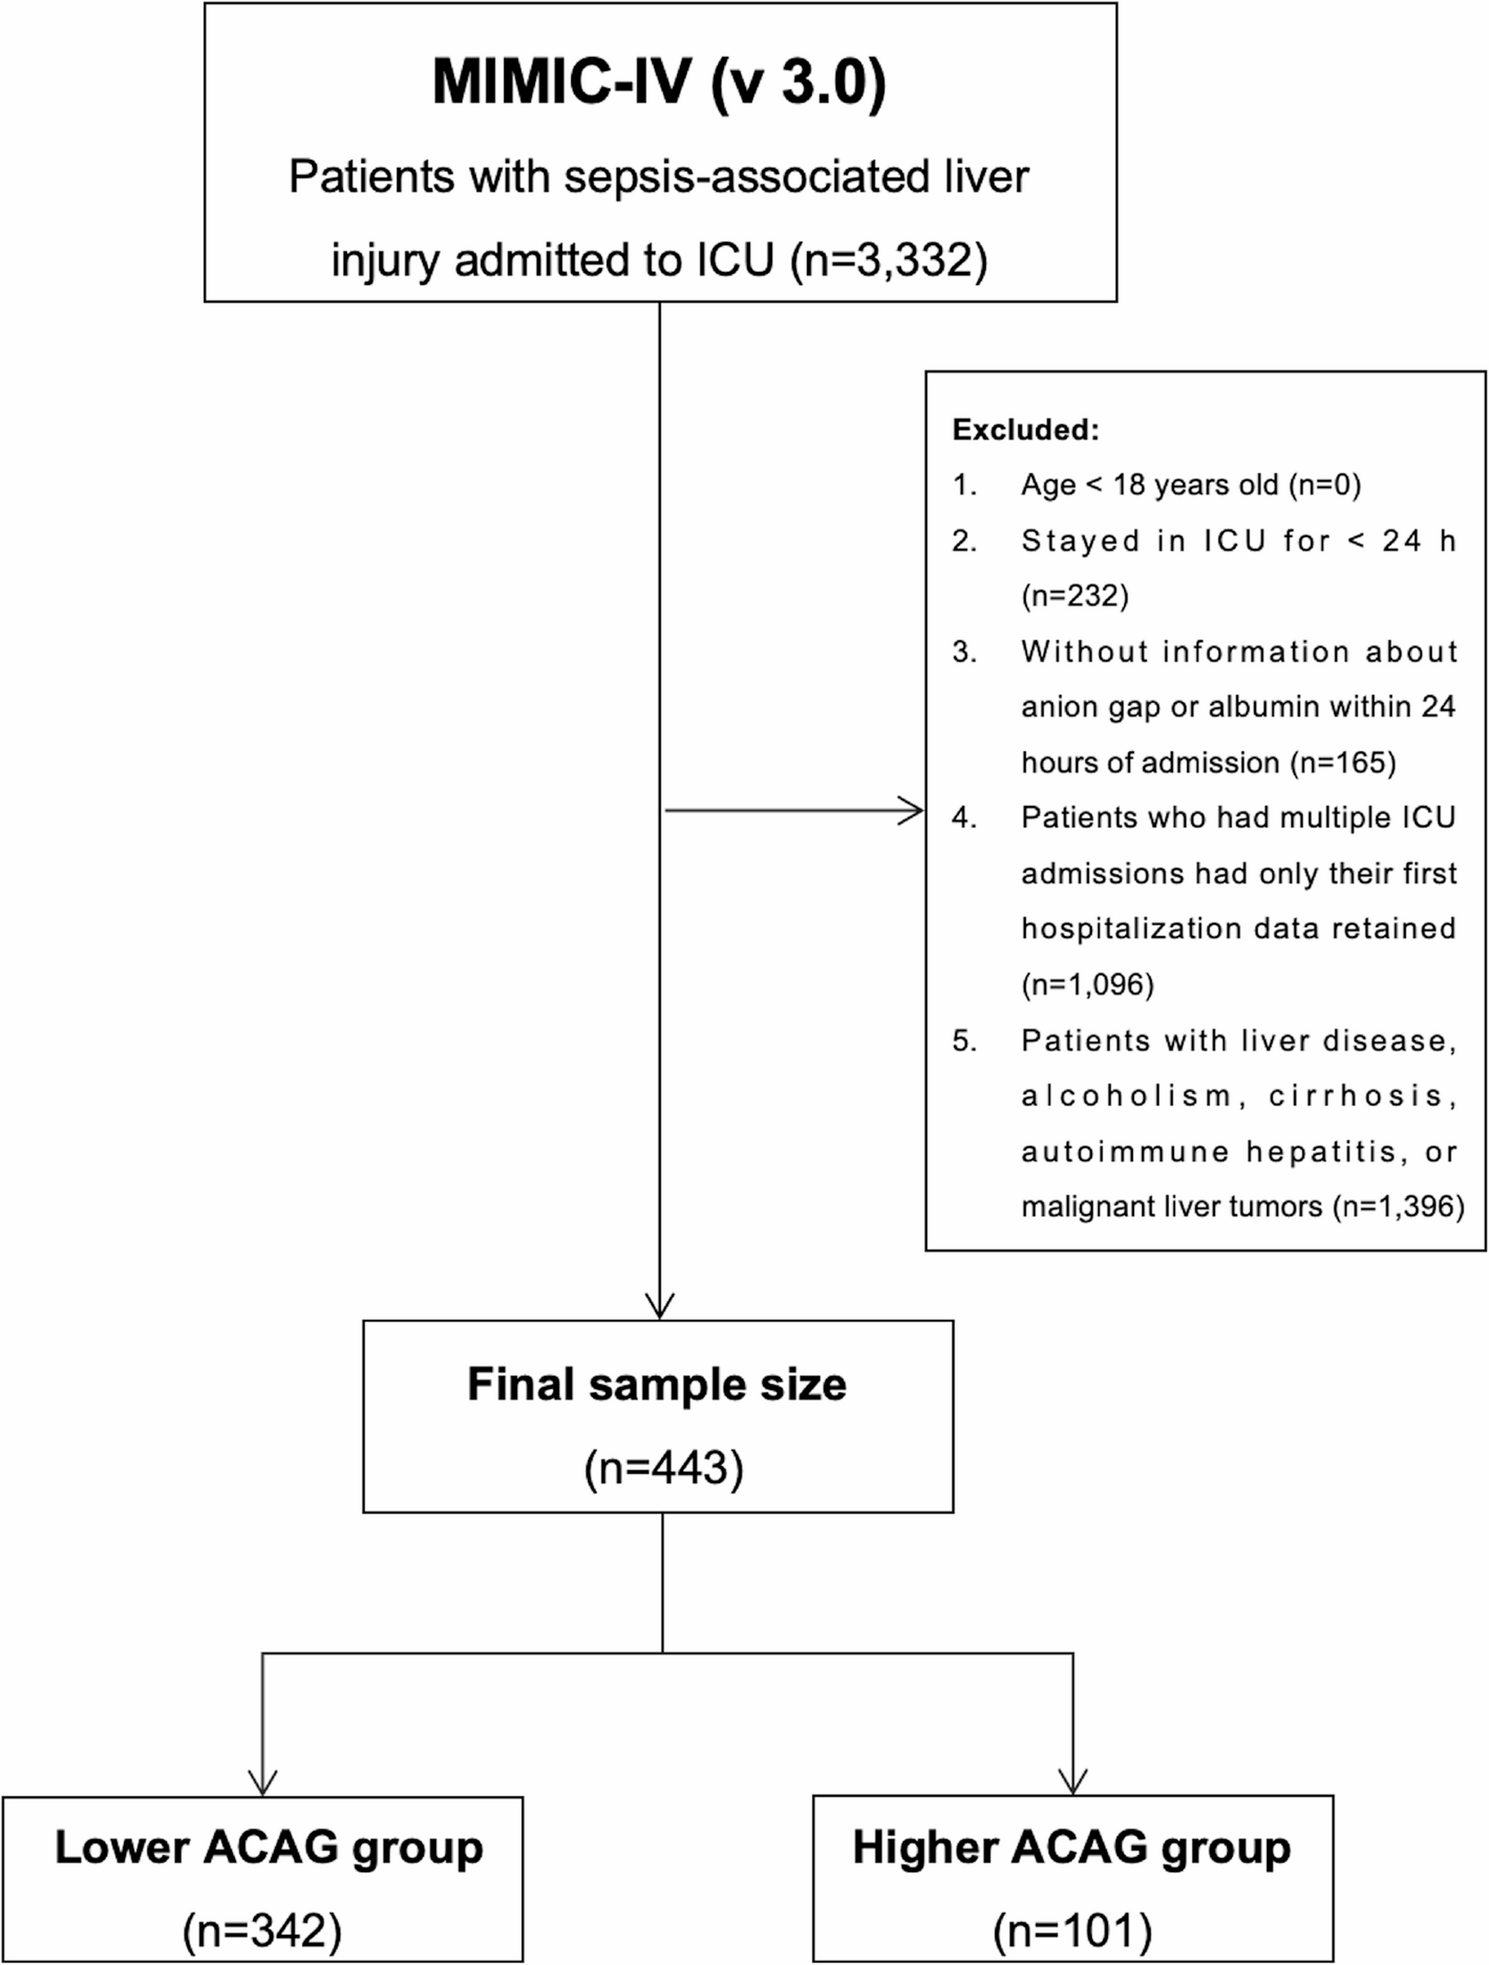
To enhance the reliability of the results, we applied rigorous exclusion criteria, which comprised: (1) patients younger than 18 years at the time of first admission, (2) ICU stays shorter than 24 h, and (3) patients lacking recorded anion gap or albumin data within 24 h of admission. For individuals with multiple hospitalizations, only data from the first admission were considered. In total, 443 patients fulfilled the inclusion criteria (Fig. 1).
Flowchart depicting the selection process of patients with cirrhosis and concomitant sepsis from the MIMIC-IV (v 3.0) database. Exclusion of chronic liver disease was based on structured ICD codes recorded prior to ICU admission. MIMIC-IV (v 3.0), Medical Information Mart for Intensive Care IV, version 3.0; ICU, Intensive Care Unit; ACAG, Albumin-Corrected Anion Gap
Data extraction
Data extraction was performed using the PostgreSQL software (version 13.7.2; PostgreSQL Global Development Group, 2024) and Navicat Premium software (version 16; DigiTech Limited, Hong Kong Special Administrative Region). Structured Query Language (SQL) was used to retrieve relevant data from the MIMIC-IV database. All clinical variables, laboratory parameters, and SOFA scores were collected within the first 24 h following ICU admission. The extracted information included demographic characteristics, vital signs, comorbid conditions, laboratory results, clinical intervention details, and patient survival outcomes. Additional information is presented in Table 1.
Management of abnormal and missing values
Abnormal values in variables were addressed using the winsor2 command in STATA software (StataCorp LLC, College Station, Texas, United States), with 1% and 99% cutoffs applied for correction. Missing data were addressed through multiple imputation methods, and variables with over 15% missing values were excluded from the analysis. For the variables that were retained, missing values were imputed using a multiple imputation technique.
Calculation formula for ACAG, grouping, and clinical outcomes
The calculation formula for ACAG was as follows:
$$:ACAG:=:AG:+:2.5:times::[4.4:-:ALB:(g/dLleft)right]$$
The optimal cut-off value for ACAG was determined based on 28-day mortality using receiver operating characteristic curve analysis, and the Youden index was used to identify the point with the highest diagnostic accuracy (Fig. 2). Patients were then classified into lower and higher ACAG groups based on this threshold.
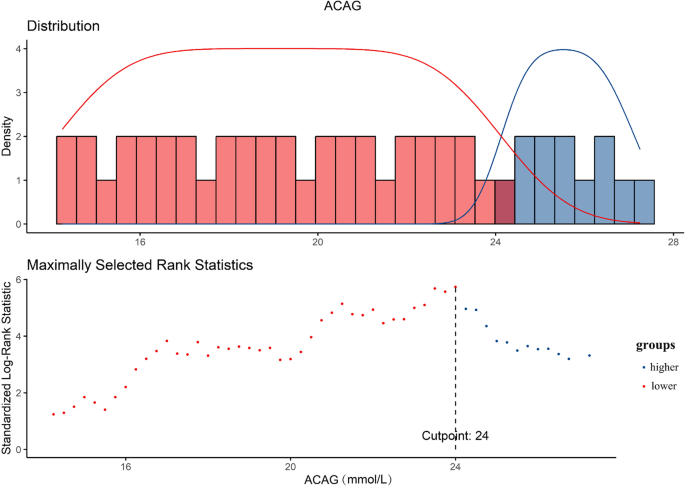
The optimal cutoff point was selected to maximize the risk ratio and to examine the relationship between ACAG ≥ 24.0 and its distribution. ACAG, Albumin-Corrected Anion Gap
The follow-up durations for mortality outcomes included ICU mortality, in-hospital mortality, and 14-day, 28-day, and 90-day all-cause mortality after ICU admission. These outcomes were derived from structured timestamp and discharge status data in the MIMIC-IV (v 3.0).
Ethics statement
This study was carried out in strict adherence to the ethical principles outlined in the Declaration of Helsinki. The ethical review board at Beth Israel Deaconess Medical Center granted a waiver for informed consent, as the research utilized de-identified data sourced from the MIMIC-IV (v 3.0) database. Furthermore, the ethics review board exempted the study from formal ethical approval, considering that it involved anonymized data and did not require patient consent, ensuring the confidentiality and privacy of all participants were maintained throughout the research process.
Statistical analysis
Continuous variables with a normal distribution were expressed as mean ± standard deviation, and group comparisons were conducted using t-tests or analysis of variance. For continuous variables that did not follow a normal distribution, values were reported as median (interquartile range), and group differences were assessed using the Mann–Whitney U test or Kruskal–Wallis test. Categorical data are presented as frequencies (%), with group comparisons performed using the chi-square test or Fisher’s exact test.
The association between ACAG and patient prognosis was evaluated through Cox proportional hazards models, reporting hazard ratios (HR) with 95% confidence intervals (CI). Three distinct models were constructed to account for potential confounders: Model 1 (baseline, unadjusted), Model 2 (adjusted for age, sex, and ethnicity), and Model 3 (adjusted for age, sex, ethnicity, serum creatinine level, white blood cell count, platelet count, lactate, hypertension, heart failure, respiratory failure, diabetes, vasopressin administration, continuous renal replacement therapy, and Sequential Organ Failure Assessment).
Kaplan–Meier survival analysis was conducted to evaluate survival outcomes at various ACAG levels, and log-rank tests were applied to compare the survival curves between the two groups. Restricted cubic spline (RCS) models were utilized to examine the potential dose-response relationship between ACAG levels and mortality at different time intervals. Additionally, subgroup analyses were performed to assess the consistency of ACAG’s prognostic value across subgroups categorized by age, sex, hypertension, diabetes, and respiratory failure.
A two-tailed significance level of P < 0.05 was used for all statistical tests. Data analysis was carried out using R software (version 4.2.2), STATA (version 16.0), and IBM SPSS (version 22.0; IBM Corp., Armonk, NY, USA).