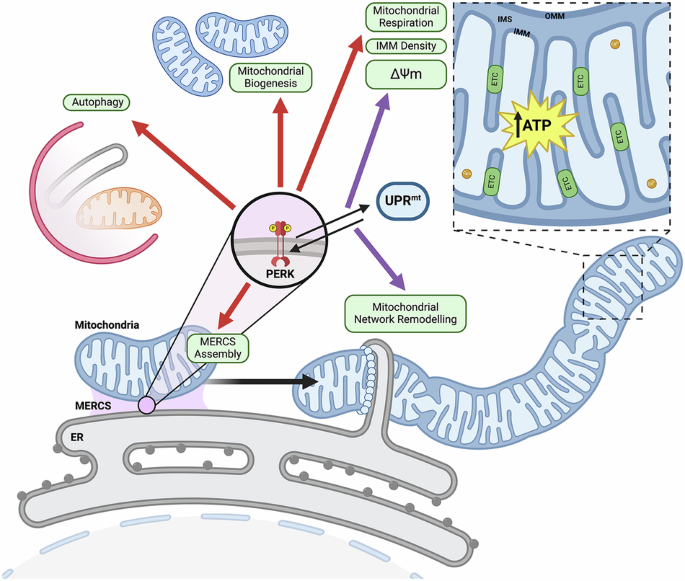
PERK promotes myogenesis in myoblasts subjected to physiological levels of ER stressors
To investigate the role of adaptive UPRER during myogenesis, C2C12 myoblasts were exposed to a range of concentrations of the ER stressor tunicamycin (TM) for 8 h, followed by differentiation into myotubes (Supplementary Fig. 1A). Notably, treatment of myoblasts with 0.2 μg/ml TM significantly enhanced the myogenic potential of myoblasts. However, concentrations above 0.4 μg/ml were detrimental and promoted cell death (Supplementary Fig. 2A). To determine if the response was an ER stress response or specific to TM, the SERCA inhibitor thapsigargin (TG) was also used. A low concentration of TG (10 nM) also promoted an increase in myogenic parameters (Supplementary Fig. 2B). Inhibition of PERK with AMG PERK44 (AMG) resulted in no difference in myogenesis parameters compared to controls (Fig. 1A). Furthermore, the combined AMG + TM treatment group (AMG + TM) exhibited no change when compared to the AMG group (Fig. 1A). However, inhibition of IRE1α with MKC8866 (MKC) led to a significant decrease in all the parameters compared to controls (Fig. 1A). Nevertheless, the MKC + TM group exhibited an increase in myogenic parameters compared to MKC alone (Fig. 1A). Interestingly, TM-treated myoblasts exhibited a significant decrease in cell viability, with an even greater decrease observed in the AMG + TM group (Supplementary Fig. 2C).
A MF20 immunostaining following TM 0.2 μg/mL treatment of myoblasts resulted in an increase in myotube diameter, area and fusion index. Mean ± SEM; *p ≤ 0.05, **p ≤ 0.01, ***p ≤ 0.001 and ****p ≤ 0.0001 One-way ANOVA. B PCR analysis of mRNA expression levels of XBP1s/XBP1u in TM-treated myoblasts. Each lane represents independent biological replicates, data represented as mean ± SEM; ****p ≤ 0.0001 Student’s t test. C–E Western blot of ATF4, CHOP and p-EIF2α/EIF2α in TM-treated myoblasts. Each lane represents independent biological replicates, data represented as mean ± SEM; *p ≤ 0.05 and **p ≤ 0.01 One-way ANOVA. F MF20 immunostaining following TM treatment 0.2 μg/mL of myotubes, n = 5. Scale 275 μm. Mean ± SEM; Student’s t test.
PCR analysis confirmed activation of the IRE1α arm of the UPRER, with a shift toward the spliced, active form of XBP1 (XBP1s) following TM treatment (Fig. 1B). Western blot analysis of UPRER markers revealed no significant changes in the ER chaperone GRP78, though there was an increasing trend in eIF2α phosphorylation (Supplementary Fig. 2D). There was an increase in the levels of ATF4 in MKC + TM-treated cells, and increasing trend in eIF2α phosphorylation, while CHOP increased following TM treatment and was elevated in both AMG + TM and MKC + TM groups (Fig. 1C–E). To evaluate the different UPR pathways, we performed a qPCR analysis of markers of the mammalian UPRER (Hspa5, Dnajc3, Ddit3, Herpud1, Pdia4 and Edem1) [44] and UPRmt (Atf5, Lonp1, Hspe1, Hspa1a, Hspd1 and Hsp90aa1) [45]. A similar response in all UPRER markers was observed, a slight increase in gene expression with the TM treatment, however there was a significant increase in levels of UPRER genes following TM treatment in combination with the PERK inhibitor (Supplementary Fig. 2E). The expression of UPRmt genes Atf5 and Lonp1, follow the same pattern as the UPRER markers, however, the gene expression of Hspe1, Hspa1a, Hspd1 and Hsp90aa1 did not change (Supplementary Fig. 2F). Similar to inhibition of PERK with AMG44, knock-down of PERK (siPERK) in myoblasts decreased myotube diameter following differentiation. Knock-down of PERK or CHOP combined with the TM treatment, exhibited a reduction in myotube area and fusion index compared to siRNA CNT (Supplementary Fig. 2E). Additionally, TM treatment of differentiated, untreated myotubes did not result in any significant differences in the myotube parameters (Fig. 1F). Collectively, these findings demonstrate that inducing mild ER stress in myoblasts improved myogenesis and identified an essential role of PERK in adaptive UPR signalling.
PERK promotes MERCS assembly and mitochondrial adaptations during adaptive UPR
The effects of TM treatment (0.2 μg/ml for 8 h) and/or PERK inhibition on mitochondrial content and function were evaluated in myoblasts (Fig. 1A). MitoTracker Green staining was used to assess mitochondrial content and increased with TM treatment. No differences were observed between the AMG group and the controls (Fig. 2A). Mitochondrial ROS was assessed using MitoSOX staining and there was no change in MitoSOX staining in the TM and AMG groups. However, an increase in fluorescence was observed in the AMG + TM group (Fig. 2A). Additionally, MitoTracker Green and TMRE staining was used to assess mitochondrial membrane potential (ΔΨm), there was a significant increase in both MitoTracker Green and TMRE staining following TM treatment. The ratio of the intensities indicated that TM treatment promoted mitochondrial biogenesis and enhanced ΔΨm (Supplementary Fig. 2F). Both the mitochondrial fusion protein MFN2, which plays a role in mitochondrial-ER tethering [46, 47], and the mitochondrial content indicator TOM20 increased with TM treatment (Fig. 2B, C). The oxygen consumption rate of C2C12 myoblasts demonstrated enhanced basal and maximal respiration, non-mitochondrial respiration, and ATP production in TM-treated cells compared to controls, AMG, and AMG + TM groups (Fig. 2D, E). Furthermore, transmission electron microscopy (TEM) organelle ultrastructure analysis of myoblasts demonstrated an increase in the membrane surface area of mitochondria (SA), mitochondrial elongation (aspect ratio) following TM treatment; these adaptations were blocked by PERK inhibition (Fig. 2F, G). Notably, these mitochondrial adaptations were preserved following differentiation into myotubes (Fig. 2I, J). Additional parameters, including mitochondrial volume fraction, cristae membrane density (SA IMM/OMM) and ER surface area, increased in both myoblasts and subsequent myotubes following TM treatment (Supplementary Fig. 2G). The evaluation of MERCS surface area demonstrated an expansion of mitochondrial and ER membranes that are in close proximity following TM treatment. The formation of these expanded subdomains was blocked by inhibition of PERK (Fig. 2F–H). The increase in MERCS surface area was sustained after differentiation into myotubes (Fig. 2I–K). Together, the data demonstrates that PERK is required during adaptive UPRER to form MERCS and increase mitochondrial content and function in myoblasts, which were maintained following differentiation into myotubes.
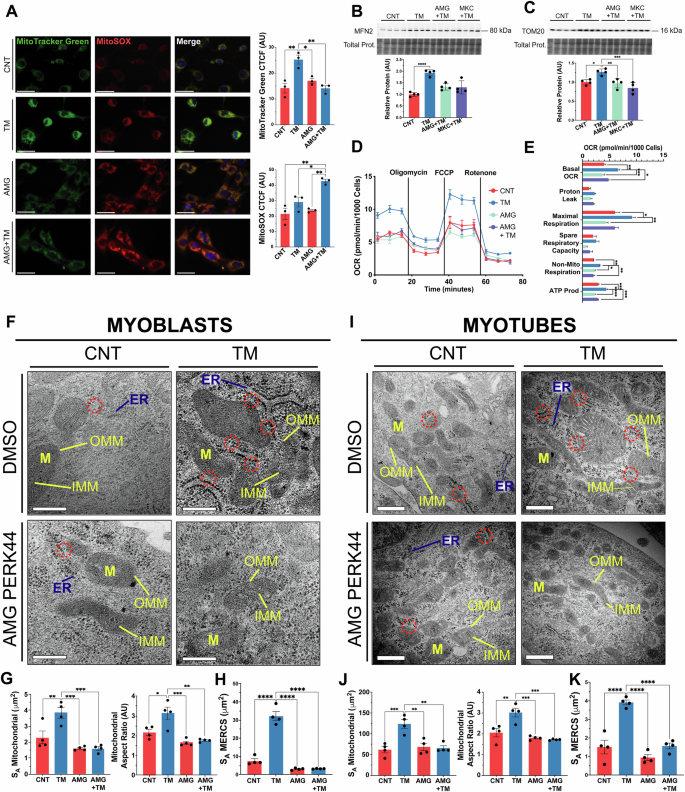
A TM treatment increased mitochondrial content (MitoTracker Green) but did not affect MitoSOX staining; n = 3. Scale 40 μm. Mean ± SEM; * p ≤ 0.05 and **p ≤ 0.01 One-way ANOVA. B, C Increased levels of MFN2 and TOM20 in TM-treated myoblasts. Each lane represents independent biological replicates, data represented as mean ± SEM; *p ≤ 0.05 and **p ≤ 0.01 One-way ANOVA. D, E TM treatment of myoblasts increased basal and maximal respiration rate, ATP production and non-mitochondrial respiration. Mean ± SEM; *p ≤ 0.05, **p ≤ 0.01, ***p ≤ 0.001 and ****p ≤ 0.0001 One-way ANOVA. F, G, H Representative TEM images of sections of myoblasts. Mitochondrial surface area, aspect ratio and MERCS surface area increased with the TM treatment. PERK inhibition resulted in no differences compared to the control.; n = 4. Scale 200 nm. Mean ± SEM; *p ≤ 0.05, **p ≤ 0.01, ***p ≤ 0.001 and ****p ≤ 0.0001 One-way ANOVA. I, J, K Representative TEM images of sections from myotubes following TM treatment of myoblasts demonstrating the increase in mitochondrial surface area, aspect ratio and MERCS surface area was maintained in myotubes following TM treatment.; n = 4. Scale 200 nm. Mean ± SEM; *p ≤ 0.05, **p ≤ 0.01, ***p ≤ 0.001 and ****p ≤ 0.0001 One-way ANOVA.
PERK is required for adaptive UPRER activation of autophagy and mitophagy
To determine the mechanisms underlying the adaptations promoted by the UPRER in myoblasts, proteomic changes induced by an 8 h treatment with 0.2 μg/ml TM was performed. Global label-free proteomics quantified 2513 proteins, 71 proteins were significantly upregulated and 27 downregulated following TM treatment (Fig. 3A). Enrichment analysis of the 71 significantly upregulated proteins identified several pathways and proteins involved in Mitophagy and mitochondrial ADP/ATP transport (ADRO, TPP1, TXTP, MTDC, SYHM, RM12, KAPCA, ADT1 and ADT2), indicating active remodelling of the mitochondrial network and mitochondrial respiration (Supplementary Fig. 2J, K). Also, upregulated were proteins related to Cell cycle and differentiation (PTBP3, RCC1, CCNK, MD1L1 and MYH10) (Fig. 3A, B). One of the most significantly upregulated proteins was ERD22, a member of the KDELR family highly involved in the maintenance of ER homeostasis during adaptive UPRER signalling [48]. There was a significant increase in gene expression of Kdelr2 following TM treatment (Supplementary Fig. 2L). No significant pathway enrichment was identified among the 27 downregulated proteins, which spanned diverse biological processes, including mitochondrial RNA processing and protein translation (4EBP1, MRT4, RPR1B and EI2BA) (Fig. 3A).
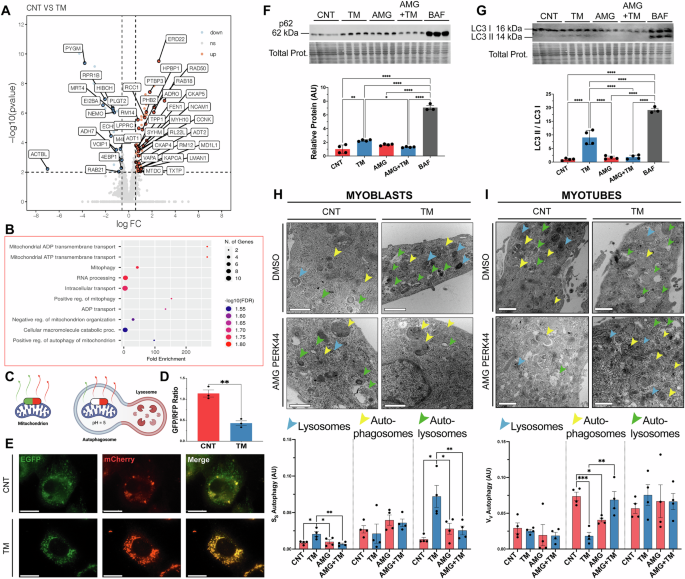
A Volcano plot of LFQ proteomic data of protein abundance following TM treatment (FDR = 1.58%). The cut-offs (represented as dotted lines) for significant changes are FC > 1.5 and P < 0.01. Blue dots indicate down-regulated proteins, red dots indicate up-regulated proteins. Four biological replicates per condition. B GOBP ShinyGO enrichment of significantly upregulated proteins. C Graphical diagram of the pH-sensitive construct for visualisation of mitochondrial turnover. D, E Increased mitophagy in TM treated myoblasts, represented by a decrease in the GFP/RFP ratio.; n = 3. Mean ± SEM; **p ≤ 0.01 Student’s t test. Scale 25 μm. F, G Western blot of protein extracts for p62 and LC3 II/I. Each lane represents independent biological replicates, data represented as mean ± SEM; *p ≤ 0.05, **p ≤ 0.01 and ***p ≤ 0.001 One-way ANOVA. H Representative TEM images of sections of TM treated myoblasts and quantification of the lysosome, autophagasomes and autolysosome fractions. n = 4. Scale 400 nm. Mean ± SEM; *p ≤ 0.05 and **p ≤ 0.01 One-way ANOVA. I Representative TEM images of sections of myotubes treated with TM at myoblast stage and quantification of lysosome, autophagasome and autolysosome fractions. n = 4. Scale 400 nm. Mean ± SEM; *p ≤ 0.05, **p ≤ 0.01 and ***p ≤ 0.001 One-way ANOVA.
To further explore mitochondrial turnover, live-cell imaging was performed using the mitophagy reporter plasmid [Cox8-EGFP-mCherry] [49], transfected into myoblasts before TM treatment. The reporter contains a pH-sensitive GFP and a pH-stable RFP to track mitochondrial turnover; GFP fluorescence is quenched in acidic lysosomes, while RFP remains stable, allowing an estimation of mitophagy (Fig. 3C). TM treatment significantly reduced the GFP/RFP ratio compared to the control group, indicating an induction of mitophagy (Fig. 3D, E). Western blot analysis of autophagy-related proteins revealed that ULK1 levels were elevated in the TM group compared to the CNT, AMG, and AMG + TM groups (Supplementary Fig. 2M). p62 levels increased in the AMG and AMG + TM groups compared to the CNT and TM groups, indicating reduced autophagic flux (Fig. 3F). Finally, increased expression of ATG5 (Supplementary Fig. 2N) and LC3-II/I (Fig. 3G) in the TM group indicates enhanced autophagosome formation. Ultrastructure analysis of the autophagic bodies by TEM, evaluated changes in the volume fraction of lysosomes, autophagosomes and autolysosomes from myoblasts and myotubes. Myoblasts exhibited an apparent increase in the volume fraction of lysosomes and autolysosomes in the TM group compared to CNT, AMG and AMG + TM groups (Fig. 3H). In contrast, myotube analysis indicated no change in lysosome or autolysosomes volume fractions between groups, although there was a decrease in autophagosome volume in the TM group compared to the CNT and AMG + TM groups (Fig. 3I). Changes in [Ca2+]i showed a slight, but not significant, increase in the maximal increase of store-operated calcium entry (SOCE) from the TM-treated myoblasts compared to controls (Supplementary Fig. 2O). Additionally, ER volume was assessed using an ER-targeting plasmid [ER (KDEL)-mNeonGreen] to estimate the ER membrane area relative to cellular surface area, revealing a significant expansion in ER membrane area following TM treatment (Supplementary Fig. 2P). Overall, proteomic and ultrastructural analyses revealed that TM treatment induces mitophagy and enhances autophagic flux during myogenesis. These adaptations depend on PERK activity and potentially play a crucial role in regulating organelle turnover.
Early-life induction of the UPRER extends lifespan and preserves healthspan in C. elegans
C. elegans was used as a physiological model to assess the role of UPRER signalling in a whole organism. To replicate the in vitro myogenesis model, worms were treated at an early developmental stage. Following bleaching, embryos were harvested and exposed to 1.25 μg/ml TM in S Medium for 24 h and larvae plated and allowed to develop normally (Supplementary Fig. 1B) [50]. There was an increase in the longevity of TM-treated worms compared to controls (Fig. 4A). To determine if the response was an ER stress response or specific to TM, the SERCA inhibitor TG was used. Treatment with 150 nM of TG also promoted an increase in lifespan and increased filamentous mitochondrial network (Supplementary Fig. 3A, B). Reproductive potential was significantly reduced in the TM group (Fig. 4B). Importantly, this decrease in progeny was not associated with increased embryo lethality (Supplementary Fig. 3C). Interestingly, TM-treated worms exhibited increased body length compared to controls (Fig. 4C). The activation of both the UPRER and the UPRmt was confirmed using transcriptional GFP reporter strains for hsp-4 (orthologue of mammalian HSPA5/Grp78) and hsp-6p (ortholog of the human mtHSP70). TM treatment resulted in greater UPRER and UPRmt activation capacity compared to controls (Fig. 4D, E). Analysis of the IRE-1 branch of the UPR revealed increased splicing of XBP-1 in TM-treated worms (Fig. 4F). The survival of the worms against a range of different toxicants was assessed. The resistance of the TM treated group against sodium arsenite, the redox cycler Paraquat and the organic peroxide tBuOOH was higher than the control group at adult day 1 (Fig. 4G–I). CeleST (C. elegans Swim Test) was performed to assess physical fitness and mobility during ageing [42]. The fitness levels were evaluated on days 1, 5, 10 and 15 of adulthood. Fitness markers including wave initiation rate, travel speed and activity index decreased with age in both groups but remained significantly higher in TM-treated worms compared to controls at all time points (Fig. 4J, Supplementary Fig. 3D, E). Conversely, frailty markers including stretch, average body curvature and curling increased with age in both groups, but these were consistently lower in the TM group, indicating better maintenance of physical health in the TM-treated groups (Fig. 4K, Supplementary Fig. 3F, G). The results demonstrate that early-life UPRER activation extends lifespan, increases stress resistance and promotes healthspan by preserving physiological fitness and reducing frailty during ageing.
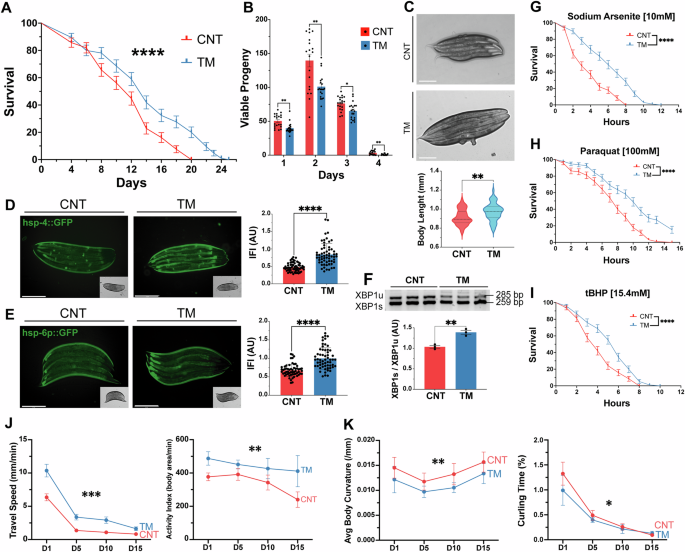
A Lifespan assay of TM treated N2 strain. Kaplan–Meier survival plots of two independent experiments initiated with 100 animals/group. Mean ± SEM; ****p ≤ 0.0001 Log-rank (Mantel-Cox) test. B TM treatment decreased progeny in N2 wild-type C. elegans. Data from 20 animals/group. Mean ± SEM; * p ≤ 0.05 and **p ≤ 0.01 Student’s t test. C Body length of N2 wild-type TM-treated worms. Data from 20 animals/assay. Mean ± SEM; **p ≤ 0.01 Student’s t test. D, E Activation of UPR assessed by hsp-4::GFP (UPRER)and hsp-6p::GFP (UPRmt) following TM treatment. Scale 275 μm. Mean ± SEM of at least 20 animals/assay. ****p ≤ 0.0001 Student’s t test. F Semiquantitative PCR analysis of expression ratio between XBP1s:XBP1u transcripts. n = 3, Each lane represents independent biological replicates, data represented as mean SEM; **p ≤ 0.01 Student’s t test. G, H, I Survival of wild type in Sodium Arsenite, tBuOOH and Paraquat. Kaplan–Meier survival plots of two independent experiments initiated with 45 animals/group. Mean ± SEM; ****p ≤ 0.0001 by Log-rank (Mantel-Cox) test compared with wild-type control. J CeleST physical fitness parameters at days 1, 5, 10, and 15. Data mean of at least 30 animals/assay. K CeleST physical frailty parameters at days 1, 5, 10, and 15 individual values controls and TM-treated worms during ageing. Data mean of at least 30 animals/assay.
Early-life induction of the UPR promotes lifespan extension in C. elegans through modulation of lipid metabolism and lysosome activation
As TM treatment of myoblasts resulted in improved myogenesis, while treatment of myotubes was detrimental, we assessed whether the adaptations promoted by the UPRER during early nematode development were similar to TM treatment of adult worms. TM treatment (1.25 and 5 μg/ml for 24 h) was performed during L4 to adult Day1 developmental stage of C. elegans. Both TM treatments (1.25 and 5 μg/ml) at L4 stage resulted in a significant reduction in lifespan (Fig. 5A), along with decreased resistance to paraquat and sodium arsenite (Fig. 5B, C). Interestingly, no change in resistance to sodium arsenite was observed in worms treated with the lower TM dose (1.25 μg/ml) (Fig. 5B). This highlights that the beneficial effects of TM treatment occurred only at an early developmental stage and treatment of adult worms resulted in negative effects similar to the myogenesis model.
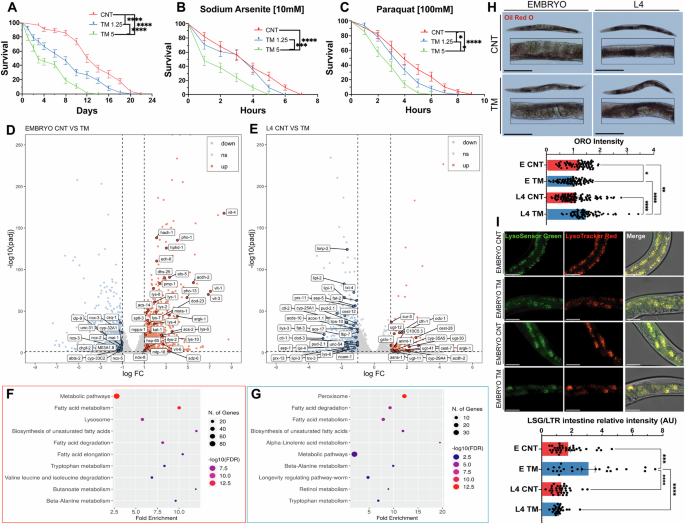
A Lifespan analysis of N2 strain treated with TM at L4 stage. Kaplan–Meier survival plots of two independent experiments initiated with 100 animals. Mean ± SEM; **** p ≤ 0.0001 Log-rank (Mantel-Cox). B, C Decreased survival of N2 worms treated with TM at L4 stage in 10 mM sodium arsenite and 100 mM Paraquat. Kaplan–Meier survival plots of two independent experiments initiated with 50 animals/group. Mean ± SEM; *p ≤ 0.05, ***p ≤ 0.001 and ****p ≤ 0.0001 Log-rank (Mantel-Cox). Volcano plot of differentially expressed genes (DEGs) following TM treatment of embryos (D) or adults (E), red significantly upregulated genes and blue significantly downregulated genes. Four biological replicates per condition. F Dot plot of Shiny GO KEGG analysis of DEGs in embryo group. Upregulated pathways are in red and downregulated pathways are in blue. G Dot plot of Shiny GO KEGG analysis of DEGs in L4 group. Upregulated pathways are in red and downregulated pathways are in blue. H Oil Red O stained N2 worms following TM treatment at embryo or L4 stage. 3 independent experiments with at least 20 animals per strain; Scale 275 μm. Mean ± SEM; *p ≤ 0.05, **p ≤ 0.01 and ****p ≤ 0.0001 by ANOVA. I Intestine of wild-type worms incubated with LysoSensor Green (LSG) indicator of lysosomal pH and LysoTracker Red (LSR) indicator of lysosome content, three independent experiments with 10 animals per condition; Scale 50 μm. Mean ± SEM; ***p ≤ 0.001 and ****p ≤ 0.0001 by ANOVA.
RNA sequencing was performed to determine the molecular mechanisms underlying the different responses dependent on the developmental stage. A transcriptome analysis was conducted on Day 1 adults that were treated with TM 1.25 μg/ml at embryonic stage (EMBRYO group) (Fig. 5D) or treatment with TM at L4 stage (L4 group) (Fig. 5E). Differentially expressed genes (DEGs) were analysed (Log2-fold change >1 and adjusted p-value < 0.05) from EMBRYO (FDR = 2.38%) and L4 separately (FDR = 1.1%). DEGs from EMBRYO-treated groups reported 1249 upregulated and 2042 downregulated genes. Functional enrichment analysis of the upregulated genes identified pathways related to lipid metabolism and lysosome activation (Fig. 5F). Both pathways have previously been described as key intermediates in the UPR regulation of ageing [51]. Gene set enrichment analysis (GSEA) indicated enhanced expression of genes associated with autophagy (lysosomal pathways) and mitochondrial activity (oxidative phosphorylation) (Supplementary Fig. 3I). Lipid biosynthesis emerged as the most prominent upregulated pathway and there was an increase in most intermediates of this pathway (Supplementary Fig. 4A). Gene set enrichment analysis (GSEA) indicated positive enrichment of genes associated with autophagy (lysosomal pathways) and mitochondrial activity (oxidative phosphorylation) (Supplementary Fig. 4B). In contrast, the L4 group resulted in 146 upregulated and 811 downregulated genes (Fig. 5F). Functional enrichment of the downregulated genes highlighted pathways involved in lipid metabolism and C. elegans longevity (Fig. 5G). Pathway enrichment analysis identified a reduction in the expression of intermediates in the lipid biosynthesis pathway in the L4 treated group (Supplementary Fig. 4D). GSEA revealed decreased expression of genes related to autophagy (lysosomes) and mitophagy in L4-treated worms (Supplementary Fig. 4E). These results were validated by qPCR of genes involved in lysosomal function (vha-6, asah-1 and cpr-1) and lipid metabolism (acox-1.5, elo-2 and fat-5), increased expression in the EMBRYO treated group and decreased expression of fat-5 and vha-6 in the L4 treated groups (Supplementary Fig. 4G, H). Finally, comparing the functional enrichment of downregulated genes in the EMBRYO group with the upregulated genes in the L4 group demonstrated shared pathways related to metabolism (Supplementary Fig. 3C–F). These findings suggest that UPRER activation during early development promotes beneficial adaptations that contribute to lifespan extension, whereas induction later in life leads to a decline in similar protective mechanisms, particularly affecting lipid metabolism and autophagy.
RNA sequencing highlighted the effects of TM treatment on lipid metabolism and the lysosome. Oil Red O staining, which stains neutral triglycerides and lipids, was performed in the different groups [40]. Interestingly, TM treatment decreased lipid staining in the EMBRYO group compared to the controls (Fig. 5J). However, in the L4 group, TM treatment increased lipid staining compared to the control group (Fig. 5J), supporting the transcriptomic data of increased expression of lipid-related genes in embryo-treated worms but a decrease in L4 treated worms. The lysosomal content and acidity were estimated using the LysoSensor green/LysoTracker red (LSG/LSR) ratio in the intestine [52]. Results demonstrated decreased pH in the lysosomes of N2 worms subjected to the TM treatment at the embryonic stage. No changes in lysosomal pH were reported in the animals treated at the L4 stage (Fig. 5K). An upregulation of lysosomal genes and increased intestinal lysosomal acidity in response to UPRER activation has previously been demonstrated to improve proteostasis and longevity in C. elegans [53]. RNAi knockdown of lmp-1 (ortholog of LAMP1, a lysosomal membrane protein important for lysosomal function) had no effect on longevity or in combination with TM treatment (Supplementary Fig. 3L). RNAi knockdown of lmp-1 also resulted in a more fragmented mitochondrial network after TM treatment (Supplementary Fig. 3M). These results suggest activation of autophagy is required for the adaptive UPRER increase in longevity and mitochondrial morphology. Overall, the effects of TM treatment were dependent on the developmental stage and resulted in the opposite expression of genes involved in lipid metabolism, and subsequent effects on longevity and oxidative stress resistance. The results support the findings in the myogenesis model and highlight increased plasticity for adaptations following UPRER induction at early developmental stages.
Early-life UPR induction stimulates MERCS formation, mitochondrial capacity and mitophagy in C. elegans
In order to determine if there was a similar adaptive response in nematodes to the myogenesis model following TM treatment, the effects on mitochondrial content were assessed using a transcriptional Pcox-4::GFP reporter [54]. The fluorescence intensity increased with TM treatment (Fig. 6A). MitoTracker Red staining was used to estimate mitochondrial membrane potential and there was a significant increase in the fluorescence intensity following treatment with TM (Fig. 6B), which was also observed using TMRM staining (Supplementary Fig. 3N). In addition, mitochondrial superoxide production was evaluated by MitoSOX staining, demonstrated a reduction in the TM group (Supplementary Fig. 3O). Mitochondrial respiration was assessed using adult day 1 C. elegans following treatment with TM at the embryo stage. TM-treated worms showed a slight, non-significant increase in both basal and maximal OCR, and there was a significant increase in non-mitochondrial respiration (Fig. 6C). TEM was used to analyse the mitochondrial ultrastructure of body wall muscle cells from C. elegans (Supplementary Fig. 1D). Stereological analysis revealed increased mitochondrial surface area in the TM group (Fig. 6D). Moreover, mitochondria from the TM treatment group, exhibited an increased aspect ratio, indicating more elongated, fused mitochondria. The surface area ratio between the inner (IMM) and outer mitochondrial membranes (OMM) was also significantly increased, reflecting a denser IMM structure (Fig. 6D), which may contribute to the observed improvements in mitochondrial function.
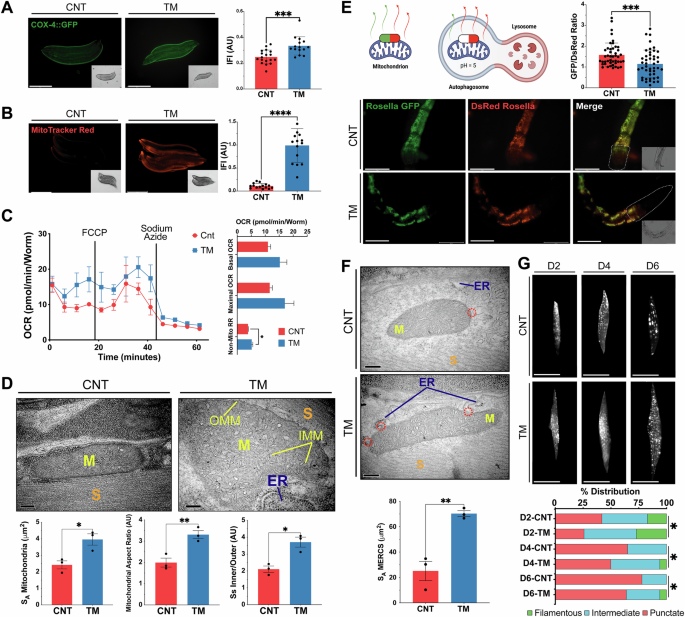
A Mitochondrial content assessed using transgenic day 1 worms pcox-4::gfp following TM treatment. Three independent experiments with 15 animals/group. Scale 275 μm. Mean ± SEM; ***p ≤ 0.001. Student’s t test. B MitoTracker red staining of N2 strain following TM treatment. Three independent experiments were initiated with 15 animals/group. Scale 275 μm. Mean ± SEM; ****p ≤ 0.0001. Student’s t test. C Oxygen consumption of adult day 1 N2 worms following treatment with TM. Data from 3 independent experiments with 8–12 animals per well. Mean ± SEM; * p < 0.05 Student’s t test. D Representative TEM images of sections from day 1 C. elegans body wall muscle cells. Mitochondrial surface area, aspect ratio and IMM/OMM surface area ratio were calculated. Scale 200 nm. Mean ± SEM; *p ≤ 0.05 and **p ≤ 0.01 Student’s t test. E Representative images of the head region of the pmyo-3::TOMM-20::Rosella day 1 reporter strain following TM treatment from 3 independent experiments initiated with 15 animals/group; **p < 0.01 Student’s t test. Scale 75 μm. F Representative TEM images of sections from day 1 C. elegans body wall muscle cells. Representative images of 3 independent experiments initiated with 10 animals/group. Scale 200 nm. Mean ± SEM; **p ≤ 0.01 Student’s t test. G Representative images of day 2, 4 and 6 pmyo-3::mitogfp reporter strain for muscle mitochondrial morphology, classified as either filamentous, intermediate or punctate. Three independent experiments were initiated with 15 animals/condition. Scale 50 μm. n = 3 *p < 0.05 Chi-square.
Mitochondrial turnover was assessed using the pmyo-3::TOMM-20::Rosella reporter strain, containing a pH-sensitive Rosella biosensor composed of a pH-sensitive GFP and a pH-stable RFP to track mitochondrial turnover in body wall muscle [55]. TM-treated worms exhibited a significantly lower GFP/DsRed fluorescence ratio, indicating increased mitophagy and enhanced mitochondrial turnover during adulthood (Fig. 6E). RNAi knockdown of pdr-1 (ortholog of Parkin, regulator of mitochondrial turnover) had no effect on longevity but in combination with TM treatment decreased lifespan compared with TM alone, RNAi knockdown of pdr-1 resulted in a more fragmented mitochondrial network (Supplementary Fig. 3J, K). RNAi knockdown of lgg-1 (ortholog of LC3, required for autophagosome maturation) following TM treatment resulted in no change in lifespan or on mitochondrial morphology (Supplementary Fig. 3H, I). These results indicate activation of mitophagy is required for the increased longevity and changes in mitochondrial morphology following adaptive UPRER signalling.
As MERCS are essential for mitochondrial fission, TEM analysis was performed to quantify the surface area of mitochondria in close contact with the ER (<50 nm). TM-treated worms resulted in a marked increase in MERCS surface area compared to controls (Fig. 6F). Mitochondrial morphology was evaluated during ageing using a genetic pmyo-3::mitoGFP reporter, for visualisation of the mitochondrial network from body wall muscle. Images were taken on days 2, 4 and 6 of adulthood and classified as punctate, intermediate or filamentous, depending on the mitochondrial network morphology [56]. Ageing resulted in a progressive shift towards more punctate (fragmented) networks (Fig. 6G). In contrast, TM-treated worms demonstrated a delayed onset of mitochondrial fragmentation, maintaining more filamentous and intermediate networks at all time points assessed (Fig. 6G). In order to investigate whether this response is redox dependent, the antioxidant N-Acetyl Cysteine (NAC) was used. TM treatment during early development in combination with NAC resulted in the repression of lifespan extension and increased mitochondrial fragmentation, indicating the beneficial adaptive UPR response has a redox component (Supplementary Fig. 3P, Q). Together, the data demonstrate that, similar to myoblasts, early-life TM treatment helps preserve mitochondrial network integrity and morphology during ageing, potentially through the formation of MERCS and regulation of mitochondrial turnover.
PEK-1 (UPRER) and ATFS-1 (UPRmt) crosstalk regulates the adaptations promoted by the UPR in C. elegans
To elucidate the mechanisms underlying UPR-mediated mitochondrial and physiological adaptations, we used mutant strains for the UPRER and UPRmt signalling arms to evaluate their response to early-life TM treatment. Both the ire-1(v33) and xbp-1(tm2482) mutant strains were viable. However, TM treatment resulted in developmental arrest at the larval stage (Supplementary Fig. 3A). This phenotype has previously been reported, generation of double mutants of ire-1 or xbp-1 with atf-6 or pek-1 promoted developmental arrest at larvae stage L2 [57]. highlighting the critical role of the IRE-1 arm in the resistance to ER stress. Similar to the N2 strain, treatment of the atf-6 (ok551) mutant strain with TM resulted in increased longevity and stress resistance to sodium arsenite but not paraquat but increased MitoTracker Red staining (Supplementary Fig. 5B). Interestingly, following TM treatment, atf-6 mutants exhibited a reduction in size at day 1 of adulthood, implying delayed development (Supplementary Fig. 5B). As the increased longevity and survival following TM treatment were also observed in N2 strain (Fig. 4A, G, H), it would suggest they are independent of ATF-6 signalling. Following TM treatment of the PEK-1 loss-of-function mutant strain (pek-1 (ok275)), there was a decrease in lifespan (Fig. 7A), resistance to paraquat was reduced but resistance to sodium arsenite was unaltered (Supplementary Fig. 5C). There was a decrease in MitoTracker Red fluorescence intensity in the TM-treated pek-1 mutants (Fig. 7B). The pek-1 mutant strain also had a reduction in size following TM treatment (Supplementary Fig. 5C). TM treatment of pek-1 mutant strain produced an opposite phenotype compared to the N2 strain, highlighting its importance for this adaptive response. TM treatment of ATFS-1 mutant (atfs-1 (tm4525)) also exhibited a decrease in lifespan (Fig. 7C); however, resistance to oxidative stressors was unaltered (Supplementary Fig. 5D). The ΔΨm of the TM-treated atfs-1 mutant strain decreased following TM treatment (Fig. 7D). Interestingly, TM-treated atfs-1 mutant exhibited no differences in size compared to the control group (Supplementary Fig. 5D). The results highlight that TM treatment of the atfs-1 mutant strain had similar results to the pek-1 mutant and an opposite phenotype to N2 WT strain, highlighting its importance for this adaptive response.
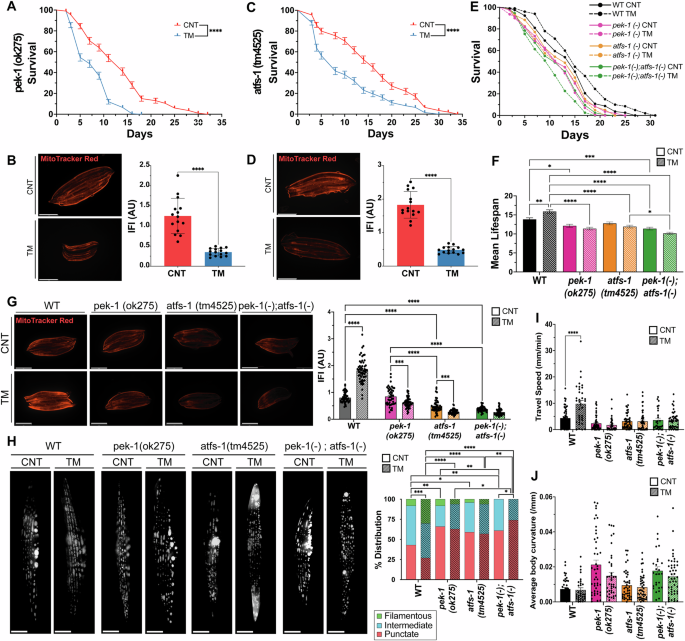
A Lifespan analysis of pek-1(ok275) strain following treatment with TM. Kaplan–Meier survival plots of two independent experiments initiated with 100 animals/group, ****p ≤ 0.0001 Log-rank (Mantel-Cox) test. B MitoTracker Red images of TM-treated day 1 pek-1(ok275) worms. Scale 275 μm. Mean ± SEM; ****p ≤ 0.0001 Student’s t test. C Lifespan analysis of atfs-1(tm4525) following treatment with TM. Kaplan–Meier survival plots of two independent experiments initiated with 100 animals/group, ****p ≤ 0.0001 Log-rank (Mantel-Cox) test. D MitoTracker Red images of TM-treated adult day 1 atfs-1(tm4525) worms. Scale 275 μm. Mean ± SEM; **** p ≤ 0.0001 Student’s t test. E Lifespan assay of N2 Wild-type, pek-1(ok275), atfs-1(tm4525) and pek-1;atfs-1 worms following TM treatment Kaplan–Meier survival plots of two independent experiments initiated with 100 animals per group. F Mean lifespan of N2, pek-1(ok275), atfs-1(tm4525) and pek-1;atfs-1 strains. *p ≤ 0.05, **p ≤ 0.01, ***p ≤ 0.001, ****p ≤ 0.0001 One-way ANOVA. G MitoTracker Red images of day1 N2, pek-1(ok275), atfs-1 (tm4525) and pek-1;atfs-1 strains. Data mean SEM of 45 animals/assay. *** p ≤ 0.001, ****p ≤ 0.0001 One-way ANOVA. H Images of pmyo-3::mitogfp reporter strain adult day4 N2 WT, pek-1(ok275), atfs-1(tm4525) and pek-1;atfs-1 backgrounds. 3 independent experiments with 15 animals/condition, n = 3; Scale 12 μm. *p ≤ 0.05, **p ≤ 0.01, ***p ≤ 0.001, ****p ≤ 0.0001 Chi-square. I CeleST physical fitness parameters at day 1 following TM treatment of N2 WT, pek-1, atfs-1 and pek-1;atfs-1 strains. Data from 3 independent experiments initiated with at least 10 animals per condition. Mean ± SEM; **p ≤ 0.01, ***p ≤ 0.001 One-way ANOVA. J CeleST physical fitness parameters that increase with age; average fitness parameters at day 1 following TM treatment of N2 WT, pek-1, atfs-1 and pek-1;atfs-1 mutant strains. Data from three independent experiments initiated with at least 10 animals/conditions. Mean ± SEM; **p ≤ 0.01 and ****p ≤ 0.0001 One-way ANOVA.
A double pek-1;atfs-1 mutant was generated to clarify the possible interaction of these signalling pathways and potential crosstalk of the UPRER and UPRmt. The phenotypic effects of TM treatment in the N2 wild-type strain, pek-1, atfs-1 and pek-1;atfs-1 strains were determined. All mutant strains had decreased lifespan compared to the WT group which had increased longevity (Fig. 7E, F, Supplementary Table 1). Interestingly, TM increased the size of N2 worms, but this effect was reversed in the pek-1 mutant and absent in the atfs-1 mutant (Supplementary Fig. 5E). The pek-1;atfs-1 double mutant exhibited a more severe reduction in body size than either single mutant, both under basal conditions and following TM treatment (Supplementary Fig. 5E). All mutant strains treated with TM had decreased resistance to sodium arsenite and paraquat compared to N2 strain (Supplementary Fig. 5E, Supplementary Tables 2, 3).
Mitochondrial membrane potential was significantly reduced in both the atfs-1 and pek-1;atfs-1 mutants compared to N2, while no differences were observed between the untreated N2 and the pek-1 mutant strain (Fig. 7G). TM treatment only increased mitochondrial membrane potential in N2 WT worms, with all mutants displaying lower MitoTracker Red staining post-TM treatment (Fig. 7G). To assess mitochondrial morphology in body wall muscle, strains were crossed with the pmyo-3::mitoGFP reporter strain and imaged at day 4 of adulthood. Control N2 WT worms had a balanced mitochondrial network with approximately 20% filamentous, 40% intermediate, and 40% punctate mitochondria. The pek-1 and atfs-1 mutants demonstrated increased punctate or more fragmented mitochondrial network (Fig. 7H). However, the pek-1;atfs-1 double mutant displayed a highly disrupted mitochondrial network, with no filamentous mitochondria present. TM treatment increased the percentage of filamentous mitochondria in N2 WT worms (~25%) and reduced the percentage of mitochondrial punctate (~25%). In contrast, the mitochondrial morphology of pek-1 and atfs-1 single mutants remained unchanged following TM treatment, while the pek-1;atfs-1 mutant exhibited further mitochondrial fragmentation (Fig. 7H). Finally, to assess physiological activity, CeLeST analysis was performed. In untreated conditions, fitness-related parameters were similar between WT, pek-1, atfs-1, and pek-1;atfs-1 mutants, while frailty parameters were slightly higher in the mutant strains (Fig. 7I, J, Supplementary Fig. 3F). Following TM treatment, WT worms had increased wave initiation rate, travel speed and activity index indicating increased fitness, this was not observed in any of the mutant strains (Fig. 7, Supplementary Fig. 3F). To dissect the mechanistic basis of this crosstalk we evaluated the cellular response to early-life ER stress. Downstream markers of the UPRER and UPRmt (hsp-4, a canonical UPRER target, and hsp-6, a mitochondrial chaperone and target of ATFS-1) exhibited a clear increase in both following TM treatment in the N2 strain. However, mutant strains pek-1(-), atfs-1(-) and pek-1(-);atfs-1(-) did not increase hsp-4 or hsp-6 following TM treatment suggesting both PEK-1 and ATFS-1 are required for adaptive UPR activation (Supplementary Fig. 5G).
Together, these results highlight the critical roles of PEK-1 and ATFS-1 in regulating lifespan, stress resistance and mitochondrial dynamics. The results indicate that under mild ER stress conditions, PEK-1 from the UPRER establishes crosstalk with ATFS-1 from the UPRmt pathway to promote increased lifespan, improved healthspan, enhanced stress resistance and greater mitochondrial function. Moreover, based on the gene expression profile of UPR markers, the slight increase in these markers with the TM treatment elicit an adaptive UPR activation, whereas the more drastic activation of the markers in the AMG + TM group could indicate an induction of maladaptive UPR signalling.
In summary, the data presented using both an in vitro myogenesis model and in vivo whole organism C. elegans, reveals that adaptive UPRER signalling through PERK and UPRmt, induces the assembly of MERCS and regulates mitochondrial adaptations following a low dose of an ER stressor at an early developmental stage. These adaptations promote myogenesis and extension of lifespan in C. elegans by enhancing organelle turnover and mitochondrial function, demonstrating the essential crosstalk between ER and mitochondrial stress responses in maintaining cellular and organismal homeostasis under physiological stress conditions.