Study design and participants
This study utilized data from the China Health and Retirement Longitudinal Study (CHARLS), a nationally representative longitudinal survey employing multistage stratified sampling. The initial national baseline survey (Wave 1) was conducted in 2011, enrolling 17,708 middle-aged and older adults across 450 villages from 150 districts in 28 Chinese provinces. Demographic and clinical information was collected via standardized questionnaires. Follow-up surveys were conducted biennially to triennially thereafter to monitor health outcomes. No additional interviews were conducted for this analysis. The study incorporated five waves of existing CHARLS data (2011, 2013, 2015, 2018, and 2020). The detailed methodologies and data collection procedures for CHARLS have been previously described [22]. Ethical approval was granted by the Peking University Biomedical Ethics Review Committee (IRB00001052-11015), and all participants provided written informed consent.
Fasting status, blood glucose, and triglyceride levels were obtained from blood samples collected during Waves 1 and 3. The exclusion criteria were as follows: (1) age ≤ 45 years; (2) prior CVD event or missing CVD data before Wave 3 (2015); (3) nonfasting status; (4) missing data for age, sex, C-reactive protein (CRP), fasting blood glucose (FBG), triglyceride (TG), high-density lipoprotein (HDL), low-density lipoprotein (LDL), or total cholesterol (TC); and (5) missing or abnormal waist circumference measurements (defined as values exceeding three standard deviations from the mean). The detailed inclusion and exclusion process is outlined in Fig. 1. The final analysis cohort comprised 4157 participants.
Flowchart of the study population.
Assessment of CTI changes
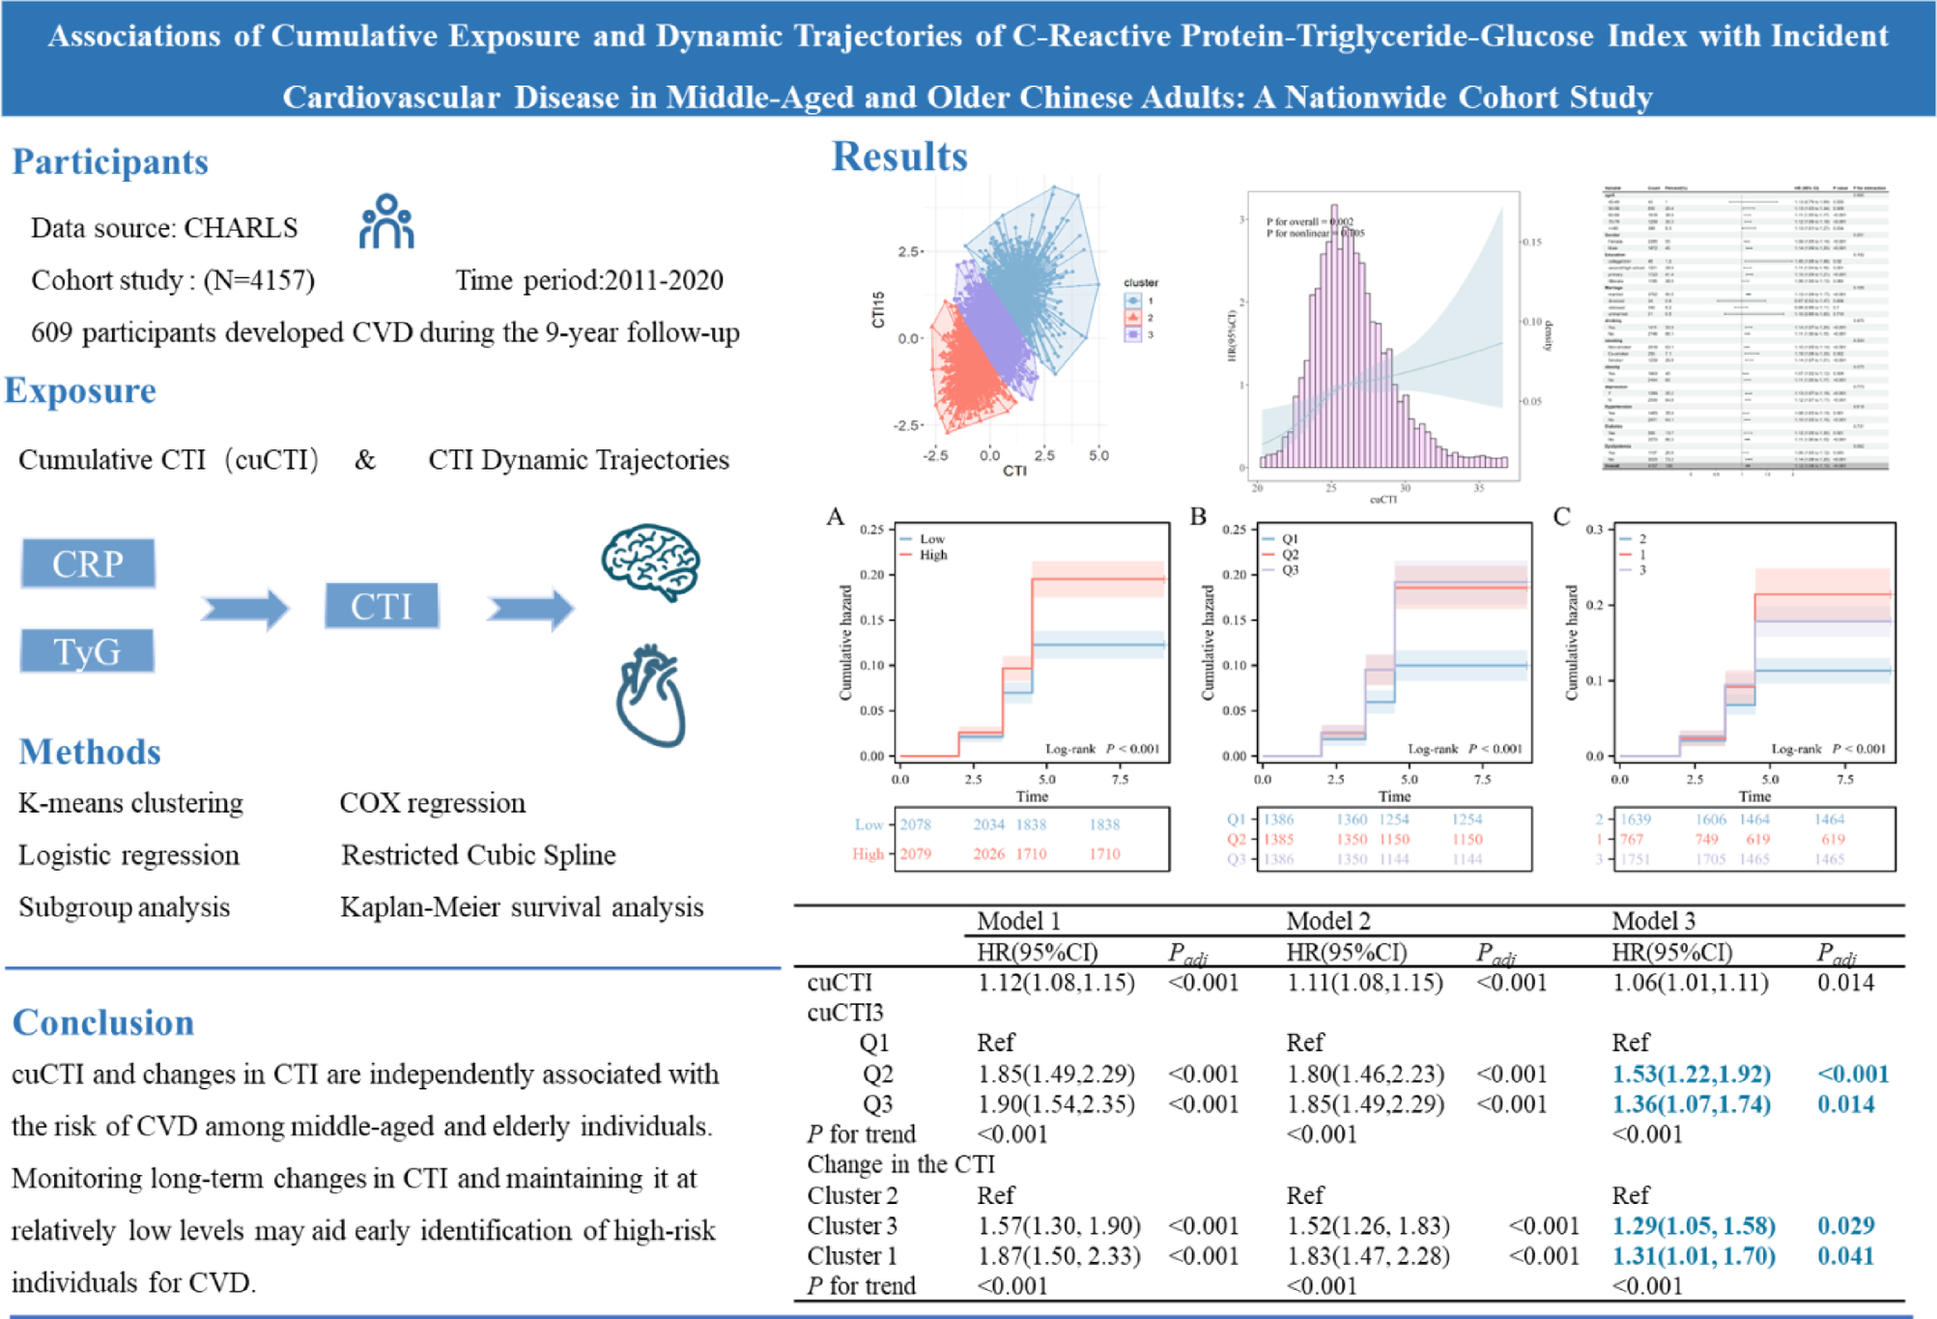
The TyG index, CTI, and cumulative CTI (cuCTI) were calculated via the following formulas: TyG index = ln [triglycerides (mg/dL) × glucose (mg/dL)/2]; CTI = 0.412 × ln(CRP [mg/L]) + ln(TG [mg/dL] × FPG [mg/dL])/2 [15].
The cumulative CTI (cuCTI) was calculated via a linear model as the product of the mean CTI values from 2012 and 2015 and the time interval, following the formula: cuCTI = (CTI₂₀₁₂ + CTI₂₀₁₅)/2 × time interval (2015 − 2012). CTI₂₀₁₂ and CTI₂₀₁₅ denote CTI measurements from 2012 (Wave 2) and 2015 (Wave 3), with a 3-year interval between measurements. The mean of these two time points was computed to reflect the average exposure level, then multiplied by the time duration to calculate long-term cumulative exposure. This approach adheres to the methodology for cumulative metabolic indices in the CHARLS cohorts, which is consistent with the approach described by Zou [23] and Lu [24].
Assessment of incident CVD
The presence of heart disease was determined by asking, “Have you been doctor-diagnosed with heart attack, coronary heart disease, angina, congestive heart failure, or other heart problems? Or have you been doctor-diagnosed with stroke?” CVD was defined as self-reported heart disease and stroke. CVD determination was consistent with prior studies using CHARLS data [20]. Time to CVD onset was determined as the period between the last study interview and the first documented CVD event.
Covariates
Covariates included sociodemographic characteristics (age, sex, marital status, education level, smoking status, alcohol consumption), health indicators (systolic blood pressure [SBP], diastolic blood pressure [DBP], hypertension, diabetes, dyslipidemia), and laboratory parameters (C-reactive protein [CRP], fasting blood glucose [FBG], total cholesterol [TC], high-density lipoprotein cholesterol [HDL-C], low-density lipoprotein cholesterol [LDL-C], glycated hemoglobin [HbA1c]. Hypertension was defined as SBP ≥ 140 mmHg, DBP ≥ 90 mmHg, or self-reported hypertension. Diabetes was defined as FBG ≥ 7.0 mmol/L, HbA1c ≥ 6.5% or self-reported diabetes diagnosis. Dyslipidemia was defined as TC ≥ 240 mg/dL, TG ≥ 150 mg/dL, LDL-C ≥ 160 mg/dL, or self-reported dyslipidemia.
Covariates included sociodemographic characteristics (age, sex, marital status, education, smoking, and drinking status), health status (systolic blood pressure (SBP), diastolic blood pressure (DBP), hypertension, diabetes, and dyslipidemia), and laboratory measurements (CRP, FBG, TG, TC, HDL-C, LDL-C).
Statistical analysis
Data analysis was performed via R Studio. Two-tailed P values < 0.05 were considered statistically significant. Continuous variables with a normal or approximately normal distribution are presented as the means ± standard deviations (SDs), whereas nonnormally distributed variables are reported as medians (interquartile ranges). Categorical variables are presented as frequencies and percentages. Baseline characteristics were compared across groups via analysis of variance (ANOVA) or the Kruskal‒Wallis test for continuous variables and the chi‒square test for categorical variables. Three multivariable models were constructed to evaluate associations between cuCTI and incident CVD: Model 1: unadjusted; Model 2: adjusted for sex, age, marital status, and education level; Model 3: further adjusted for BMI, drinking status, smoking status, depression, hypertension, dyslipidemia, diabetes, antihypertensive medication, antidiabetic medication, and lipid-lowering medication. The Benjamini‒Hochberg method was used to correct for multiple comparisons, controlling the false discovery rate (FDR) to reduce false-positive results. Kaplan‒Meier survival analysis was used to estimate cumulative CVD risk by cuCTI categories. Mediation analysis was performed to explore interactions between the CRP and TyG components of the CTI. A four-knot restricted cubic spline (RCS) model was used to assess nonlinear dose‒response relationships between cuCTI and CVD risk. Subgroup analyses were conducted stratified by age, sex, marital status, education level, BMI, hypertension, dyslipidemia, and diabetes via Cox proportional hazards regression. Sensitivity analyses were performed to validate the robustness of the findings: logistic regression models were used to evaluate associations between cuCTI and CVD incidence. Participants were clustered into subgroups on the basis of CTI trajectory patterns via K-means clustering, followed by logistic regression analysis. Analyses were repeated after excluding deceased participants. Participants in the 2020 follow-up were excluded from analysis to prevent potential COVID-19 pandemic effects on data reliability and endpoint event reporting.