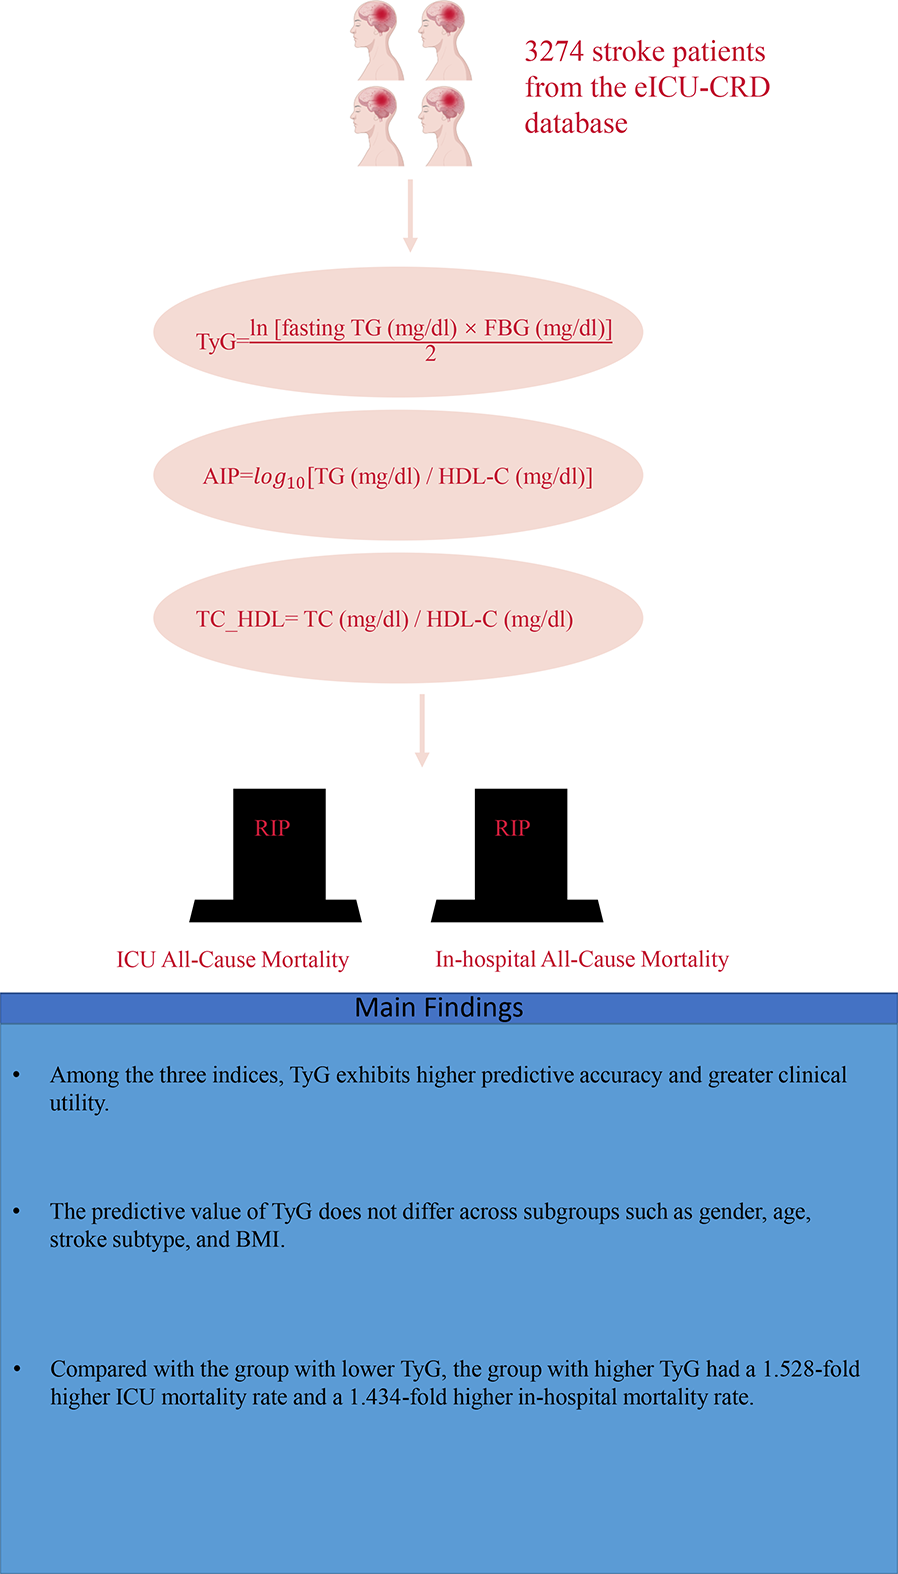
A total of 3247 critically ill stroke patients were included in this study. The median age of the included patients was 70.167 years (95% CI 69.693–70.641), with 1701 (52.4%) being male and 1709 (52.6%) having ischemic stroke. The in-hospital mortality and ICU mortality rates were 17.2% and 9.7%, respectively. The median TyG index of all participants was 8.787 (95% CI 8.767–8.806) (Table 1); the median AIP was 0.375 (95% CI 0.366–0.385) (Table 2); and the median TC_HDL ratio was 3.68 (95% CI 3.637–3.724) (Table 3).
Baseline characteristics
The baseline characteristics of critically ill stroke patients stratified by quartiles of TyG, AIP, and TC_HDL indices are presented in Tables 1, 2, 3. Enrolled individuals were divided into four groups based on admission levels of TyG, AIP, and TC_HDL. The median TyG indices for each quartile were 8.156 (95% CI 8.137–8.174), 8.581 (95% CI 8.576–8.587), 8.881 (95% CI 8.874–8.888), and 9.532 (95% CI 9.501–9.564), respectively. The median AIP values for each quartile were 0.081 (95% CI 0.071–0.092), 0.314 (95% CI 0.313–0.314), 0.397 (95% CI 0.395–0.400), and 0.720 (95% CI 0.706–0.734), respectively. The median TC_HDL ratios for each quartile were 2.524 (95% CI 2.496–2.552), 3.349 (95% CI 3.346–3.352), 3.611 (95% CI 3.603–3.619), and 5.318 (95% CI 5.217–5.418), respectively.
Compared with patients in the lower TyG quartiles, those in the highest TyG quartile generally exhibited higher BMI, higher admission weight, a higher prevalence of diabetes and prior stroke, lower HDL-C, higher LDL-C, shorter APTT, higher fasting glucose, higher triglycerides and total cholesterol, as well as higher ICU and in-hospital mortality rates. Similarly, patients in the highest AIP quartile, relative to those in lower AIP quartiles, had higher BMI, higher admission weight, longer ICU length of stay, higher APS and APACHE scores, a higher history of coronary heart disease, lower HDL-C, higher LDL-C, longer PT, higher INR, higher fasting glucose, higher triglycerides and total cholesterol, and higher ICU and in-hospital mortality rates. For the TC_HDL ratio, patients in the highest quartile, compared with those in lower quartiles, showed higher BMI, higher admission weight, longer ICU length of stay, higher APACHE scores, a higher prevalence of dementia and hematological malignancy, lower HDL-C, higher LDL-C, longer PT, higher INR, higher platelet count, higher fasting glucose, higher triglycerides and total cholesterol, and higher ICU and in-hospital mortality rates.
Differences in baseline characteristics between in-hospital survivors and non-survivors are shown in Table 4. Non-survivors were more likely to be female, older, with lower BMI, higher APS and APACHE scores, and higher levels of fasting glucose, total cholesterol, and triglycerides. The TyG index (8.96 vs. 8.75, *P* < 0.001), AIP (0.44 vs. 0.36, *P* < 0.001), and TC_HDL ratio (3.94 vs. 3.63, *P* < 0.001) were significantly higher in non-survivors than in survivors.
Primary outcomes
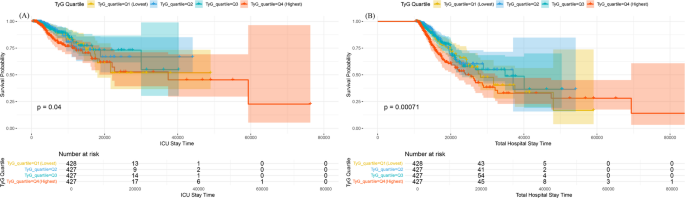
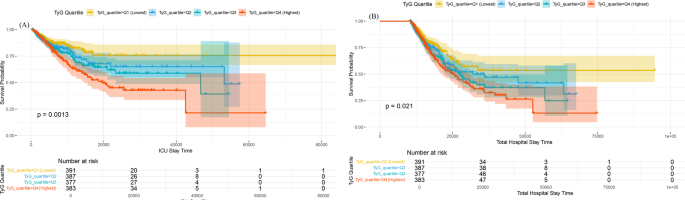
Kaplan–Meier survival curves were used to analyze the incidence of primary outcomes across groups. As shown in Fig. 2 (stratified by TyG quartiles), patients with higher TyG indices had an increased risk of in-hospital and ICU mortality. For AIP quartiles (Fig. 3), higher AIP indices were associated with a higher risk of in-hospital mortality, but no significant difference in ICU mortality was observed. For TC_HDL quartiles (Fig. 4), higher TC_HDL ratios were linked to a trend toward increased ICU and in-hospital mortality, though the difference was not statistically significant.
Kaplan–Meier survival analysis curves for all-cause mortality according to TyG grouping. The Kaplan–Meier curves show the cumulative probability of all-cause mortality during ICU stay (a) and in-hospital stay (b) across different groups
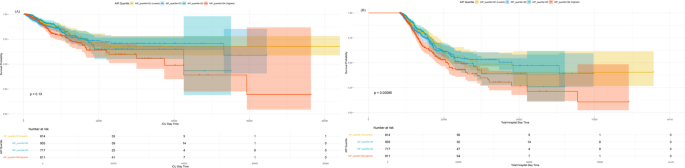
Kaplan–Meier survival analysis curves for all-cause mortality according to AIP grouping. The Kaplan–Meier curves show the cumulative probability of all-cause mortality during ICU stay (a) and in-hospital stay (b) across different groups
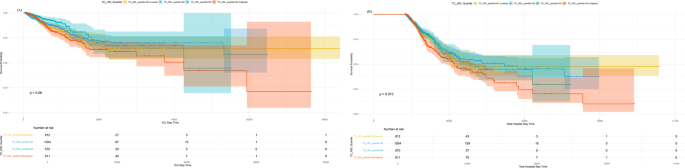
Kaplan–Meier survival analysis curves for all-cause mortality according to TC_HDL grouping. The Kaplan–Meier curves show the cumulative probability of all-cause mortality during ICU stay (a) and in-hospital stay (b) across different groups
Cox proportional hazards analyses were performed to assess the associations between TyG, AIP, TC_HDL, and in-hospital mortality. For TyG: when analyzed as a continuous variable, it was an important risk factor in the unadjusted model [HR 1.53 (95% CI 1.349–1.736), *P* < 0.001], partially adjusted model [HR 1.637 (95% CI 1.436–1.865), *P* < 0.001], and fully adjusted model [HR 1.643 (95% CI 1.370–1.970), *P* < 0.001]. When analyzed as an ordinal variable (quartiles), compared with the lowest quartile (Q1), patients in higher TyG quartiles had a significantly elevated risk of in-hospital mortality across all models: unadjusted [HR 1.389 (95% CI 1.103–1.750), *P* = 0.005], partially adjusted [HR 1.511 (95% CI 1.193–1.913), *P* = 0.001], and fully adjusted [HR 1.434 (95% CI 1.040–1.619), *P* = 0.013], with a trend of increasing risk across quartiles. Similar results were observed for the association between TyG and ICU mortality in multivariate Cox analyses (Table 5).
For AIP: when treated as a continuous variable, it was a significant risk factor in the unadjusted model [HR 2.198 (95% CI 1.653–2.923), *P* < 0.001], partially adjusted model [HR 2.430 (95% CI 1.811–3.261), *P* < 0.001], and fully adjusted model [HR 3.944 (95% CI 2.258–6.890), *P* < 0.001]. When analyzed as an ordinal variable, compared with Q1, patients in higher AIP quartiles had a significantly higher risk of in-hospital mortality across models: unadjusted [HR 1.507 (95% CI 1.191–1.907), *P* = 0.001], partially adjusted [HR 1.629 (95% CI 1.279–2.074), *P* < 0.001], and fully adjusted [HR 1.631 (95% CI 1.156–2.301), *P* = 0.005], with a trend of increasing risk across quartiles. Similar results were observed for the association between AIP and ICU mortality (Table 6).
For the TC_HDL ratio: when treated as a continuous variable, it was a significant risk factor in the unadjusted model [HR 1.121 (95% CI 1.064–1.182), *P* < 0.001] and partially adjusted model [HR 1.126 (95% CI 1.066–1.190), *P* < 0.001], but the association was not statistically significant in the fully adjusted model [HR 1.066 (95% CI 0.921–1.234), *P* = 0.39]. When analyzed as an ordinal variable, no consistent significant association was observed between higher TC_HDL quartiles and in-hospital mortality across models: unadjusted [HR 1.253 (95% CI 0.988–1.588), *P* = 0.063], partially adjusted [HR 1.305 (95% CI 1.022–1.666), *P* = 0.033], and fully adjusted [HR 0.834 (95% CI 0.545–1.278), *P* = 0.405]. Similar results were observed for the association between the TC_HDL ratio and ICU mortality (Table 7). To validate that TyG has higher predictive accuracy than the other two indices, we generated receiver operating characteristic (ROC) curves (Supplementary Figure 1), which showed that TyG exhibited higher predictive accuracy for both ICU and in-hospital ACM.
Additionally, restricted cubic spline regression models revealed that the risks of in-hospital death and ICU mortality increased nonlinearly with the TyG index (P for non-linearity < 0.001 for both) (Fig. 5) and the AIP index (P for non-linearity < 0.001 for both) (Fig. 6). In contrast to TyG and AIP, ICU mortality increased nonlinearly with the TC_HDL ratio (P for non-linearity = 0.029), while the risk of in-hospital death increased linearly with the TC_HDL ratio (P for non-linearity = 0.067) (Fig. 7). Furthermore, TyG and AIP exhibited distinct threshold effects.
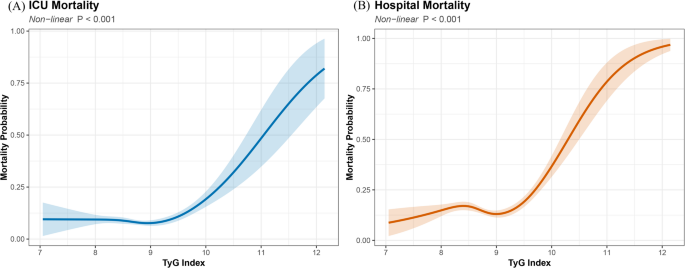
Restricted cubic spline curves for hazard ratios of the TyG index. The thick central line represents the estimated adjusted hazard ratio, and the shaded area represents the 95% confidence interval. a Restricted cubic spline curve for ICU mortality. b Restricted cubic spline curve for in-hospital mortality
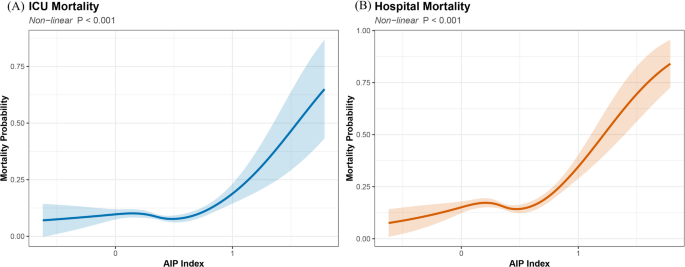
Restricted cubic spline curves for hazard ratios of the AIP index. The thick central line represents the estimated adjusted hazard ratio, and the shaded area represents the 95% confidence interval. a Restricted cubic spline curve for ICU mortality. b Restricted cubic spline curve for in-hospital mortality

Restricted cubic spline curves for hazard ratios of the TC_HDL index. The thick central line represents the estimated adjusted hazard ratio, and the shaded area represents the 95% confidence interval. a Restricted cubic spline curve for ICU mortality. b Restricted cubic spline curve for in-hospital mortality
Subgroup analysis
The risk stratification value of the TyG index for primary endpoints was further analyzed across multiple subgroups of enrolled patients, including gender, age, stroke type, BMI, history of coronary heart disease, hypertension, atrial fibrillation, diabetes, and prior stroke. The TyG index was significantly associated with higher in-hospital mortality in the following subgroups of critically ill stroke patients: females [HR 1.61 (95% CI 1.36–1.91)], age < 60 years [HR 2.06 (95% CI 1.61–2.63)], ischemic stroke [HR 1.76 (95% CI 1.49–2.08)], BMI ≥ 30 [HR 1.82 (95% CI 1.49–2.21)], no history of coronary heart disease [HR 1.54 (95% CI 1.34–1.76)], history of hypertension [HR 1.58 (95% CI 1.37–1.82)], no atrial fibrillation [HR 1.60 (95% CI 1.39–1.83)], and history of diabetes [HR 1.56 (95% CI 1.10–2.22)] (Fig. 8).
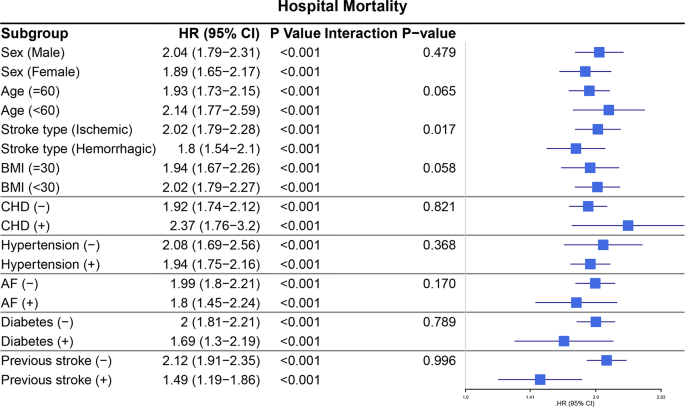
Forest plots of hazard ratios for the hospital mortality in different subgroup. HR: hazard ratio; CI: confidence interval; CHD: coronary heart disease; AF: atrial fibrillation; BMI: body mass index
Similarly, in the stratified analysis of ICU mortality, the TyG index was significantly associated with higher ICU mortality in the following subgroups: females [HR 1.67 (95% CI 1.32–2.12)], age < 60 years [HR 2.07 (95% CI 1.55–2.78)], ischemic stroke [HR 1.79 (95% CI 1.42–2.27)], BMI ≥ 30 [HR 1.75 (95% CI 1.35–2.27)], no history of coronary heart disease [HR 1.56 (95% CI 1.31–1.86)], history of hypertension [HR 1.64 (95% CI 1.37–1.98)], no history of atrial fibrillation [HR 1.60 (95% CI 1.32–1.92)], history of diabetes [HR 1.78 (95% CI 1.39–2.64)], and no history of prior stroke [HR 1.52 (95% CI 1.25–1.85)] (Fig. 9).
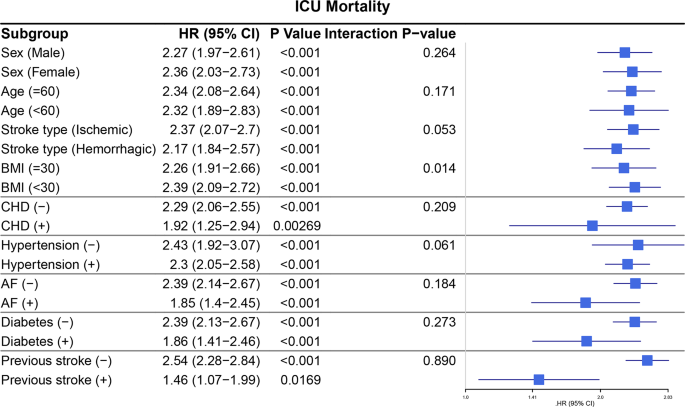
Forest plots of hazard ratios for the ICU mortality in different subgroup. HR: hazard ratio; CI: confidence interval; CHD: coronary heart disease; AF: atrial fibrillation; BMI: body mass index
Additionally, Kaplan–Meier curves demonstrated that individuals with an elevated TyG index had higher ICU and in-hospital mortality, regardless of whether they had ischemic stroke (Fig. 10) or hemorrhagic stroke (Fig. 11), which is consistent with previous literature.
Kaplan–Meier survival analysis curves for all-cause mortality in patients with ischemic stroke stratified by TyG values. The Kaplan–Meier curves show the cumulative probability of all-cause mortality during intensive care unit (ICU) stay (a) and in-hospital stay (b) across different groups
Kaplan–Meier survival analysis curves for all-cause mortality in patients with hemorrhagic stroke stratified by TyG values. The Kaplan–Meier curves show the cumulative probability of all-cause mortality during intensive care unit (ICU) stay (a) and in-hospital stay (b) across different groups