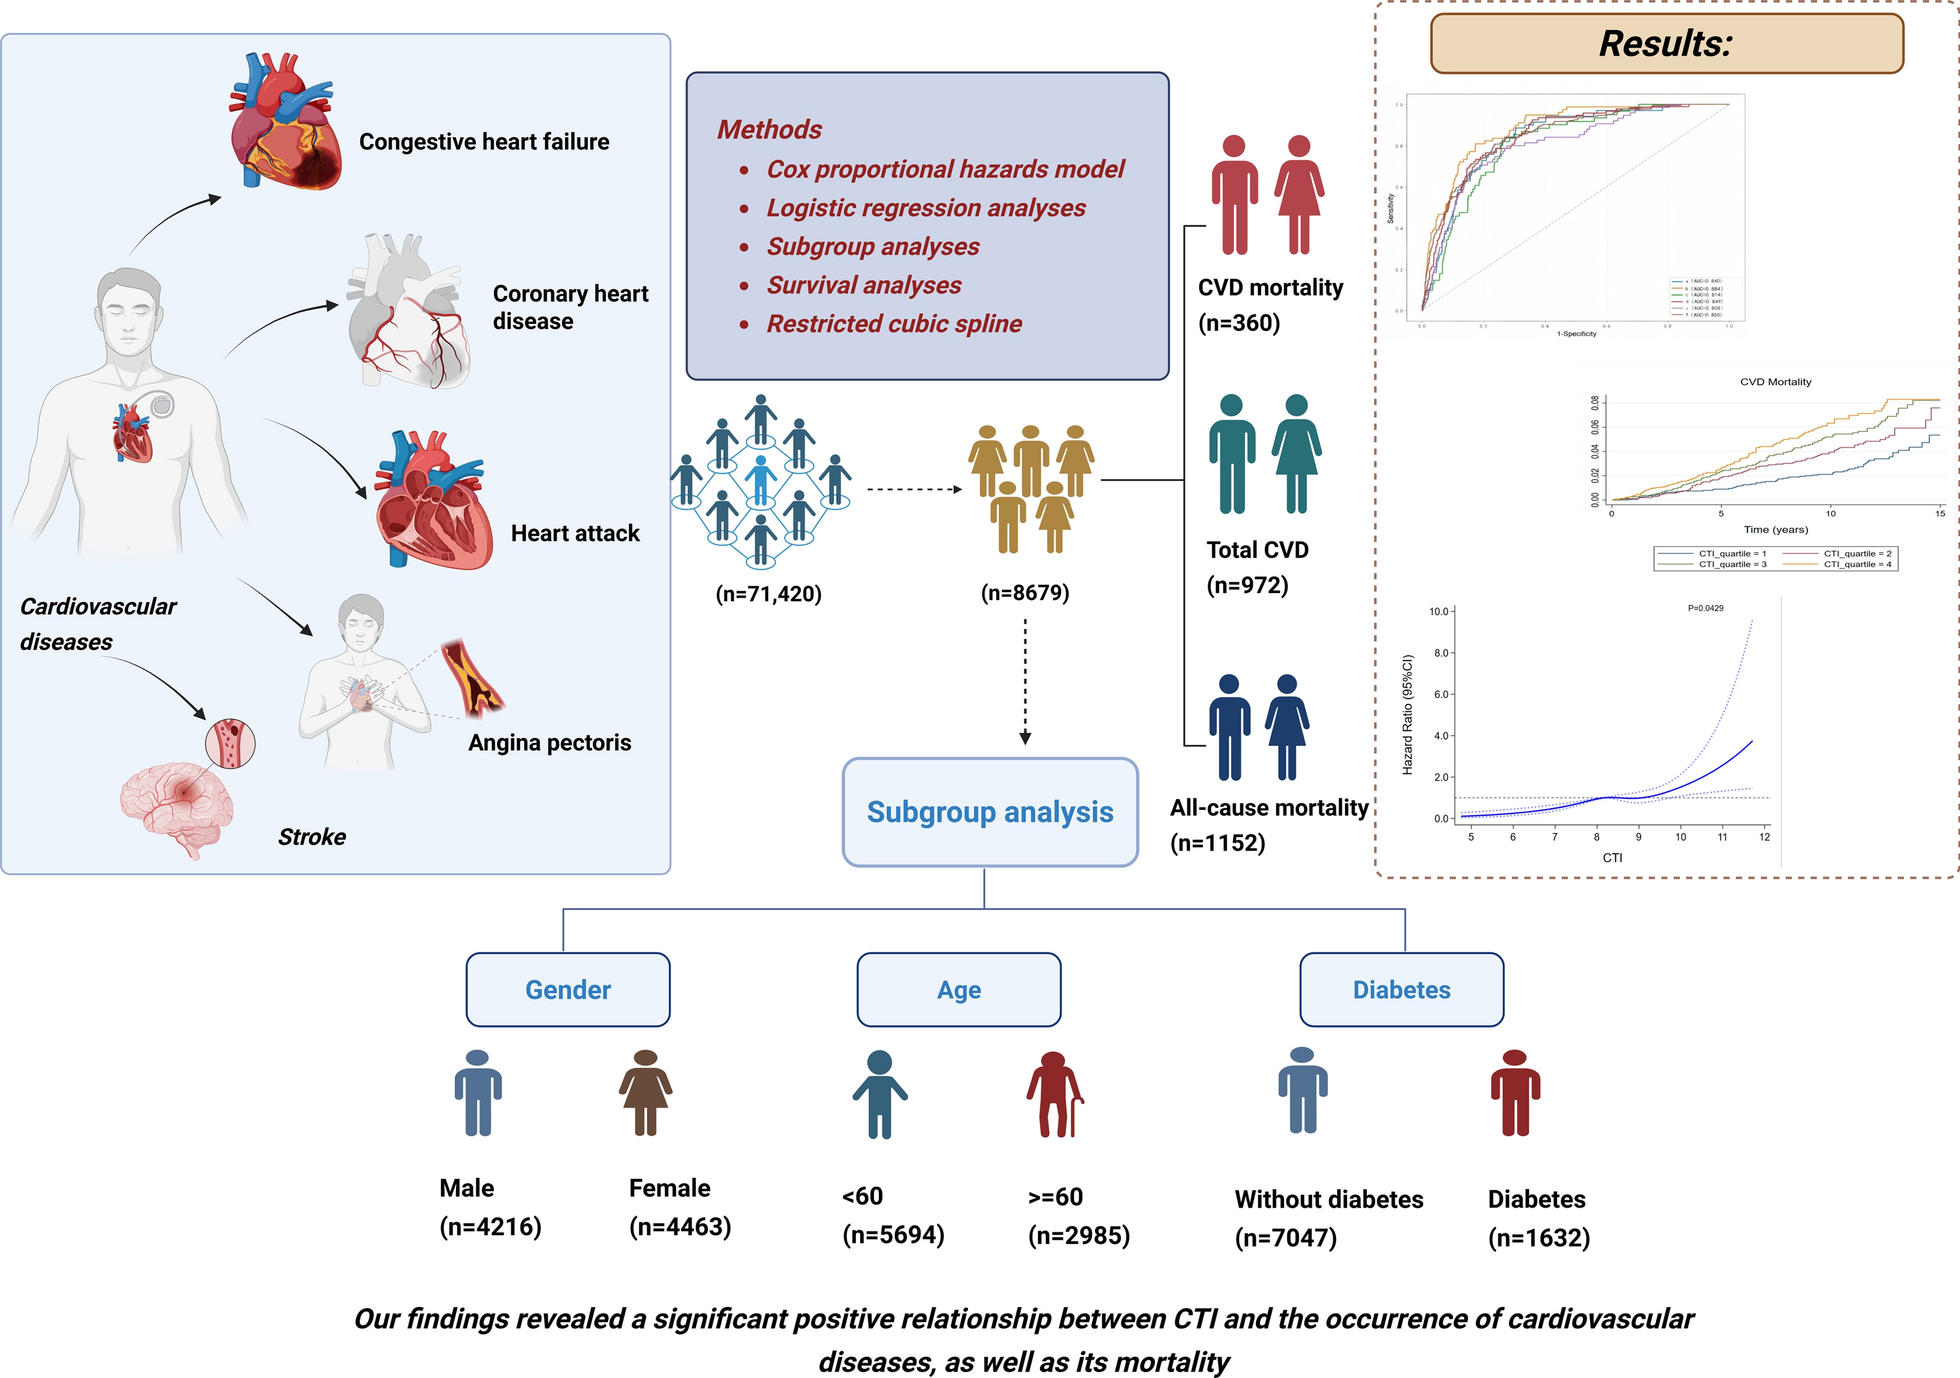
Baseline characteristics of participants across CTI quartiles.
Table 1 presents participant characteristics stratified by CTI quartiles. Individuals in upper CTI quartiles exhibited distinct demographic and clinical profiles: they were typically older, predominantly male, less educated, and more frequently current smokers. These participants also demonstrated significantly higher prevalence rates of hypertension and diabetes mellitus compared to lower quartile groups. Furthermore, elevated BMI values, LDL cholesterol concentrations, and HbA1c levels were consistently observed in higher CTI.
Relationship between CTI and specific CVD conditions and Mortality outcomes
During a follow-up period, 1,152 (13.27%) of the 8,679 participants died, with 360 (7.26%) deaths attributed to cardiovascular disease. Figure 2 demonstrates the association of CTI with CVD mortality, total CVD, all-cause mortality, congestive heart failure, coronary heart disease, angina pectoris, heart attack, and stroke from model 3. Table 2 provide detailed information on all associations. Model 1 revealed no significant relationship between CTI elevation and CVD mortality risk. However, after covariate adjustment in Model 2, each unit increase in CTI corresponded to a 63% greater mortality hazard (HR = 1.63, 95% CI:1.18–2.24, p < 0.001). After adjustment for covariates, the results showed CTI was positively associated with CVD mortality. A clear dose–response relationship emerged between CTI elevation and CVD mortality risk. Relative to Q1, progressively higher quartiles demonstrated increasing hazard ratios: Q2 (HR 1.45, 95% CI:1.16–2.23), Q3 (HR 1.92, 1.52–2.81), and Q4 (HR 2.28, 1.69–3.24).
Forest plot of the CTI association with CVD mortality, total CVD, and all-cause mortality using logistic regression model and Cox proportional hazards model
Cox proportional hazards regression analysis revealed a consistent positive association between CTI elevation and all-cause mortality. The unadjusted model (Model 1) demonstrated a 44% increased mortality hazard per CTI unit increase (HR = 1.44, 95% CI:1.17–1.78), with this relationship strengthening to 50% higher risk after covariate adjustment in Model 2 (HR = 1.50, 95% CI:1.26–1.80, p < 0.001). After adjust the potential confounding variables (Model 3), compared to Q1, all-cause mortality risk increased with higher CTI levels, with HRs of 1.62 (95% CI 1.34–1.92), 1.87 (95% CI 1.49–2.23), 2.14 (95% CI 1.76–2.55) for Q2, Q3, and Q4.
After adjustment for covariates, the results showed CTI was positively associated with total CVD (OR 2.85, 95% CI 2.32–3.52). In addition, the results showed CTI was positively associated with congestive heart failure, coronary heart disease, angina pectoris, heart attack, and stroke. Logistic regression analysis demonstrated a substantial increase in congestive heart failure in the higher CTI group, from Q2 (OR 1.87, 95% CI (1.20–2.79) to Q3 (OR 1.77, 95% CI (1.16–2.69) and Q4 (OR 3.66, 95% CI 2.46–5.35), compared with lower CTI group. For heart attack, CTI had a high association from model 3(OR 2.59, 95% CI 1.89–3.52). For angina pectoris, CTI had a high association from model 3 (OR 2.85, 95% CI 1.89–4.22). For coronary heart disease, CTI had a high association from model 3 (OR 2.82, 95% CI 1.95–3.97). For stroke, CTI had a high association from model 3 (OR 2.86, 95% CI 2.00–3.85).
RCS analysis and Kaplain-Meier survival curves investigating the relationship between CTI and specific CVD conditions and Mortality outcomes
Figure 3 presents restricted cubic spline (RCS) analyses examining CTI’s associations with multiple cardiovascular outcomes: CVD mortality, total CVD prevalence, all-cause mortality, congestive heart failure, heart attack, angina pectoris, stroke, and coronary heart disease. The RCS modeling demonstrated a significant positive linear relationship between CTI and both CVD-specific and all-cause mortality in the general population (Fig. 3). After full covariate adjustment (Model 3), CTI exhibited significant linear associations with total CVD as well as specific manifestations including congestive heart failure, heart attack, angina pectoris, stroke, and coronary heart disease.
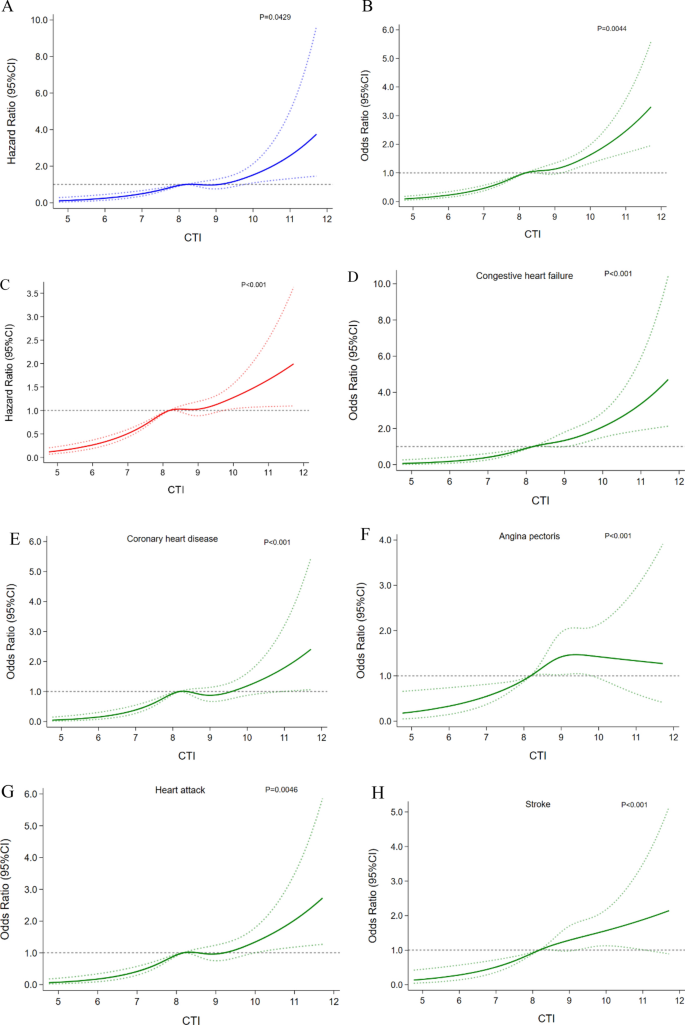
Associations between CTI with CVD mortality, total CVD, congestive heart failure, coronary heart disease, angina pectoris, heart attack, and stroke were evaluated by RCS after adjustment for the covariables. The solid lines correspond to the central estimates, and the shaded regions indicate the 95% confidence intervals. A CVD mortality; B Total CVD; C All-cause mortality; D Congestive heart failure; E Coronary heart disease; F Angina pectoris; G Heart attack; H Stroke
Figure 4 displays Kaplan–Meier survival curves stratified by CTI quartiles. Significant differences in CVD mortality risk emerged across the CTI quartile groups (log-rank p < 0.001), demonstrating the index’s prognostic value. Furthermore, the association between the CTI index and all-cause mortality was also significant. The test for trend reached statistical significance. Kaplan–Meier analysis demonstrated progressively higher cumulative incidence rates for both cardiovascular and all-cause mortality across ascending CTI quartiles (Q1-Q4), with interquartile differences reaching statistical significance (P < 0.001).
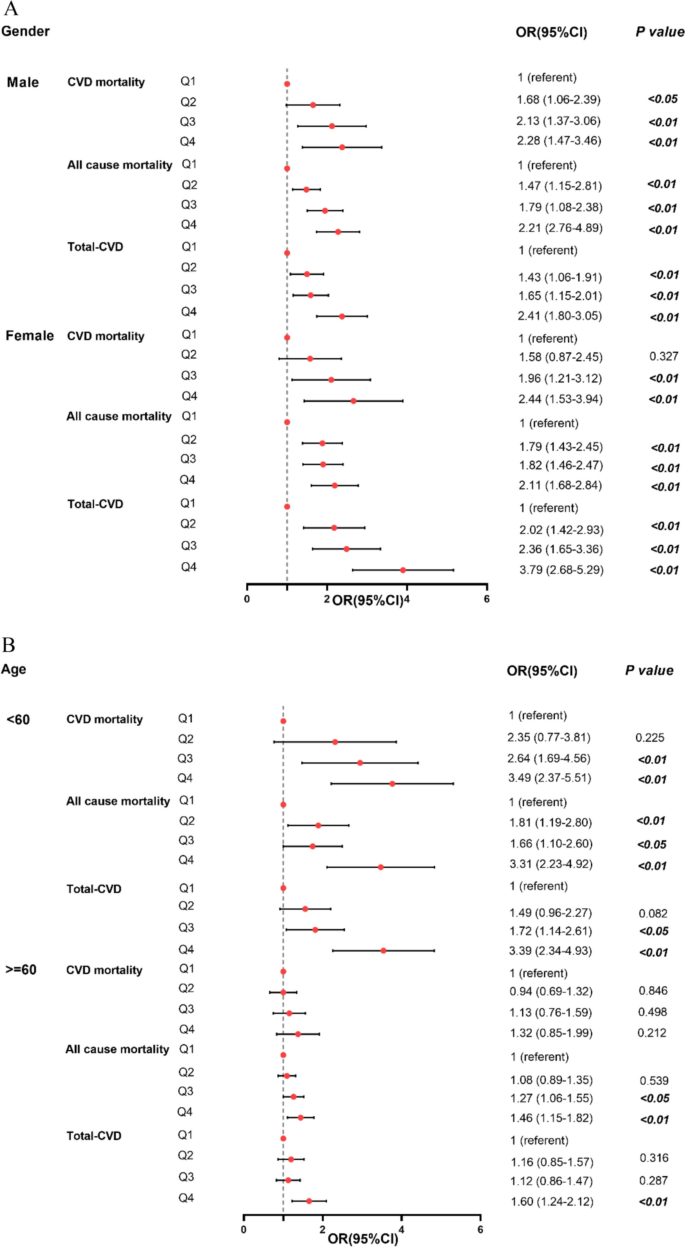
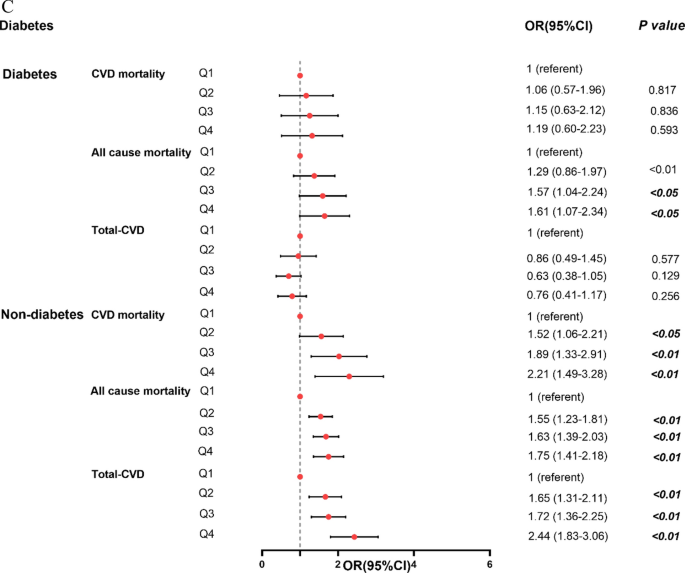
Forest plot of the CTI association with CVD mortality, total CVD, and all-cause mortality using logistic regression model and Cox proportional hazards model in subgroups. A Gender; B Age; C Glycemic status
Stratification of CTI in relation to specific CVD conditions and Mortality outcomes
After controlling for variables, segmented analyses according to age, gender, glycemic status, identified that significant correlation between CTI with total CVD, CVD mortality, and all-cause mortality. Figure 5 demonstrates these associations according to age, gender, glycemic status. All association analyses are detailed in Tables 3, 4, 5. Following multivariable adjustment, the results showed that CTI were positively associated with CVD mortality, total CVD, and all-cause mortality.
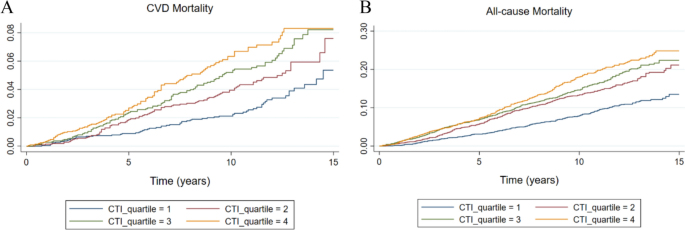
The Kaplan–Meier curves analysis depicts the cumulative incidence of CVD mortality and all-cause mortality across the CTI index quartiles. A All-cause mortality; B CVD mortality
As shown in Table 3, after controlling for variables, there was a significant association between CTI and CVD mortality in male individuals (HR 2.28, 95% CI 1.47–3.46) and female (HR 2.44, 95% CI 1.53–3.94). Our results also indicated that male individuals in the Q4 group with the highest CTI had a 2.41 times higher odds ratio for total CVD (95% CI: 1.80–3.05) compared to those in the Q1 group with the lowest CTI. Moreover, the ORs estimates show that the risks of total CVD in female with CTI in high concentrations groups were higher than the low group (OR, 3.79 [95% CI, 2.68–5.29]).
As shown in Table 4, in elderly participants, this research uncovered that individual categorized in the highest CTI (Q4) group exhibited a 1.60 odds ratio for total CVD (95% CI: 1.24–2.12) when compared to those in the lowest CTI (Q1) group. Our results also indicated that CTI had no association with CVD mortality in elderly participants. However, among younger individuals, CTI showed stronger CVD mortality prediction (HR 3.49, 2.37–5.51).
As shown in Table 5, elevated CTI levels were significantly associated with increased all-cause mortality among diabetic participants (HR = 1.61, 95% CI:1.07–2.34). For CVD mortality and total-CVD, CTI had no association in diabetes group. However, CTI had the highest association with CVD mortality (HR 2.21, 95% CI 1.49–3.28), total CVD (OR 2.44, 95% CI 1.83–3.06), and all-cause mortality (HR 1.75, 95% CI 1.41–2.18) in participants without DM.
As shown in Tables S1 and S2, in male participants, there were significant associations between CTI and congestive heart failure (OR 2.41, 95% CI 1.47–3.95), coronary heart disease (OR 1.97, 95% CI 1.30–2.97), angina pectoris (OR 2.02, 95% CI 1.39–4.02), heart attack (OR 2.29, 95% CI 1.53–3.42), and stroke (OR 2.24, 95% CI 1.39–3.61). As for female participants, similar associations were observed. As shown in Tables S3 and S4, in young (< 60 years old) participants, there were significant associations between CTI and coronary heart disease (OR 2.90, 95% CI 1.26–6.64), angina pectoris (OR 5.48, 95% CI 2.37–8.42), heart attack (OR 3.48, 95% CI 1.88–6.45), and stroke (OR 2.31, 95% CI 1.23–4.32). However, among older adults, CTI levels showed no statistically significant association with either angina pectoris or heart attack (all P > 0.05).
In addition, as shown in Tables S5 and S6, there were significant associations between CTI and congestive heart failure (OR 3.32, 95% CI 1.88–5.87), coronary heart disease (OR 2.37, 95% CI 1.50–3.75), angina pectoris (OR 2.82, 95% CI 1.54–5.17), heart attack (OR 2.17, 95% CI 1.44–3.26), and stroke (OR 2.06, 95% CI 1.31–3.24) in participants without diabetes. However, as for participants with DM, the risk of angina pectoris was significantly lower in Q4 (OR 0.53, 95% CI 0.29–0.98) compared to Q1, but insignificantly in Q2, and Q3. Furthermore, the risk of congestive heart failure was significantly lower in Q3 (OR 0.56, 95% CI 0.29–0.95) compared to Q1 in participants with DM.
The predictive value of CTI for specific CVD conditions and Mortality outcomes
In the ROC curve analysis, the predictive value of CTI for total-CVD, congestive heart failure, coronary heart disease, angina pectoris, heart attack, and stroke were shown in Fig. 6. The AUC of CTI for predicting coronary heart disease risk was 0.884 (95%CI = 0.835–0.933), followed by total-CVD (AUC = 0.850, 95%CI = 0.818–0.882), heart attack (AUC = 0.849, 95%CI = 0.799–0.898), congestive heart failure (AUC = 0.840, 95%CI = 0.782–0.899), angina pectoris (AUC = 0.814, 95%CI = 0.748–0.880) and stroke (AUC = 0.808, 95%CI = 0.747–0.868). The optimal CTI cutoff value, AUC values and DeLong’s test for CVDs were shown in Table S10.
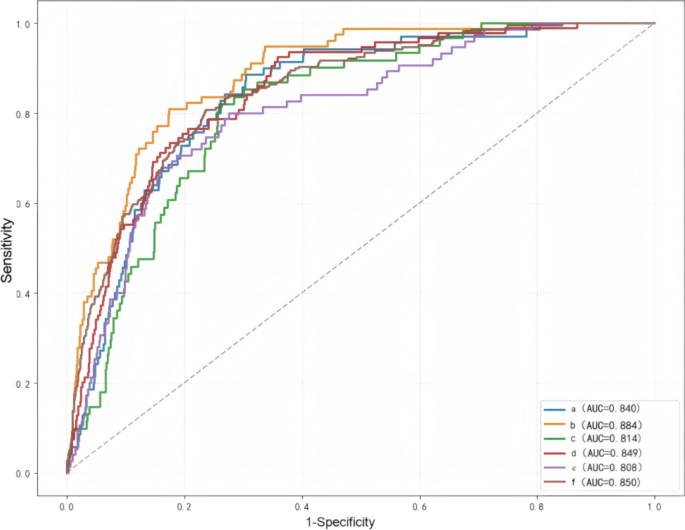
Comparison of the predictive value of CTI index for total CVD, congestive heart failure, coronary heart disease, angina pectoris, heart attack, and stroke. a congestive heart failure; b coronary heart disease; c angina pectoris; d heart attack; e stroke; f Total CVD