Population
Based on the availability of comprehensive gastrointestinal health-related data, we specifically analyzed participants from three consecutive NHANES cycles (2005–2006, 2007–2008, and 2009–2010). The study protocol was rigorously conducted in accordance with ethical standards, with all participants providing written informed consent. For minors (≤ 18y), parental or guardian consent was obtained prior to participation. The NHANES study protocol was reviewed and approved by the NCHS Research Ethics Review Board. Detailed information regarding data access and usage restrictions can be found on the official NCHS website: https://www.cdc.gov/nchs/data_access/restrictions.htm.
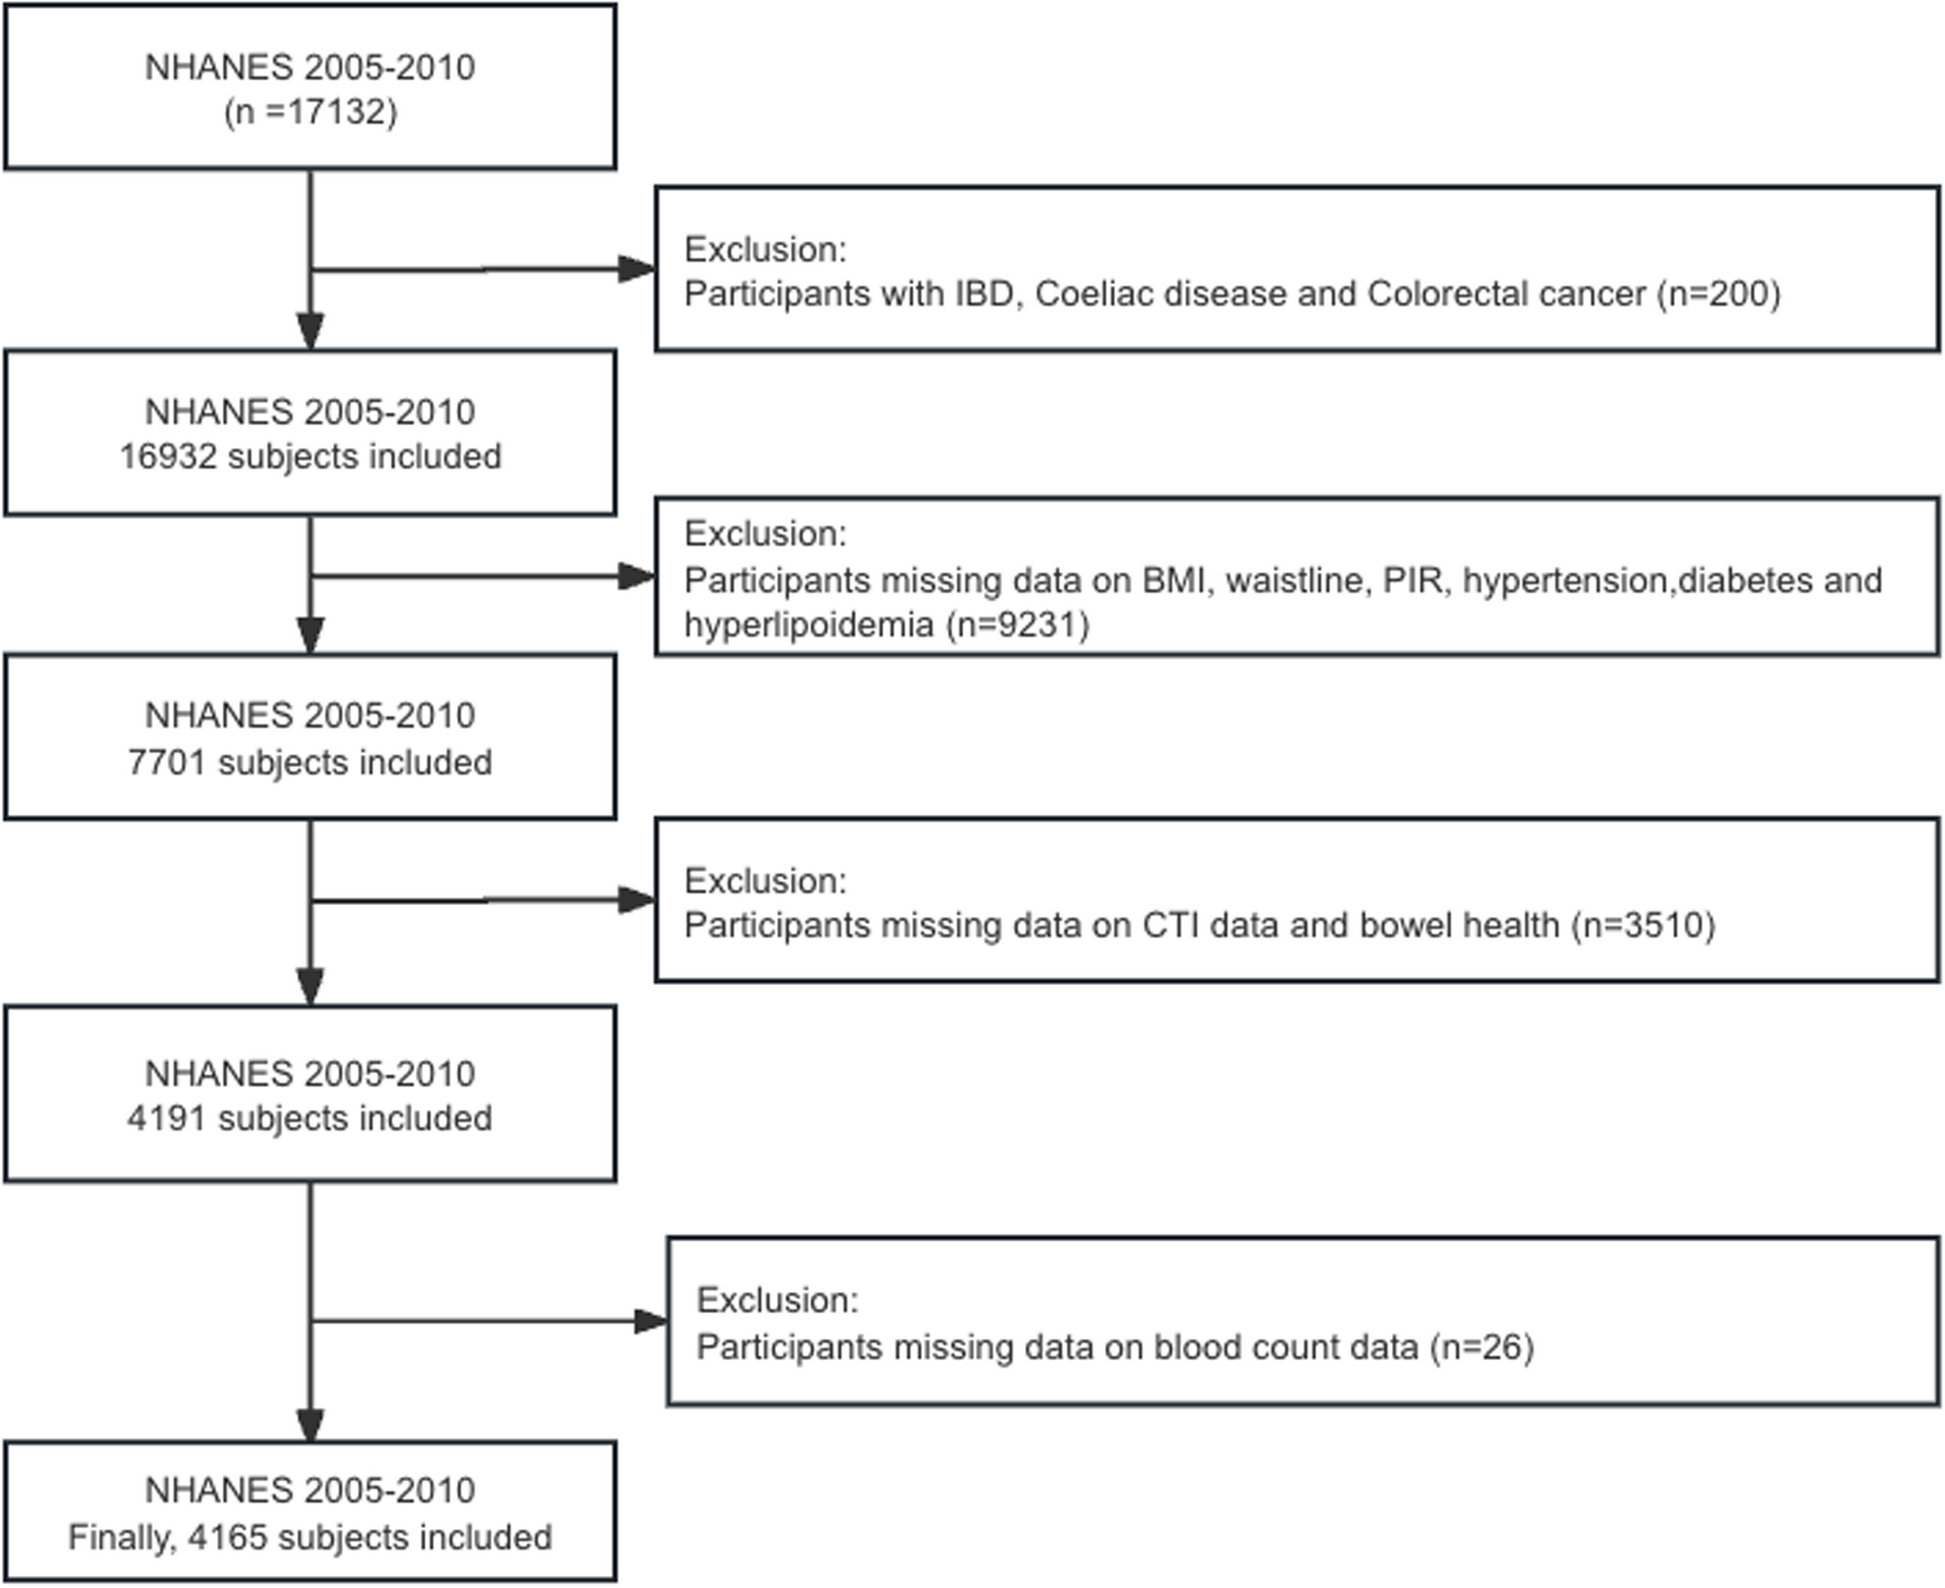
These participants were removed through a rigorous exclusion process as follow: (1) participants with self-reported diagnoses of inflammatory bowel disease (IBD), celiac disease, or colon cancer (n = 200); (2) individuals with incomplete CTI-related laboratory measurements, including C-reactive protein (CRP), triglyceride levels, or fasting glucose values (n = 3,050); and (3) participants lacking essential covariate data, specifically body mass index (BMI) and waist circumference (n = 839), poverty-to-income ratio (PIR) information (n = 1,309), or medical history data regarding hypertension, diabetes, and hyperlipidemia (n = 7,032). Furthermore, participants with missing gastrointestinal health questionnaire responses (n = 460) and incomplete complete blood count (CBC) data (n = 26) were excluded.
Following this comprehensive exclusion process, the final analytical cohort comprised 4,165 participants, as detailed in Fig. 1. This sample size calculation ensured adequate statistical power for detecting clinically meaningful associations while maintaining the representativeness of the study population. The STROBE guidelines were applied to evaluate risk of bias and overall study quality [18].
Follow chart showing the selection process of the study population
Definition of bowel dysfunction
Within the NHANES framework spanning 2005–2010, stool consistency metrics were systematically acquired using the clinically validated Bristol Stool Form Scale (BSFS) through its gut health questionnaire module [19, 20]. The BSFS was utilized in accordance with its original non-commercial, academic application guidelines. No specific license was required for its use in this study, as it is openly accessible for research purposes. Interviewers presented participants with cards depicting seven different types of stools, asking them to identify the type that most closely resembled their usual bowel movements. This systematic method offered a consistent framework for evaluating stool consistency in the study. Participants who reported a defecation frequency of three or fewer times per week or stools categorized as BSFS Type 1 (separate hard lumps, resembling nuts) or Type 2 (sausage-shaped but lumpy) were identified as experiencing constipation. On the other hand, individuals with a bowel movement frequency of 21 or more times per week or stools classified as BSFS Type 6 (fluffy pieces with ragged edges, a mushy stool) or Type 7 (watery, containing no solid pieces) were diagnosed with diarrhea. Participants with bowel movements occurring 4 to 20 times per week, or with stool types of BSFS Type 3, Type 4, or Type 5 (resembling a sausage but with cracks on the surface, smooth and soft, or soft blobs with clear-cut edges) were categorized as normal [21].
Definitions of CTI
The CTI, a novel composite biomarker developed by Ruan et al. [14], was calculated using the following validated formula: 0.412 × Ln(CRP) + TyG, where TyG represents the triglyceride-glucose index calculated as Ln[fasting triglycerides (TG, mg/dL) × fasting plasma glucose (FPG, mg/dL)/2]. All biological samples were collected following a standardized 8-h fasting period and analyzed in laboratories certified by the National Center for Health Statistics (NCHS) using rigorous quality control protocols. Additional methodological details regarding sample collection, processing, and analysis were available on the official NHANES website. CTI values demonstrate a positive correlation with both systemic inflammation and insulin resistance (IR) severity, with higher CTI scores indicating more pronounced inflammatory activity and metabolic dysregulation.
Covariates
In the current study, covariates spanning demographic, socioeconomic, and lifestyle dimensions were systematically adjusted for. Demographic variables included: (1) age (continuous variable); (2) sex (male/female); (3) race/ethnicity categorized as Mexican American, Other Hispanic, Non-Hispanic White, Non-Hispanic Black, and Other/Multiracial; (4) educational attainment stratified into < high school, high school, and ≥ college; and (5) marital status classified as married, widowed, divorced/separated, and never married. Socioeconomic status was assessed using the poverty-income ratio (PIR), categorized as low income (PIR ≤ 1.3), middle income (1.3 < PIR < 3.5), and high income (PIR ≥ 3.5).Lifestyle factors incorporated: (1) smoking status (never smoker, former smoker, current smoker); (2) alcohol consumption (yes/no); and (3) physical activity level quantified using metabolic equivalent of task (MET)-minutes per week, accounting for both activity intensity and duration. Based on established guidelines, we defined active physical activity as ≥ 600 MET-minutes per week [22].
Based on predefined Directed Acyclic Graphs (DAGs), the minimal sufficient adjustment set was identified to control for confounding. Covariates included age, sex, race/ethnicity, education level, and income status (Fig. 2).
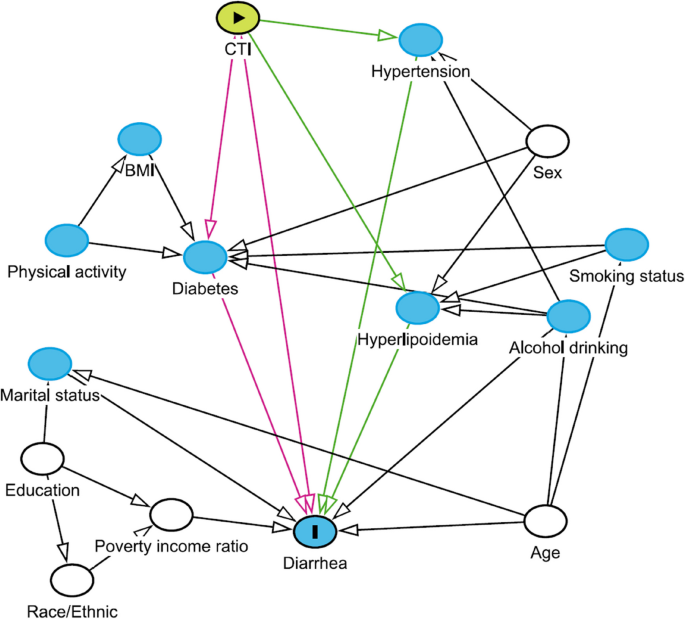
Directed Acyclic Graph (DAG)
For subgroup analyses, stratified approaches were implemented to enhance clinical relevance: (1) body mass index (BMI) was dichotomized into < 25 kg/m2 and ≥ 25 kg/m2 based on World Health Organization classification; and (2) race/ethnicity was grouped as Non-Hispanic White versus Other races (including Mexican American, Non-Hispanic Black, Other Hispanic, and Other/Multiracial) to account for potential majority-minority differences in health outcomes.
Statistical analysis
All continuous variables presented as means and standard errors (SE) or median interquartile ranges (IQR), while categorical variables as percentages. The Kruskal–Wallis test was employed for the analysis of all continuous variables and ordinal multiclass variables. For unordered multiclass variables, the Pearson’s Chi-squared test was used.
To investigate the association between the CTI and gastrointestinal dysfunction (constipation and diarrhea), generalized linear modeling frameworks with sequential covariate adjustment were employed: Model I was unadjusted, serving as the baseline analysis. Model II included adjustments for age, gender, and ethnicity to account for basic demographic factors. Model III, which is adjusted for covariates in Model II, as well as education level and income level. Subsequent analyses categorized stool type into constipation (BSFS types 1–2), diarrhea (BSFS types 6–7), and normal types. Bowel movement frequency was dichotomized at different cutoffs (< 7 vs. ≥ 7, < 14 vs. ≥ 14, and < 21 vs. ≥ 21 times per week).
To characterize the liner or non-liner relationship, restricted cubic spline (RCS) regression with 4 knots was implemented using the rms package in R, enabling flexible curve fitting without assuming linearity. Subgroup analyses were stratified by biological sex (male/female), age (< 60/≥ 60 years), race (Non-Hispanic White/Other), education attainment, marital status, PIR tertiles, smoking status, alcohol consumption, and physical activity level. To evaluate the potential modifying effects of pharmacological interventions, a stratified sensitivity analysis was conducted focusing on participants receiving specific medications: Statin users subgroup analysis and Metformin users subgroup analysis. Mediation analysis was also conducted to explore the underlying mechanisms involved. To validate the robustness of primary findings, we conducted receiver operating characteristic (ROC) curve analysis for CTI, TyG, and CRP to determine their optimal diagnostic cutoffs for gastrointestinal outcomes. Using these empirically derived thresholds, CTI and TyG were dichotomized into high- and low-level groups. Subsequent multivariable logistic regression analyses (adjusted for the minimal sufficient adjustment set) were performed, followed by comprehensive subgroup analyses stratified by covariates to assess result stability.
Data analysis was performed using R statistical software (version 4.4.2). Statistical significance was set at a two-tailed p-value < 0.05, and 95% confidence intervals were calculated with robust standard error estimation.