Study population
The CMEC is an ongoing prospective cohort study initiated in May 2018 across community populations in five provinces of Southwest China [24]. A total of 99,556 participants (n = 59,762 females) aged 30–79 years were recruited, given full consideration of ethnic characteristics, socioeconomic status, population size, and disease patterns. The first follow-up survey, conducted from August 2020 to July 2021, included approximately 10% of participants from the baseline survey. Data collection involved face-to-face interviews using electronic questionnaires, medical examinations, and clinical laboratory tests. All participants provided written informed consent, and the study received ethical approval from the Sichuan University Medical Ethical Review Board as well as local ethics committees at participating sites.
The UKB is a large-scale prospective study that recruited over 500,000 participants (n = 273,316 females) aged 37–73 from 22 assessment centers across the UK between 2006 and 2010 [25]. The first follow-up survey, conducted from 2012 to 2013, included a subset of 20,343 participants based at the Cheadle assessment center. At both surveys, comprehensive data were collected through touchscreen questionnaires, physical measurements, and biological samples. All participants provided electronic informed consent, and the study was approved by the National Information Governance Board for Health and Social Care and the National Health Service North West Multi-Centre Research Ethics Committee.
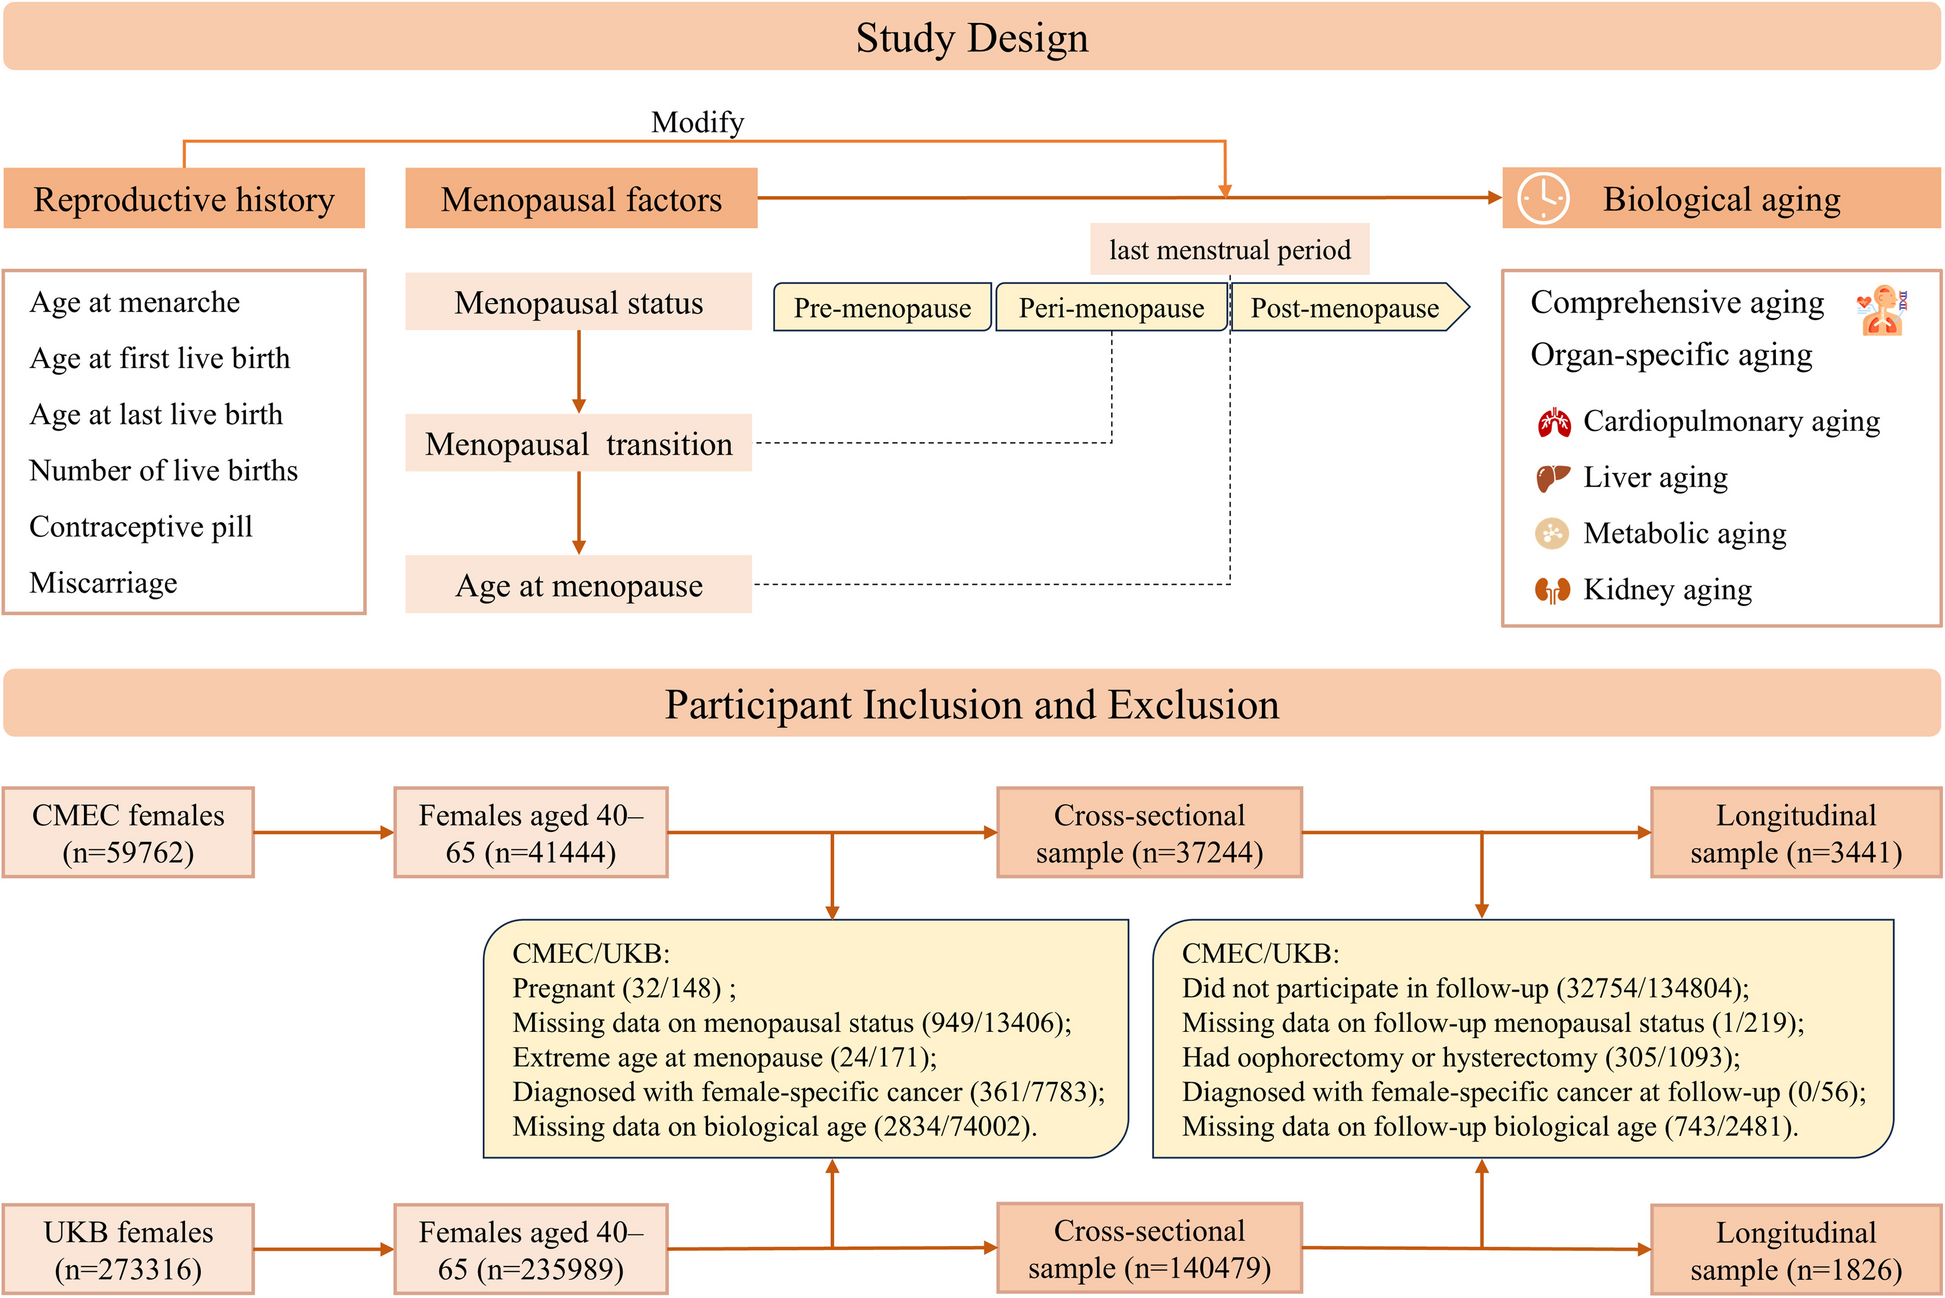
This study included female participants aged 40–65, with available data on menopausal status and biological aging at baseline. Participants were excluded if they were pregnant, reported an extreme age at menopause (< 30 or > 65 years), or had been diagnosed with breast, cervical, or ovarian cancer. The final analytic sample comprised 37,244 participants from the CMEC and 140,479 participants from the UKB (cross-sectional sample). For analyses examining menopausal transition, which required both baseline and follow-up data (longitudinal sample), we further excluded participants without follow-up information on menopausal status and biological aging, as well as those who had undergone oophorectomy or hysterectomy, resulting in 3441 participants from the CMEC and 1826 participants from the UKB (Fig. 1).
Flowchart of the study design
Assessment of menopausal factors and other reproductive history
Menopausal factors
In CMEC, participants were asked about their current menstrual status with the options: regular menstruation, irregular menstruation, peri-menopausal, and post-menopausal (cessation of menstruation for ≥ 12 months). Participants reporting post-menopausal status were further asked to provide their age at menopause. Information on surgical history, including unilateral or bilateral oophorectomy and hysterectomy, was also collected. In UKB, participants were asked, “Have you had your menopause (periods stopped)?” with options: yes, no, not sure—had a hysterectomy, not sure—other reason, and prefer not to answer. Data on age at menopause and any history of bilateral oophorectomy or hysterectomy were also obtained.
Using these data, menopausal status was classified into pre-menopause, peri-menopause (CMEC only), post-menopause, oophorectomy, and hysterectomy. In CMEC, pre-menopause was defined as regular or irregular menstruation; in UKB, it was defined as a “no” response to the menopause question. Participants with missing or uncertain menopausal status (e.g., “not sure—other reason” or “prefer not to answer”) were excluded from this study. For those who had experienced natural menopause, age at menopause was classified as < 40, 40–44, 45–49, 50–54, and ≥ 55 years [4, 16]. For analyses examining changes in menopausal status from baseline to follow-up, the CMEC menopausal categories were aligned with those in the UKB by reclassifying status as pre-menopause (including pre-menopause and peri-menopause) and post-menopause. This allowed us to define three transition groups: pre-menopause to pre-menopause (pre-pre), pre-menopause to post-menopause (menopausal transition), and post-menopause to post-menopause (post-post). Additionally, a more detailed classification was conducted for the CMEC, reconsidering peri-menopause as a distinct category, resulting in six transition groups: pre-pre, pre-peri, peri-peri, peri-post, pre-post, and post-post.
Other reproductive history
Other reproductive history factors included age at menarche, age at first live birth, age at last live birth, number of live births, history of miscarriage (including stillbirths, spontaneous miscarriages, and terminations), ever taken oral contraceptive pill, and ever used hormone-replacement therapy (HRT, UKB only).
Assessment of biological aging
In this study, we constructed comprehensive and organ-specific BAs using clinical biomarkers and anthropometric data, based on the Klemera and Doubal method (KDM). KDM is a widely used method for constructing composite biomarker BA and has been demonstrated good performance in predicting age-related health outcomes in both Chinese and UK populations [27,28,29].
Biomarker selection
First, candidate biomarkers were selected based on their role in the aging process, previous usage in related literature, and their missingness in the datasets. Next, we retained only biomarkers with a correlation coefficient of |r|> 0.1 with CA. To minimize redundancy, we excluded biomarkers that potentially reflected similar aspects of aging based on current knowledge and observed inter-correlations among biomarkers.
This process yielded 15 biomarkers for comprehensive BA in the CMEC, which included systolic blood pressure (SBP), waist-to-hip ratio (WHR), peak expiratory flow (PEF), low-density lipoprotein cholesterol (LDL-c), high-density lipoprotein cholesterol (HDL-c), glycated hemoglobin (HBA1C), triglyceride (TG), aspartate aminotransferase (AST), gamma-glutamyl transpeptidase (GGT), albumin (ALB), alkaline phosphatase (ALP), creatinine, urea, mean corpuscular volume (MCV), and platelet count (PLT). In the UKB, 18 biomarkers were selected, including SBP, WHR, body fat percentage (BFP), forced expiratory volume in 1 s (FEV1), MCV, ALP, AST, C-reactive protein, cystatin C, GGT, heel quantitative ultrasound index, HBA1C, insulin-like growth factor 1 (IGF-1), TG, urate, urea, ALB, and vitamin D.
These indicators were then categorized into four systems based on the organ or system function they represent: cardiopulmonary, metabolic, liver, and kidney systems. Cardiopulmonary BA included SBP and PEF/FEV1; metabolic BA included LDL-c, HDL-c, HBA1C, TG, and WHR for CMEC (and WHR, BFP, HBA1C, and TG for UKB); liver BA included AST, GGT, ALP, ALB, and IGF-1 (UKB only); the kidney BA included creatinine, urea, and cystatin C (UKB only).
Construction of comprehensive and organ-specific BA acceleration
BA was constructed by extracting information from the relationships between each biomarker and the aging process. Briefly, CA was regressed on m selected biomarkers in a reference population, allowing for the calculation of estimated BA as follows:
$${BA}_{EC}=frac{{sum }_{j=1}^{m}({x}_{j}-{q}_{j})frac{{k}_{j}}{{s}_{j}^{2}}+frac{CA}{{s}_{BA}^{2}}}{{sum }_{j=1}^{m}{left(frac{{k}_{j}}{{s}_{j}}right)}^{2}+frac{1}{{s}_{BA}^{2}}}$$
Here, ({BA}_{EC}) represents the estimated biological age. ({x}_{j}) is the measured value of the jth biomarker, and ({k}_{j}), ({q}_{j}), and ({s}_{j}) correspond to the slope, intercept, and root mean squared error from the jth biomarker’s regression on CA, respectively. ({s}_{BA}^{2}) represents the estimated variance in CA explained by the selected biomarker set. Since BA alone cannot fully capture individual differences in biological aging, BA acceleration was derived by subtracting CA from BA. A positive value of BA acceleration indicates advanced biological aging, and vice versa. All analyses were performed using BA acceleration. More details on the construction and validation of BAs can be found in our previous study [29, 30]. In our study population, the median comprehensive BA at baseline was 51.83 (44.81, 58.69) years in CMEC and 55.77 (47.95, 62.10) years in UKB. Detailed distributions of organ-specific BAs and their component biomarkers are presented in Additional file 1: Table S1.
Assessment of covariates
Covariate information was mainly obtained through questionnaires, including sociodemographic characteristics, lifestyle and behavior factors, self-reported diseases, and reproductive history. Referring to previous studies [17, 23], in the final models we adjusted for age, ethnicity, education level, household income (CMEC only), Townsend deprivation index (UKB only), marital status (CMEC only), employment status, dietary score, total energy intake (CMEC only), smoking status, alcohol consumption, tea consumption, physical activity, body mass index (BMI), insomnia, depressive symptoms, anxiety symptoms, self-reported chronic diseases (cardiovascular disease, diabetes, cancer, and chronic obstructive pulmonary disease), age at menarche, number of live births, ever taken oral contraceptive pill, and ever used HRT (UKB only). Detailed description of covariates can be found in Additional file 1: Supplementary methods [31, 32].
Statistical analysis
Baseline characteristics
We described the baseline characteristics of study participants by menopausal status for the cross-sectional sample and by changes in menopausal status between baseline and follow-up for the longitudinal sample. Continuous variables were described as median (25th, 75th percentile), while categorical variables were presented as count (percentage). To assess the representativeness of the longitudinal sample, we compared baseline characteristics of women who completed the follow-up survey with those who did not in each cohort.
Analysis of three menopausal factors with comprehensive and organ-specific BA acceleration
To explore biological aging across distinct reproductive stages, we first examined the associations between menopausal status and BA acceleration using baseline data, analyzing both comprehensive and organ-specific BAs. We used multiple linear regression models, with pre-menopause as the reference group, and adjusted for baseline covariates mentioned above.
Using follow-up data, we further examined the relationship between changes in menopausal status (pre-pre, menopausal transition, and post-post) and changes in both comprehensive and organ-specific BA acceleration. We applied a change-to-change analysis with linear regression models, using the pre-pre group as the reference. Change-to-change analysis could reduce unmeasured time-invariant confounding by using only within-individual information. Models were adjusted for baseline time-invariant covariates, including demographics, reproductive history, and self-reported chronic diseases, as well as baseline and concurrent changes of time-variant covariates such as age, lifestyle factors, and mental status. Details of change-to-change analysis and covariate adjustment can be found in Additional file 1: Supplementary methods [33,34,35,36].
For women who had experienced natural menopause, we assessed the associations between age at menopause and BA acceleration. Age at menopause was analyzed as both a continuous and a categorical variable (< 40, 40–44, 45–49, 50–54, and ≥ 55 years, with the 45–49 age group as the reference [4, 37]). Multiple linear regression models were used, adjusting for the same baseline covariates.
Several sensitivity analyses were also performed to ensure the robustness of our findings. First, we reanalyzed the data after excluding females with self-reported chronic diseases, which included cardiovascular disease, diabetes, cancer, and chronic obstructive pulmonary disease. Second, missing covariate data were handled using multiple imputation via chained equations, and the analyses were repeated. Third, analyses were repeated with further adjustment for medication use, including anti-hypertensive and anti-diabetic medications (available in both cohorts), and lipid-lowering medications (available in UKB only). Lastly, we calculated E-values to assess the potential influence of unmeasured confounding [38].
Subgroup analysis by reproductive history and socioeconomic factors
To assess potential modifiers of the association between menopausal factors and comprehensive BA acceleration, we performed subgroup analyses primarily focused on reproductive history variables. These included age at menarche (< 15 or ≥ 15 years), age at first live birth, age at last live birth, number of live births (0–1 or ≥ 2), ever taken oral contraceptive pill (yes or no), and history of miscarriage (yes or no). Given the differences in childbearing age between the two cohorts, age at first live birth was grouped as < 23 or ≥ 23 years in CMEC and < 26 or ≥ 26 years in UKB, while age at last live birth was classified as < 26 or ≥ 26 years in CMEC and < 31 and ≥ 31 years in UKB. Additionally, subgroup analyses were conducted based on socioeconomic factors, including education and income level. Heterogeneity across groups was assessed using Cochran’s Q test.
All statistical analyses were conducted using R version 4.3.2. A two-sided P < 0.05 was considered statistically significant. The study was reported in accordance with the Strengthening the Reporting of Observational Studies in Epidemiology (STROBE) guidelines (Additional file 2).