Scientists have digitally reconstructed the face of Little Foot, a 3.67 million-year-old human ancestor, using high-resolution scanning and 3D modeling techniques. The reconstruction reveals a face that falls between the size of a gorilla and an…
Author: admin
-

Shehbaz, Nawaz discuss economic stability and fuel supply amid global tensions
Shehbaz Sharif met with Nawaz Sharif at Jati Umra to review Pakistan’s current political and economic situation, with a particular focus on energy security and the effects of rising global tensions.
The meeting was also attended by Ishaq Dar…
Continue Reading
-
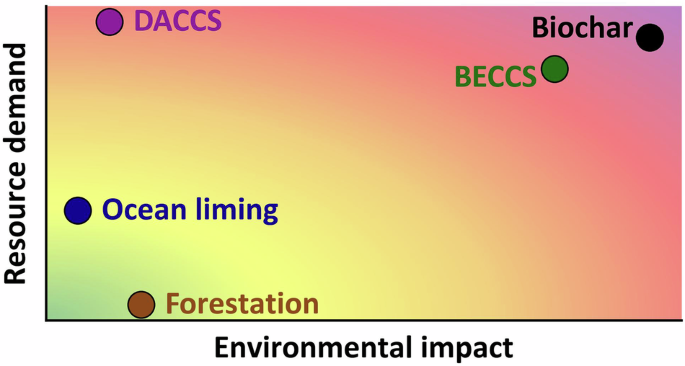
Negative emissions technologies and practices could challenge global resource supply and environmental limits
United Nations Environment Programme. Emissions Gap Report 2025: Off Target – Continued Collective Inaction Puts Global Temperature Goal at Risk. https://doi.org/10.59117/20.500.11822/48854 (2025).
IPCC. Climate Change 2022: Mitigation of Climate Change. Contribution of Working Group III to the Sixth Assessment Report of the Intergovernmental Panel on Climate Change. https://doi.org/10.1017/9781009157926 (2022).
Liu, Z., Deng, Z., Davis, S. J. & Ciais, P. Global carbon emissions in 2023. Nat. Rev. Earth Environ. 5, 253–254 (2024).
Smith, S. M. et al. The State of Carbon Dioxide Removal 2024 – 2nd Eddition. https://doi.org/10.17605/OSF.IO/F85QJ (2024).
Nemet, G. F. et al. Near-term deployment of novel carbon removal to facilitate longer-term deployment. Joule 7, 2653–2659 (2023).
Galán-Martín, Á et al. Delaying carbon dioxide removal in the European Union puts climate targets at risk. Nat. Commun. 12, 6490 (2021).
Smith, S. M. et al. The State of Carbon Dioxide Removal – 1st Edition. https://doi.org/10.17605/OSF.IO/W3B4Z (2023).
Bednar, J. et al. Operationalizing the net-negative carbon economy. Nature 596, 377–383 (2021).
World Commission on Environment and Development. Our Common Future. https://sustainabledevelopment.un.org/content/documents/5987our-common-future.pdf (1987).
Cobo, S. et al. Sustainable scale-up of negative emissions technologies and practices: where to focus. Environ. Res. Lett. 18, 02301 (2023).
Terlouw, T., Bauer, C., Rosa, L. & Mazzotti, M. Life cycle assessment of carbon dioxide removal technologies: a critical review. Energy Environ. Sci. 14, 1701–1721 (2021).
Deutz, S. & Bardow, A. Life-cycle assessment of an industrial direct air capture process based on temperature–vacuum swing adsorption. Nat. Energy 6, 203–213 (2021).
Madhu, K., Pauliuk, S., Dhathri, S. & Creutzig, F. Understanding environmental trade-offs and resource demand of direct air capture technologies through comparative life-cycle assessment. Nat. Energy 6, 1035–1044 (2021).
Terlouw, T., Treyer, K., Bauer, C. & Mazzotti, M. Life cycle assessment of direct air carbon capture and storage with low-carbon energy sources. Environ. Sci. Technol. 55, 11397–11411 (2021).
Ottenbros, A. B. et al. Prospective environmental burdens and benefits of fast-swing direct air carbon capture and storage. Sci. Rep. 14, 16549 (2024).
Bouaboula, H., Belmabkhout, Y. & Zaabout, A. Life cycle assessment of electrochemical pH-swing direct air capture. Energy Convers. Manag. 342, 120134 (2025).
Zhang, B., Kroeger, J., Planavsky, N. & Yao, Y. Techno-economic and life cycle assessment of enhanced rock weathering: a case study from the Midwestern United States. Environ. Sci. Technol. 57, 13828–13837 (2023).
Lefebvre, D. et al. Assessing the potential of soil carbonation and enhanced weathering through life cycle assessment: a case study for Sao Paulo State, Brazil. J. Clean. Prod. 233, 468–481 (2019).
Eufrasio, R. M. et al. Environmental and health impacts of atmospheric CO2 removal by enhanced rock weathering depend on nations energy mix. Commun. Earth Environ. 3, 106 (2022).
Foteinis, S., Campbell, J. S. & Renforth, P. Life cycle assessment of coastal enhanced weathering for carbon dioxide removal from air. Environ. Sci. Technol. 57, 6169–6178 (2023).
Shi, L. et al. Carbon capture and storage via enhanced carbonate weathering coupled with aquatic photosynthesis: potential, cost, and advantages. Earth Sci. Rev. 266, 105149 (2025).
Foteinis, S., Andresen, J., Campo, F., Caserini, S. & Renforth, P. Life cycle assessment of ocean liming for carbon dioxide removal from the atmosphere. J. Clean. Prod. 370, 133309 (2022).
Yan, Q., Zheng, L., Zhuang, W. & Liu, J. Alkalinity factory can achieve positive climate benefits within decades. J. Clean. Prod. 504, 145406 (2025).
Full, J. et al. Carbon-negative hydrogen production (HyBECCS): an exemplary techno-economic and environmental assessment. Int. J. Hydrog. Energy 52, 594–609 (2024).
Lask, J. et al. Lignocellulosic ethanol production combined with CCS—A study of GHG reductions and potential environmental trade-offs. GCB Bioenergy 13, 336–347 (2021).
Rojas Michaga, M. F. et al. Bioenergy with carbon capture and storage (BECCS) potential in jet fuel production from forestry residues: a combined techno-economic and life cycle assessment approach. Energy Convers. Manag. 255, 115346 (2022).
Wu, N., Lan, K. & Yao, Y. An integrated techno-economic and environmental assessment for carbon capture in hydrogen production by biomass gasification. Resour. Conserv. Recycl. 188, 106693 (2023).
Zakrisson, L., Azzi, E. S. & Sundberg, C. Climate impact of bioenergy with or without carbon dioxide removal: influence of functional unit and parameter variability. Int. J. Life Cycle Assess. 28, 907–923 (2023).
Bello, S., Galán-Martín, Á, Feijoo, G., Moreira, M. T. & Guillén-Gosálbez, G. BECCS based on bioethanol from wood residues: potential towards a carbon-negative transport and side-effects. Appl. Energy 279, 115884 (2020).
Susmozas, A., Iribarren, D., Zapp, P., Linβen, J. & Dufour, J. Life-cycle performance of hydrogen production via indirect biomass gasification with CO2 capture. Int. J. Hydrog. Energy 41, 19484–19491 (2016).
Peters, J. F., Iribarren, D. & Dufour, J. Biomass pyrolysis for biochar or energy applications? A life cycle assessment. Environ. Sci. Technol. 49, 5195–5202 (2015).
Azzi, E. S., Karltun, E. & Sundberg, C. Prospective life cycle assessment of large-scale biochar production and use for negative emissions in Stockholm. Environ. Sci. Technol. 53, 8466–8476 (2019).
Roberts, K. G., Gloy, B. A., Joseph, S., Scott, N. R. & Lehmann, J. Life cycle assessment of biochar systems: estimating the energetic, economic, and climate change potential. Environ. Sci. Technol. 44, 827–833 (2010).
Hammond, J., Shackley, S., Sohi, S. & Brownsort, P. Prospective life cycle carbon abatement for pyrolysis biochar systems in the UK. Energy Policy 39, 2646–2655 (2011).
Kane, S. et al. Uncertainty in determining carbon dioxide removal potential of biochar. Environ. Res. Lett. 20, 014062 (2025).
Kavindi, G. A. G., Tang, L. & Sasaki, Y. Assessing GHG emission reduction in biomass-derived biochar production via slow pyrolysis: a cradle-to-gate LCA approach. Resour. Conserv. Recycl. 212, 107900 (2025).
Forster, E. J., Healey, J. R., Dymond, C. & Styles, D. Commercial afforestation can deliver effective climate change mitigation under multiple decarbonisation pathways. Nat. Commun. 12, 1–12 (2021).
Liu, Y. & Guo, M. Environmental load analysis of forestation and management process of Larix olgensis plantation by life cycle analysis. J. Clean. Prod. 142, 2463–2470 (2017).
García-Quijano, J. F. et al. Carbon sequestration and environmental effects of afforestation with Pinus radiata D. Don in the Western Cape, South Africa. Clim. Change 83, 323–355 (2007).
Brunori, A. M. E. et al. Carbon balance and life cycle assessment in an oak plantation for mined area reclamation. J. Clean. Prod. 144, 69–78 (2017).
Lefebvre, D. et al. Assessing the carbon capture potential of a reforestation project. Sci. Rep. 11, 2–11 (2021).
Saharudin, D. M., Jeswani, H. K. & Azapagic, A. Reforestation of tropical rainforests as a negative emissions technology in Malaysia: an environmental and economic sustainability assessment. J. Environ. Manag. 371, 123250 (2024).
Zhao, J., Smith, W., Wang, J., Zhang, X. & Bergman, R. Life-cycle impact assessment of hardwood forest resources in the eastern United States. Sci. Total Environ. 909, 168458 (2024).
Levasseur, A., Lesage, P., Margni, M. & Samson, R. Biogenic carbon and temporary storage addressed with dynamic life cycle assessment. J. Ind. Ecol. 17, 117–128 (2013).
Khatri, P. et al. California’s harvested wood products: a time-dependent assessment of life cycle greenhouse gas emissions. Sci. Total Environ. 886, 163918 (2023).
Saharudin, D. M., Jeswani, H. K. & Azapagic, A. Building with biomass using tropical timber as a negative emissions technology (NET): sustainability assessment, comparison with other bio-based NETs and their potential in Malaysia. Sustain. Prod. Consum. 58, 293–318 (2025).
Shen, Z., Tiruta-Barna, L. & Hamelin, L. From hemp grown on carbon-vulnerable lands to long-lasting bio-based products: uncovering trade-offs between overall environmental impacts, sequestration in soil, and dynamic influences on global temperature. Sci. Total Environ. 846, 157331 (2022).
Babakhani, P. et al. Potential use of engineered nanoparticles in ocean fertilization for large-scale atmospheric carbon dioxide removal. Nat. Nanotechnol. 17, 1342–1351 (2022).
Jeswani, H. K., Saharudin, D. M. & Azapagic, A. Environmental sustainability of negative emissions technologies: a review. Sustain. Prod. Consum. 33, 608–635 (2022).
Cooper, J., Dubey, L. & Hawkes, A. The life cycle environmental impacts of negative emission technologies in North America. Sustain. Prod. Consum. 32, 880–894 (2022).
Qiu, Y. et al. Environmental trade-offs of direct air capture technologies in climate change mitigation toward 2100. Nat. Commun. 13, 3635 (2022).
Cobo, S., Galán-Martín, Á, Tulus, V., Huijbregts, M. A. J. & Guillén-Gosálbez, G. Human and planetary health implications of negative emissions technologies. Nat. Commun. 13, 2535 (2022).
Heck, V., Gerten, D., Lucht, W. & Popp, A. Biomass-based negative emissions difficult to reconcile with planetary boundaries. Nat. Clim. Change 8, 151–155 (2018).
Lade, S. J. et al. Human impacts on planetary boundaries amplified by Earth system interactions. Nat. Sustain. 3, 119–128 (2020).
Keith, D. W., Holmes, G., St. Angelo, D. & Heidel, K. A process for capturing CO2 from the atmosphere. Joule 2, 1573–1594 (2018).
Beuttler, C., Charles, L. & Wurzbacher, J. The role of direct air capture in mitigation of anthropogenic greenhouse gas emissions. Front. Clim. 1, 10 (2019).
Renforth, P., Jenkins, B. G. & Kruger, T. Engineering challenges of ocean liming. Energy 60, 442–452 (2013).
Stanton, B. J., Neale, D. B. & Li, S. Populus breeding: from the classical to the genomic approach. Genet. Genom. Popul. https://doi.org/10.1007/978-1-4419-1541-2_14 (2010).
Heaton, E. A. et al. Miscanthus: a promising biomass crop. in Advances in Botanical Research, Vol 56, Ch 3, 75–137 (Academic Press, 2010).
Biomass CCS Study. https://www.globalccsinstitute.com/archive/hub/publications/98606/biomass-ccs-study.pdf (2009).
Cabral, R. P., Bui, M. & Mac Dowell, N. A synergistic approach for the simultaneous decarbonisation of power and industry via bioenergy with carbon capture and storage (BECCS). Int. J. Greenh. Gas. Control 87, 221–237 (2019).
Braakhekke, M. C. et al. Modeling forest plantations for carbon uptake with the LPJmL dynamic global vegetation model. Earth Syst. Dyn. 10, 617–630 (2019).
Aalde, H. et al. Forest Land. In: IPCC Guidelines for National Greenhouse Gas Inventories. Ch 4 (IPCC, 2006).
Ye, L. et al. Biochar effects on crop yields with and without fertilizer: a meta-analysis of field studies using separate controls. Soil Use Manag 36, 2–18 (2020).
Gupta, S. & Kua, H. W. Factors determining the potential of biochar as a carbon capturing and sequestering construction material: critical review. J. Mater. Civ. Eng. 29, 04017086 (2017).
Cobo, S. NETPs LCI datasets. Zenodo https://doi.org/10.5281/zenodo.17574760 (2025).
Van Der Hulst, M. K., Hauck, M., Hoeks, S., Van Zelm, R. & Huijbregts, M. A. J. Learning curves in prospective life cycle assessment. Environ. Sci. Technol. 59, 16501–16512 (2025).
Woolf, D. et al. Greenhouse gas inventory model for biochar additions to soil. Environ. Sci. Technol. 55, 14795–14805 (2021).
United Nations Environmental Programme. Spreading like Wildfire – The Rising Threat of Extraordinary Landscape Fires. 48–50 https://www.unep.org/resources/report/spreading-wildfire-rising-threat-extraordinary-landscape-fires (2022).
Rhodes, J. S. & Keith, D. W. Engineering economic analysis of biomass IGCC with carbon capture and storage. Biomass Bioenergy 29, 440–450 (2005).
World Health Organization. Global health estimates: leading causes of DALYs. https://www.who.int/data/gho/data/themes/mortality-and-global-health-estimates/global-health-estimates-leading-causes-of-dalys.
Huijbregts, M. A. J. et al. ReCiPe 2016 v1.1. A Harmonized Life Cycle Impact Assessment Method at Midpoint and Endpoint Level. Report I: Characterization (National Institute for Public Health and the Environment. The Netherlands, 2017).
Richardson, K. et al. Earth beyond six of nine planetary boundaries. Sci. Adv. 9, eadh2458 (2023).
Steffen, W. et al. Planetary boundaries: guiding human development on a changing planet. Science 347, 1259855 (2015).
European Commission. Study on the Critical Raw Materials for the EU 2023 – Final Report. European Commission. https://doi.org/10.2873/725585 (2023).
Lebling, K. et al. Direct Air Capture: Assessing Impacts to Enable Responsible Scaling. World Resources Institute. https://doi.org/10.46830/wriwp.21.00058 (2022).
Bobba, S., Carrara, S., Huisman, J., Mathieux, F. & Pavel, C. Critical Raw Materials for Strategic Technologies and Sectors in the EU – a Foresight Study. (European Commission, 2020).
Erans, M. et al. Direct air capture: process technology, techno-economic and socio-political challenges. Energy Environ. Sci. 15, 1360–1405 (2022).
Campbell, J. S. et al. Geochemical negative emissions technologies: part I. Rev. Front. Clim. 4, 879133 (2022).
Camatti, E. et al. Short-term impact assessment of ocean liming: a copepod exposure test. Mar. Pollut. Bull. 198, 115833 (2024).
Ho, D. T. et al. Monitoring, Reporting, and Verification for Ocean Alkalinity Enhancement. in State of the Planet, Ch12 (Copernicus Publications, 2023).
Lv, W. et al. Enhancing classification and recovery of barite from waste drilling fluid by inlet particle arranging of hydrocyclone. J. Water Process Eng. 56, 104341 (2023).
Xia, Y. et al. Application and mechanistic insights of a washing/microwave/ultrasonic ternary pretreatment for enhancing barite flotation in waste drilling fluids. Sci. Rep. 14, 20887 (2024).
Van Der Voet, E., Van Oers, L., Verboon, M. & Kuipers, K. Environmental implications of future demand scenarios for metals: methodology and application to the case of seven major metals. J. Ind. Ecol. 23, 141–155 (2019).
Raabe, D., Tasan, C. C. & Olivetti, E. A. Strategies for improving the sustainability of structural metals. Nature 575, 64–74 (2019).
International Energy Agency. Recycling of Critical Minerals. Strategies to Scale up Recycling and Urban Mining. https://www.iea.org/reports/recycling-of-critical-minerals (2024).
Fajardy, M. & Mac Dowell, N. Can BECCS deliver sustainable and resource efficient negative emissions? Energy Environ. Sci. 10, 1389–1426 (2017).
Rosa, L., Sanchez, D. L. & Mazzotti, M. Assessment of carbon dioxide removal potential via BECCS in a carbon-neutral Europe. Energy Environ. Sci. 14, 3086–3097 (2021).
Braun, J. et al. Multiple planetary boundaries preclude biomass crops for carbon capture and storage outside of agricultural areas. Commun. Earth Environ. 6, 102 (2025).
Pett-Ridge, J. et al. Roads to Removal: Options for Carbon Dioxide Removal in the United States. https://doi.org/10.2172/2301853 (2023).
Smith, P. et al. Biophysical and economic limits to negative CO2 emissions. Nat. Clim. Change 6, 42–50 (2016).
Cobo, S., Dominguez-Ramos, A. & Irabien, A. Trade-offs between nutrient circularity and environmental impacts in the management of organic waste. Environ. Sci. Technol. 52, 10923–10933 (2018).
Schmidt, H. et al. Biochar in agriculture – A systematic review of 26 global meta-analyses. GCB Bioenergy 13, 1708–1730 (2021).
Smith, H. B., Vaughan, N. E. & Forster, J. Long-term national climate strategies bet on forests and soils to reach net-zero. Commun. Earth Environ. 3, 1–12 (2022).
Hickey, C., Fankhauser, S., Smith, S. M. & Allen, M. A review of commercialisation mechanisms for carbon dioxide removal. Front. Clim. 4, 1101525 (2023).
National Academies of Sciences Engineering and Medicine. A Research Strategy for Ocean-Based Carbon Dioxide Removal and Sequestration. https://doi.org/10.17226/26278 (The National Academies Press, 2021).
International Standards Organization. Environmental Management – Life Cycle Assessment – Principles and Framework. ISO 14040 https://www.iso.org/standard/37456.html#amendment (2006).
International Standards Organization. Environmental Management – Life Cycle Assessment – Requirements and Guidelines. ISO 14044 https://www.iso.org/standard/38498.html (2006).
European Commission – Joint Research Centre – Institute for Environment and Sustainability. in International Reference Life Cycle Data System (ILCD) Handbook – General Guide for Life Cycle Assessment – Detailed Guidance https://doi.org/10.2788/38479 (2010).
McKay, D. I. A. et al. Exceeding 1.5 °C global warming could trigger multiple climate tipping points. Science 377, 1171 (2022).
Mutel, C. Brightway: An open source framework for life cycle assessment. J. Open Source Softw. 2, 236 (2017).
Arvidsson, R. et al. Environmental assessment of emerging technologies: recommendations for prospective LCA. J. Ind. Ecol. 22, 1286–1294 (2018).
Sacchi, R. et al. PRospective EnvironMental Impact asSEment (premise): a streamlined approach to producing databases for prospective life cycle assessment using integrated assessment models. Renew. Sustain. Energy Rev. 160, 112311 (2022).
Mendoza Beltran, A. et al. When the background matters: using scenarios from integrated assessment models in prospective life cycle assessment. J. Ind. Ecol. 24, 64–79 (2020).
Wernet, G. et al. The ecoinvent database version 3 (part I): overview and methodology. Int. J. Life Cycle Assess. 21, 1218–1230 (2016).
Baumstark, L. et al. REMIND2.1: transformation and innovation dynamics of the energy-economic system within climate and sustainability limits. Geosci. Model Dev. 14, 6571–6603 (2021).
Riahi, K. et al. The shared socioeconomic pathways and their energy, land use, and greenhouse gas emissions implications: an overview. Glob. Environ. Change 42, 153–168 (2017).
van Vuuren, D. P. et al. RCP2.6: Exploring the possibility to keep global mean temperature increase below 2. C. Clim. Change 109, 95–116 (2011).
Byers, E. et al. AR6 Scenarios Database. Zenodo https://doi.org/10.5281/zenodo.5886911 (2022).
Levasseur, A., Lesage, P., Margni, M., Deschěnes, L. & Samson, R. Considering time in LCA: dynamic LCA and its application to global warming impact assessments. Environ. Sci. Technol. 44, 3169–3174 (2010).
Smith, C. et al. The Earth’s energy budget, climate feedbacks and climate sensitivity-supplementary material. in Climate Change 2021: The Physical Science Basis. Contribution of Working Group I to the Sixth Assessment Report of the Intergovernmental Panel on Climate Change (IPCC, 2021).
Millar, J. R., Nicholls, Z. R., Friedlingstein, P. & Allen, M. R. A modified impulse-response representation of the global near-surface air temperature and atmospheric concentration response to carbon dioxide emissions. Atmos. Chem. Phys. 17, 7213–7228 (2017).
Ryberg, M. W., Owsianiak, M., Richardson, K. & Hauschild, M. Z. Development of a life-cycle impact assessment methodology linked to the Planetary Boundaries framework. Ecol. Indic. 88, 250–262 (2018).
Cobo, S. Method to quantify metal extraction in life cycle models, showing supply risk levels for the EU. Zenodo https://doi.org/10.5281/zenodo.15084711 (2025).
U.S. Geological Survey Miner. Commod. Summ. 2023 https://doi.org/10.3133/mcs2023 (2023).
Continue Reading
-
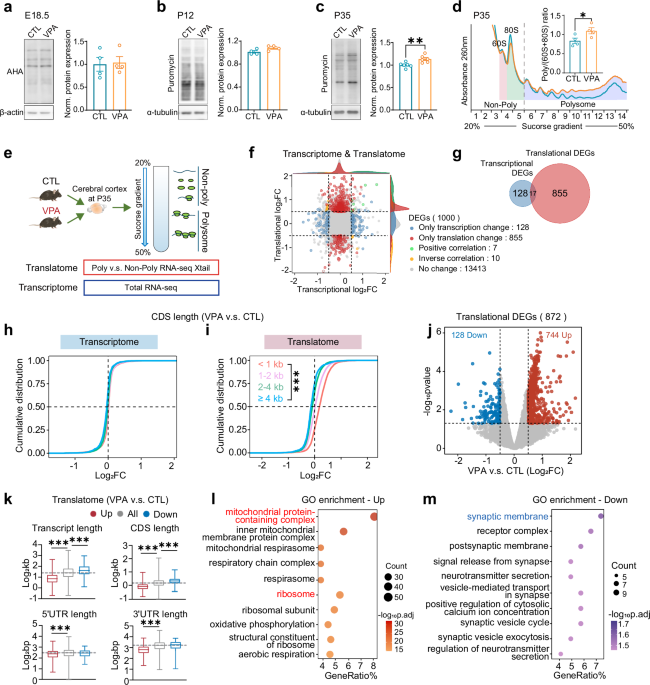
Correction of eIF4E overactivation rescues translatome imbalance and core ASD-like behaviors in valproic acid-induced offspring mice
Mice
C57BL/6 mice, purchased from SPF (Beijing) Biotechnology Co., were used in all experiments. Mice were group-housed (four per cage) and given free access to water and food under controlled environmental conditions at 24 ± 2 °C with 50% relative humidity, and on a 12 h-light/dark cycle with light on from 08:00 to 20:00. All experimental procedures involving the use of animals were approved by the Ethics Committee on Animal Experiments at Jinan University. All animal experiments were performed according to the Guide for the Care and Use of Laboratory Animals. No formal randomization was used, and no animals were excluded. For drug treatment, mice were first tested for social interaction and weighed. Animals were then stratified based on sociability and body weight, and randomly assigned to drug or vehicle groups within each stratum.
VPA-exposed ASD mice model was established as follows: VPA (Sigma-Aldrich, P4543, St. Louis, MO, USA) was dissolved in 0.9% saline to a concentration of 50 mg/mL. A single dose of VPA (500 mg/kg, i.e., 10 µL/g body weight) was intraperitoneally (i.p.) injected into pregnant mice on gestational day 12.5. Equal volume of normal saline (10 µL/g body weight) was injected as the vehicle control. For behavioral tests and Western blotting on eIF4E phosphorylation, both male and female offspring from the same litters were tested. For other tests, only male mice were used.
Antibodies
For Western blotting, the following antibodies were purchased from Cell Signaling Technology (Danvers, MA, USA): 4E-BP1 (9452S, 1:2000), p-Thr37/46-4EBP1 (p-4EBP1, 2855, 1:2000), 4E-BP2 (2845S, 1:1000), eIF4E (9742, 1:1000), p-Ser209-eIF4E (p-eIF4E, 9741S, 1:1000), ERK1/2 (4695S, 1:1000), p-Thr202/Tyr204-ERK (p-ERK, 4370, 1:1000), MNK1(2195S, 1:2000), p-Thr197/202-MNK (p-MNK1, 2111S, 1:2000), mTOR (2972S, 1:1000), p-Ser2448-mTOR (p-mTOR, 2971S, 1:2000), p70S6K (9209S, 1:1000), p-Thr389-p70S6K (p-70S6K, 9205S, 1:1000), RPS6 (2217S, 1:1000), p-Ser235/236-RPS6 (p-RPS6, 2211S, 1:1000), HSP90 (4877, 1:1000). Antibodies against α-tubulin (A01080, 1:10000) and β-actin (A01010, 1:10000) were from Abbkine Scientific (Atlanta, GA, USA), puromycin (MABE343, 1:2000) from Millipore Corporation (Billerica, MA, USA), PSD95(ab2723, 1:1000) from Abcam (Cambridge, UK), Synaptophysin (S5768, 1:1000) from Sigma-Aldrich, and GAPDH (20035, 1:10000) from ProMab Biotechnologies (Richmond, CA, USA).
The antibodies used for immunofluorescence were as follows: p-eIF4E (NBP3-21524, 1:150) from Novus Biologicals (Centennial, CO, USA), microtubule-associated protein 2 (MAP2; ab5392, 1:200) and PSD95 (ab2723, 1:200) from Abcam, and puromycin (MABE343, 1:200) from Millipore. The secondary antibodies Alexa Fluor 488 goat anti-mouse IgG antibody (A11029, 1:200) and Alexa Fluor 546 goat anti-Rabbit IgG antibody (A11035, 1:200) were from Invitrogen (Thermo Fisher Scientific Inc, Carlsbad, CA, USA).
Behavioral tests
Social discrimination test was performed at juvenile stage (4–5 weeks old). Three-chamber test, self-grooming, and Open-field test were performed in male and female offspring at both 5 and 9 weeks old. Cognitive function tests and elevated Zero-maze test were performed only in male offspring in adulthood (9 weeks old). Mice were transferred to the behavior testing room to acclimate the environment 1 h before each experiment. In both the social discrimination test and Three-chamber test, all the unfamiliar mice were age- and sex-matched with the testing mice. The ambient illumination was 100–120 lux for the Open field test, and 40–60 lux for all other behavioral tests. All behavioral tests were recorded by an overhead video camera and analyzed by TopScan 3.0 (Clever Sys Inc, Washington, D.C., USA) [76, 77]. The experimenter was blinded to the groups of experiments.
Social discrimination test
Social discrimination test was conducted in a 40 cm (length) × 40 cm (width) × 40 cm (height) rectangular box. In the first phase, an empty wire cup was placed on one side of the arena, and the test mouse was allowed to freely explore the area for 10 min. In the second phase, a stranger mouse was placed in the cup, and the test mouse was allowed to explore freely again for 10 min. The duration of interaction with the empty cup or the stranger mouse were analyzed. The interaction index was calculated as the ratio of interaction time with the stranger mouse to interaction time with the empty cup.
Open field test and self-grooming analysis
The test mouse was put in the center of a 40 cm (length) × 40 cm (width) × 40 cm (height) arena and allowed to explore freely for 30 min [76, 77]. The travel distance and duration in the peripheral and center regions of the mice were analyzed. Additionally, the duration of grooming time of each mouse within the last 20 min of the 30-min test was analyzed. Grooming behaviors including washing face, licking paws, scratching or rubbing head and ears were counted.
Three-chamber test
Three-chamber test was carried out in a 60 cm (length) × 40 cm (width) × 20 cm (height) box with three chambers partitioned by two walls, each has a passage (5 × 5 cm) at the bottom [76, 77]. Following a 10-min habituation in the three empty chambers, the test mouse was subject to a 10-min social approach phase, in which it was allowed to explore an empty wire cup placed in one side chamber and a stranger mouse-containing wire cup in the other side chamber. The test was concluded with a 10-min social novelty phase, in which the test mouse was allowed to explore a familiar mouse-containing cup or an unfamiliar mouse-containing cup. Travel distance, the exploration time in different chambers, and sniffing time for the stranger mouse or empty cup were analyzed.
Cell culture, plasmids construction, and transfection
The Neuro-2a and HEK293T cell lines, obtained from the American Type Culture Collection (ATCC), were maintained in Dulbecco’s Modified Eagle’s Medium (DMEM, Gibco, C11995500BT) supplemented with 10% Fetal Bovine Serum (Yeasen, 40130ES76) and 1% Penicillin-Streptomycin (Gibco, 15140122), at 37 °C in 5% CO2. The plasmids pCDH-3×FLAG-WT-eIF4E, pCDH-3×FLAG-eIF4E S209A (non-phosphorylatable), and pCDH-3×FLAG-eIF4E S209D (phosphomimetic) were constructed using standard cloning and mutagenesis method. Different plasmids were transfected in cells with 80% confluency using Lipofectamine LTX (Invitrogen, 15338100) following the manufacturer’s instruction.
De novo protein synthesis measurements
For cortical protein synthesis measurement at E18.5, BONCAT was performed by i.p. injection of 50 μg/g AHA (Click Chemistry, 1066-100), a bioorthogonal analogue of methionine, to the pregnant mice at E17.5. After 16 h, embryos were harvested and the AHA-incorporated nascent proteins were coupled with disulfide biotin-DBCO (Click Chemistry Tools, A112) by copper free catalytic azide alkyne cycloaddition reaction. Streptavidin-Dynabeads (Thermo Fisher, 11206D) were used to pulldown the biotin-coupled nascent proteins, which was measured by Western blotting using HRP-conjugated streptavidin (Thermo Scientific, N100).
For measurement at postnatal stages, mice at P12 and P35 were sacrificed, and the brains were rapidly perfused to prepare slices as described previously [77]. The brain slices (300 μm) were placed in artificial cerebrospinal fluid (ACSF; 124 mM NaCl, 3 mM KCl, 1.25 mM NaH2PO4, 1 mM MgCl2, 2 mM CaCl2, 26 mM NaHCO3, and 10 mM glucose) and maintained at 32 °C for 40 min, bubbled with 95% O2 and 5% CO2. The slices were then transferred to bubbled ACSF containing 10 μg/ml puromycin (Sigma-Aldrich, P8833) for 25 min. Following the incubation period, the brain slices underwent two washes with ACSF, and the cortical and hippocampal regions were carefully separated for Western blotting using anti-puromycin antibody.
For puromycylation in cell cultures, Neuro-2a cells were transfected with plasmid for 24 h. Then puromycin (1 μM final concentration; Sigma-Aldrich, P8833) was added in the culture medium and incubated with the cells for 30 min. Cell lysates were then collected for Western blotting using anti-puromycin antibody. For in situ visualization of protein synthesis, AHA-based FUNCAT was used to visualize protein synthesis in the cytoplasm and mitochondria [69, 78]. Cells were incubated in a methionine-free medium, i.e., Dulbecco’s modified eagle medium without L-glutamine, L-methionine and L-cystine (Gibco, 21013024) supplemented with 200 μM L-cystine (MCE, HY-N0394) and 2 mM GlutaMAX (Gibco, 35050061), for 20 min to exhaust L-methionine taken up in the cells. Cells were then treated with 50 μM AHA (Invitrogen, C10102) for 30 min to label nascent proteins. To differentiate cytoplasmic and mitochondrial protein synthesis, 100 μg/mL of cycloheximide (Sigma, C7698) or both cycloheximide and 150 µg/mL chloramphenicol (MCE, HY-B0239) was pretreated the cells for 20 min before AHA was added. The cells were fixed, permeabilized, and AHA-labeled nascent proteins were covalently linked with Alexa Fluor 546 alkyne (Thermo Fisher, A10275) through a copper-catalyzed azide-alkyne cycloaddition (CuAAC) click reaction using the Click-iT Cell Reaction Buffer Kit (Invitrogen, C10269). FUNCAT signals were imaged using a Zeiss LSM 800 confocal microscope (Carl Zeiss AG).
Polysome profiling
Polysome profiling of cortical tissues was performed through a continuous 20% to 50% sucrose density gradient via ultracentrifuge with SW-4Ti rotor (Beckman, Optima XPN-100), following the protocol published previously [79]. For Neuro-2a cells, samples were lysed immediately on ice in a buffer containing 15 mM Tris-HCl pH 7.5, 300 mM NaCl, 15 mM MgCl2, 1% Triton-X100 (v/v), 0.5% Na-deoxycholate (w/v), 100 U/mL RNase inhibitor (Thermo Fisher Scientific, Waltham, MA USA), 20 mM DL-Dithiothreitol (Aladdin Holdings Group Co., Ltd, Los Angeles, CA, USA), 0.1 mg/ml cycloheximide, 0.15 mg/mL chloramphenicol, and 1×protease inhibitor (TargetMol Chemicals Inc, Wellesley Hills, MA, USA). Lysates were separated through a continuous 10% to 50% sucrose density gradient via ultracentrifuge. 15 gradient fractions from light to heavy sedimentation were sequentially collected by a Piston Gradient Fractionator (BioComp Instruments, Nova Scotia, Canada) while RNA was detected at UV absorbance 260 nm. The peak areas of different ribosome components were quantitatively calculated by OriginPro 9.0 software (OriginLab Co., Northampton, US).
RNA sequencing and translatome analysis
The samples obtained by polysome profiling were divided into non-poly fractions, containing non-translated or weakly translated mRNAs, and poly fractions, containing actively translated mRNAs. Total RNAs from non-poly and poly fractions, as well as from total homogenates, were extracted using TRIzol reagent (Invitrogen, 15596026). RNA-sequencing was performed on the DNBSEQ-T7 sequencing platform, yielding approximately 6 G of raw data per sample which were subjected to quality control using the FastQC package. The NanoTrans analysis pipeline [80] was utilized to align the data with the GRCm39 mouse genome reference (NCBI Annotation Release 109; https://www.ncbi.nlm.nih.gov/datasets/genome/GCF_000001635.27/). For the translatome analysis, DEGs were identified using Xtail R package [47] based on the values calculated from the read counts of polysome mRNA over non-poly mRNA fractions. For transcriptome analysis, DEGs were identified from total RNA-seq data using DESeq2 R package [81]. DEGs were defined by |Log2FC| > 0.5 and p-value < 0.05. Volcano plots of DEGs were generated using the ggplot2 R package, and enrichment analysis for all DEGs was performed using the ClusterProfiler R package, referencing the Gene Ontology (GO) database. GSEA analysis using the ClusterProfiler R package, referencing the MSigDB GSEA database. The R version 4.2.3 was used in this study.
SFARI gene classification
Genes associated ASD were curated from the SFARI GENE database (https://gene.sfari.org/, updated on July 7, 2025) using the following criteria: Genes with ≥ 10 supporting reports (n = 472) and genes reported to be syndromic (n = 464), filtered out if there is the term “syndromic” in the description of genetic-category. Gene lists of these two classifications are provided in Table S5 and S6.
RNA extraction and quantitative real-time PCR (RT-qPCR)
RT-qPCR was conducted following the methods described previously [79]. cDNA synthesis from mRNAs in non-poly, poly, and total fractions was carried out using Moloney murine leukemia virus reverse transcriptase (MMLV-RT, Promega, M170A). qPCR amplification was performed using iQSYBR® Green Supermix (Bio-Rad, B21202) on a qPCR real-time system (Roche Light Cycler 480 Instrument). Primers for each gene were designed to amplify all possible spliced and edited variants, with the sequences listed as follows (from 5’ to 3’):
mt-Nd1-F: GGCCCATTCGCGTTATTCTT
mt-Nd1-R: AGCGTGGATAAGATGCTCGG
mt-Nd5-F: AACCAGCATTCCAGTCCTCAC
mt-Nd5-R: GTTGAGGTGGATTTTGGGATGG
mt-Co1-F: CTACCCACCTCTAGCCGGAA
mt-Co1-R: TGTGTTTAGGTTGCGGTCTGT
mt-Co2-F: GCTCTCCCCTCTCTACGCAT
mt-Co2-R: AGCAGTCGTAGTTCACCAGG
mt-Cytb-F: CCTTGACCCGATTCTTCGCT
mt-Cytb-R: GGGTGGGGTGTTTAGTGGAT
mt-Atp6-F: CGCCTAATCAACAACCGTCTC
mt-Atp6-R: CCAGCTCATAGTGGAATGGCT
mt-Atp8-F: GCCACAACTAGATACATCAACATGA
mt-Atp8-R: TGTTGGGGTAATGAATGAGGCA
Fis1-F: GAGGGCTGTTGCAGACTGAG
Fis1-R: CCAGTCCAATGAGTCCAGCC
Timm13-F: GGCTTCGGCTCGGATTTTG
Timm13-R: CACTTGTCCGTCATTCTCTGG
Tomm6-F: AGGTTCCAGACAACGTGGGA
Tomm6-R: AATGTCACTCAAGTTCCTGGC
Ndufv3-F: ATGTCTGTGAACGGAGCGG
Ndufv3-R: AGCACACTTTGTGTCTTGGGA
Ndufaf8-F: ATGTCTGTGAACGGAGCGC
Ndufaf8-R: GCGAACGCAGAGGTCCTTAC
Rps12-F: GCCAAAGCCTTAGACAAGCG
Rps12-R: GGCCTACCCATTCCCCTAGT
Rps21-F: GCCGAGGTTGATAGGACCAC
Rps21-R: ATCAGCCTTAGCCAATCGGAG
Rps29-F: GTCTGAAGGCAAGATGGGTCA
Rps29-R: TGGTAGTAGTCAGTCGAATCCA
Rpl3l-F: GAAGGGCCGGGGTGTTAAAG
Rpl3l-R: AGCTCTGTACGGTGGTGGTAA
Rpl8-F: AAGGCGCGGGTTCTGTTTT
Rpl8-R: GCTCTGTCCGCTTCTTGAATC
Rplp1-F: CAAGGCTCTGGCCAATGTCA
Rplp1-R: AGTCAAAAAGACCGAAGCCCA
Mrps26-F: CATGACCCGCCTGCCAAAT
Mrps26-R: TCTCCCGGTACTGTCGGTAG
Mrpl28-F: CCTCACGGGACCAAGTTCAA
Mrpl28-R: CCCTCTTGGAGAGCTTGTCG
LC-MS/MS and data analysis
Cerebral cortices were homogenized in ice-cold lysis buffer containing 320 mM sucrose, 5 mM Tris-HCl (pH 7.4), 1 mM MgCl2, 1 mM DTT, and protease and phosphatase inhibitor cocktail (TargeMol, C0004). The homogenate was centrifuged at 1000×g for 10 min at 4 °C to remove debris and nuclei. The supernatant was then centrifuged at 13000×g for 15 min at 4 °C, and the pellet (crude synaptosome fraction) was suspended in a solution containing 320 mM sucrose, 5 mM Tris-HCl (pH 7.4), and protease and phosphatase inhibitors. Proteins were quantified using BCA assay kit (Thermo Fisher, 23252). 80 μg of protein per sample was processed on the PreOn platform using the iST Protein Preparation Kit (PreOmics, P.O.00027, Germany), with trypsin digestion for 3 h. Digested peptides were desalted, vacuum-dried, and reconstituted in 0.1% formic acid for quantification. A total of 300 ng of peptides was loaded onto a nanoElute2 system coupled to a timsTOF HT (Bruker Corporation, USA) via CaptiveSpray ionization. Peptides were separated using a 55-min linear gradient from 2% to 37% acetonitrile (in 0.1% formic acid). Data were acquired in diaPASEF mode (m/z 300–1,500). Database searches were performed in PEAKS Studio 12 against the SwissProt Mus musculus database (17,214 entries). Parameters included trypsin specificity, up to 2 missed cleavages, peptide length 7–30 residues, variable modifications (methionine oxidation, N-terminal acetylation), and fixed carbamidomethylation. Match-between-runs, label-free quantification, and total ion current normalization were applied. Proteins with at least one unique peptide detected were identified and quantified. Differentially expressed proteins were defined as up-regulated (fold change > 1.1, p < 0.05) or down-regulated (fold change < 0.9, p < 0.05).
ATP assay
ATP levels were measured using an ATP Assay Kit (Beyotime, S0026). Cortical tissues were immediately homogenized in the ATP detection lysis buffer, centrifuged at 4 °C at 12000×g for 5 min, and the supernatant was collected for the measurement of ATP content using Infinite F500 (TECAN, Switzerland).
Transmission electron microscopy (TEM) and image processing
Mice were euthanized and the cerebral cortices were rapidly dissected on ice. The mPFC was micro-dissected out and immediately fixed in the TEM fixative solution for 2 h at room temperature before placed at 4 °C. Subsequent steps for routine TEM, including dehydration, sectioning, and imaging, were carried out. Sections were imaged using a Hitachi TEM system at 80.0 kV. Analyses of the number and morphology of mitochondria within the synaptic areas, the number of presynaptic vesicles, and the morphology of synapses were performed using ImageJ software (National Institutes of Health, Bethesda, MD, United States).
Mitochondrial complex activity assays
Different mitochondrial complex activity levels were measured using the following kits correspondingly: Mitochondrial Complex I Activity Assay Kit (Elabscience, E-BCK149-M), Mitochondrial Complex II Activity Assay Kit (Elabscience, E-BCK150-M), Mitochondrial Complex III Activity Assay Kit (Elabscience, E-BCK151-M), Mitochondrial Complex IV Activity Assay Kit (Elabscience, E-BCK152-M), and Mitochondrial Complex V Activity Assay Kit (Elabscience, E-BCK153-M). Briefly, cortical tissue was homogenized and centrifuged at 600×g for 5 min at 4 °C, and the supernatant was then centrifuged at 11000×g for 10 min at 4 °C. The pellet was resuspended and sonicated for 1 min at 4 °C, and centrifuged at 11000×g for 10 min at 4 °C. The supernatant was collected for the measurement of different mitochondrial complex activities.
Primary cortical neuron culture from VPA-exposed embryos
A single dose of VPA (500 mg/kg body weight) was i.p. injected in pregnant C57BL/6 mice on gestational day 12.5, and normal saline was injected as the vehicle control. Primary cortical neurons were cultured from VPA- or saline-exposed embryos at E17.5 following a protocol published previously [82, 83]. Briefly, the cortical tissues were trypsinized to obtain a single-cell suspension, and then seeded on 18-mm diameter coverslips coated with 1 mg/mL poly-D-lysine (Millipore, A-003-E) at a density of 2.5×10⁴ cells per coverslip, and cultured in Neurobasal Medium (Gibco, 21103049) supplemented with 2% B27 (Gibco, 17504044), 1 mM L-Glutamine (Gibco, 25030081), and 0.18% D-Glucose (Gibco, A2494001). Half of the medium was changed every three to four days.
Mitochondrial membrane potential assay
Mitochondrial membrane potential in primary cortical neurons was measured using the Mitochondrial Membrane Potential Assay Kit with TMRM (Beyotime, C2001S). Briefly, TMRM was diluted to 1×solution and added to primary cortical neurons at 15 days in vitro (DIV) for 30 min at 37 °C. Carbonyl cyanide m-chlorophenyl hydrazone (CCCP), a mitochondrial membrane potential depolarization agent, was added to cells at a concentration of 10 μM for 20 min pre-incubation, acting as a negative control. After incubation, the cells were washed twice and TMRM fluorescence was photographed in live cells using Zeiss LSM 800 confocal microscope.
Immunofluorescence
To analyze dendritic PSD95 puncta, primary cortical neurons at 14 DIV were fixed and immunostained with mouse anti-PSD95 and rabbit anti-MAP2 antibodies as previously described [84]. Images were acquired using Zeiss LSM 800 confocal microscope with a 63× objective (Carl Zeiss AG). PSD95 puncta density was quantified in MAP2-positive dendrites using ImageJ software.
To analyze the levels of p-eIF4E and puromycin in the cortex, cryosections (20 μm) were made using a frozen microtome (Leica, CM1950). The sections were permeabilized with 0.3% Triton X-100 in PBS for 30 min, then blocked with 3% bovine serum albumin (Solarbio, A8020) and 10% goat serum (GENOM, GNMGS100) at 37 °C for 1 h. The sections were then incubated with rabbit anti-p-eIF4E and mouse anti-puromycin antibodies at 4 °C overnight, followed by 1 h incubation at room temperature. Secondary antibodies Alexa Fluor 488 goat anti-mouse IgG and Alexa Fluor 546 goat anti-rabbit IgG were applied at 37 °C for 1 h. Nuclei were counterstained with 4’,6-diamidino-2-phenylindole (DAPI; Sigma-Aldrich, D9542, 1:1000) for 10 min. Sections were mounted with Antifade Mounting Medium (Beyotime, P0128S) and imaged on Zeiss LSM 800 confocal microscope.
Mitochondrial respiratory chain enzyme analysis
The Oroboros O2k experiment was conducted following an established protocol with the Oroboros O2k platform (Oroboros Instruments, Austria) [85]. HEK293T cells were plated in 6-well plates and detached by treating with a 0.05% trypsin-EDTA solution (Gibco, 15400054) for 30 s. Afterward, the cells were counted and adjusted to a density of 1×10⁶ cells per 100 µL. Only two samples were tested simultaneously. Basal respiration was recorded after 10-min equilibration at 37 °C. Oligomycin (5 nM final concentration; Sigma-Aldrich, O4876) was then added to inhibit ATP synthase (Complex V). Maximal respiration was induced by titrating carbonyl cyanide 4-(trifluoromethoxy)phenylhydrazone (FCCP; 1 µM final concentration; Sigma-Aldrich, C2920). Rotenone (0.5 µM final concentration; Sigma-Aldrich, R8875) was injected to inhibit Complex I. Antimycin A (2.5 µM final concentration; Sigma-Aldrich, A8674) was added to inhibit Complex III. Oxygen consumption rates were normalized to cell count and expressed as pmol O₂/s/10⁶ cells.
Drug preparation and treatment
eFT508 (Tomivosertib; MedChemExpress LLC, Monmouth Junction, NJ, USA) was dissolved in DMSO at a concentration of 5 mg/mL as a stock solution. The working drug solution was made by freshly diluted the stock solution in normal saline with PEG300 (40% v/v) and Tween-80 (5% v/v) to a concentration of 1 mg/mL. The prenatally VPA-exposed male mice were randomly allocated to vehicle group (VPA-DMSO) and drug-treated group (VPA-eFT508), and mouse in each group received 4 times daily i.p injections of vehicle or eFT508 (1 mg/mL) correspondingly at postnatal week 3. Behavior tests including Open field test, self-grooming analysis, Three-chamber test, and elevated Zero-maze test were performed at both postnatal Weeks 4–6 and Week 9. A single drug dose was administered 1 h prior to each behavioral experiment and tissue collection.
Statistical analysis
No a priori power analysis was conducted because the sample sizes for each experimental group were based on pilot data and published studies [76, 77, 79]. All experiments were conducted in a blinded manner. Statistical analyses were carried out using GraphPad Prism 9.2.0. The results were presented as mean ± SEM. Distribution normality (Shapiro–Wilk test) and homogeneity of variance of the data were checked before parametric analyses. No exclusion criteria were pre-determined in our tests. Differences between the two groups were assessed using two-tailed t-test, and multiple-group comparisons were analyzed using one-way analysis of variance (ANOVA) followed by post hoc Tukey’s multiple comparisons. Differences between distributions were compared using KS test or two-sample z test. P-value less than 0.05 was considered statistically significant for all statistical analyses. Detailed statistical information of each experiment was provided in Table S10.
Continue Reading
-
Breakthrough Discovery Could Make Pancreatic Cancer Respond to Chemo Again – SciTechDaily
- Breakthrough Discovery Could Make Pancreatic Cancer Respond to Chemo Again SciTechDaily
- Melvin Sanicas: How GATA6 Levels Influence Treatment Response in Pancreatic Cancer Oncodaily
- Scientists find the genetic switch that makes pancreatic cancer…
Continue Reading
-
Israeli settler fatally shoots Palestinian in West Bank, health ministry says – Reuters
- Israeli settler fatally shoots Palestinian in West Bank, health ministry says Reuters
- Two Palestinians killed by illegal Israeli settlers in occupied West Bank TRT World
- West Bank Villages Hit by Deadly Settler Raids Amid Regional Tension
Continue Reading
-

Oil and gas prices rise rapidly as Iran war escalates
NEW YORK (AP) — The price of oil surged higher and showed no signs of halting its rapid climb a week after the U.S. and Israel launched major attacks on Iran that escalated into a war in the Middle East.
The conflict, in which nearly every country in the Middle East has sustained damage from missiles or drone strikes, has left ships that carry roughly 20 million barrels of oil a day stranded in the Persian Gulf, unable to safely pass through the Strait of Hormuz, the narrow mouth of the Gulf that is bordered on its north side by Iran.
The shipping disruption and damage to key Middle East oil and gas facilities has interrupted supplies from some of the world’s largest oil producers. Kuwait, for example, said on Saturday that it would reduce its oil production as a “precautionary” measure due to the war, which could jolt global energy markets even further.
READ MORE: Experts analyze what the Iran war could mean for U.S. gasoline prices
Oil prices surpassed $90 a barrel Friday, with American crude settling at $90.90, up 36% from a week ago, and Brent, the international standard, climbing 27% over the course of the week to land at $92.69.
The fallout is ratcheting up what consumers and business will pay for gasoline, diesel and jet fuel, with some drivers already feeling it at the pump.
“It’s crazy. It’s not needed, especially at a time when people are already struggling, but not unexpected from all this turmoil that’s going on,” said Mark Doran, who was pumping gas in Middlebury, Vermont Friday. “I don’t think there’s been an end in sight to any Middle East conflict that’s been started by us, so the fact that they say that there’s going to be an end that quickly is not believable, and the Middle East is, you know, a place that the U.S. is not going to solve.”
President Donald Trump said Monday that the U.S. expected its military operations against Iran to last four to five weeks but has “the capability to go far longer.” On Friday, Trump appeared to rule out talks with Iran absent its “unconditional surrender.”
“The more news we get, the more it seems like this is going to last a really long time,” said Al Salazar, head of macro oil and gas research at Enverus.
READ MORE: The U.S. economy is already unsteady. A war in Iran could add to that uncertainty
In the U.S., a gallon of regular gasoline rose to $3.41 on Saturday, up about 43 cents from a week ago, according to AAA motor club. Diesel was selling for $4.51 a gallon Saturday, up about 75 cents from last week.
The price shocks were felt even more heavily in Europe and Asia, markets that rely more heavily on energy supplies from the Middle East. Diesel prices doubled in Europe, and jet fuel prices rose by close to 200% in Asia, according to Claudio Galimberti, chief economist at Rystad Energy.
Energy prices climbed throughout the week as Iran launched a series of retaliatory attacks, including a drone strike on the U.S. Embassy in Saudi Arabia, and the conflict widened. Iran also hit a major refinery in Saudi Arabia and a liquefied natural gas (LNG) facility in Qatar, halting flows of refined products and taking about 20% of the world’s LNG supply offline.
“We keep seeing news of vessels being hit or refineries or pipelines, so the list is very long,” Galimberti said. As a result, roughly 9 million barrels of oil per day are off the market because of facilities being hit or producers taking precautionary measures, he said. “Right now, with all of this shut in, we are in a situation of extreme deficit.”
The U.S. is a net exporter of oil, but that does not mean it is immune to increases in the price of oil or gasoline, or that its producers can just make up the difference.
READ MORE: U.S. stocks rebound from sharp losses, while oil prices leap on worries about Iran war
Oil is traded on global markets, so even the oil produced in the U.S. has risen in price based on what’s happening in the Middle East. And for many American oil producers, “if you put more wells in the ground, there’s about a six-month lag before you get that production uplift,” Salazar said.
In addition, the U.S. can’t simply turn all of its crude oil into gasoline. That’s because most of the oil produced in the U.S. is light, sweet crude, and refineries on the East and West coasts are primarily designed to process heavier, sour crude. As a result, the U.S. exports some of its crude oil and imports some refined products such as gasoline.
Jerry Dalpiaz of Covington, Louisiana, said he started filling up his cars and gas cans on “the day that they announced that the United States has started military operations against Iran” because he assumed gas prices would climb.
“I can weather the storm because I’m in good financial position, but I feel sorry for my fellow citizens who are living paycheck to paycheck because they have to drive to get to work and they have to change their oil and all those things,” Dalpiaz said. “And they need some relief and it doesn’t seem to be coming anytime soon.”
Trump issued a plan Friday to insure losses up to approximately $20 billion in the Gulf region, aiming to restore confidence in maritime trade, help stabilize international commerce and support American and allied businesses operating in the Middle East.
LIVE UPDATES: Trump says Iran war could last weeks
But some energy experts said extra insurance won’t solve the problem.
“The problem is that in the oil trading, oil shipping world, people are worried about counterterrorism,” said Amy Jaffe, director of the Energy, Climate Justice and Sustainability Lab at New York University, adding that they’re worried about automated drone speedboats, weapon-carrying, flying drones and mines or other devices. “In order for the United States to create the atmosphere that undoes the current bottleneck at the Strait of Hormuz, there has to be some credible demonstration of solutions to the counter-terrorism problem.”
Salazar wondered what the “new normal” would look like if the Strait of Hormuz was effectively re-opened, and what effective security would look like.
“All it takes is one individual with a RPG (rocket-propelled grenade) to stand on the shore and take out a tanker, right?” Salazar said. “And this is forever, do you know what I mean?”
___
Associated Press journalists Amanda Swinhart in Middlebury, Vermont, Stephen Smith in Covington, Louisiana, Josef Federman in Jerusalem and Stan Choe and Wyatte Grantham-Philips in New York contributed to this report.
A free press is a cornerstone of a healthy democracy.
Support trusted journalism and civil dialogue.
Continue Reading
-
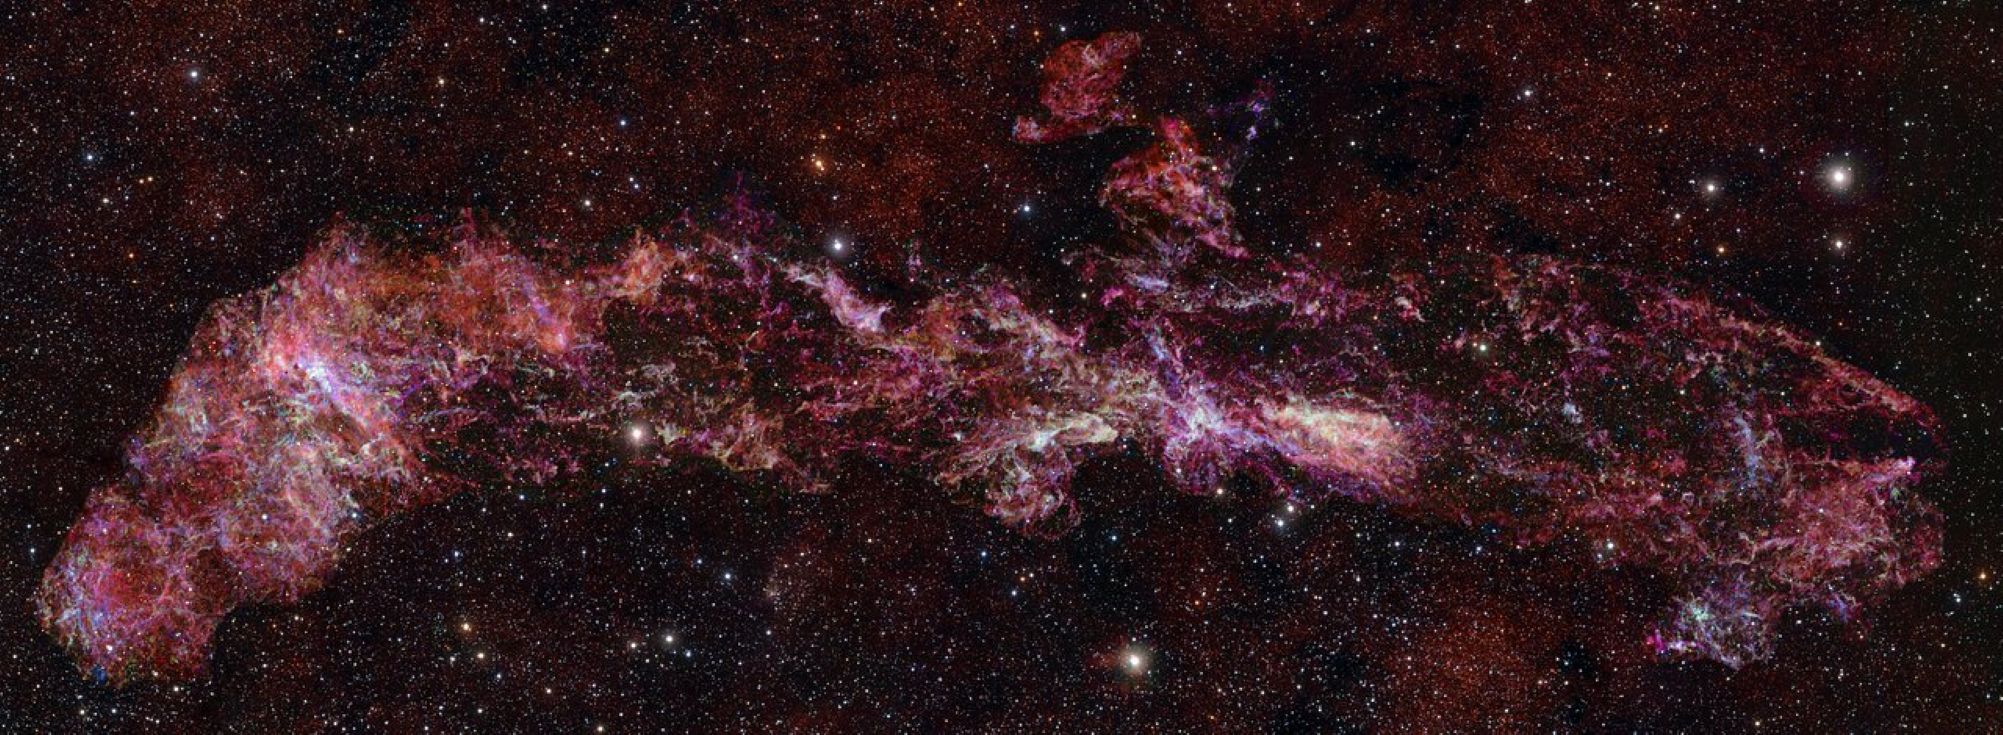
The Milky Way’s center is hiding exotic chemistry, and ALMA just revealed it
Astronomers have just unveiled a breathtaking new view of the very center of our galaxy, the Milky Way. Using the Atacama Large Millimeter/submillimeter Array (ALMA) in Chile’s Atacama Desert, they stitched together the largest ALMA image ever…
Continue Reading
-

Caitlin Clark set for Team USA debut after 8-month injury layoff
Caitlin Clark is excited to make her U.S. national team debut next week when the Americans play in the FIBA World Cup qualifier in Puerto Rico.
It will be Clark’s first game play in about eight months since a multitude of injuries derailed her…
Continue Reading
-

Shrinking weapon stockpiles and regime-change uncertainty: doubts shadow US-Israel war on Iran | US-Israel war on Iran
US government reviews of the war in Iran show that the Trump administration may be ill-equipped for a regime-change war, according to reports.
The Washington Post reported on Saturday morning that a classified intelligence review found that the…
Continue Reading