
This week’s newsletter idea stemmed from where all good ideas stem from – procrastinating while on a deadline. All it took was for one person to reveal what was on their Vinted Favourites list and suddenly everyone was whipping out phones to…


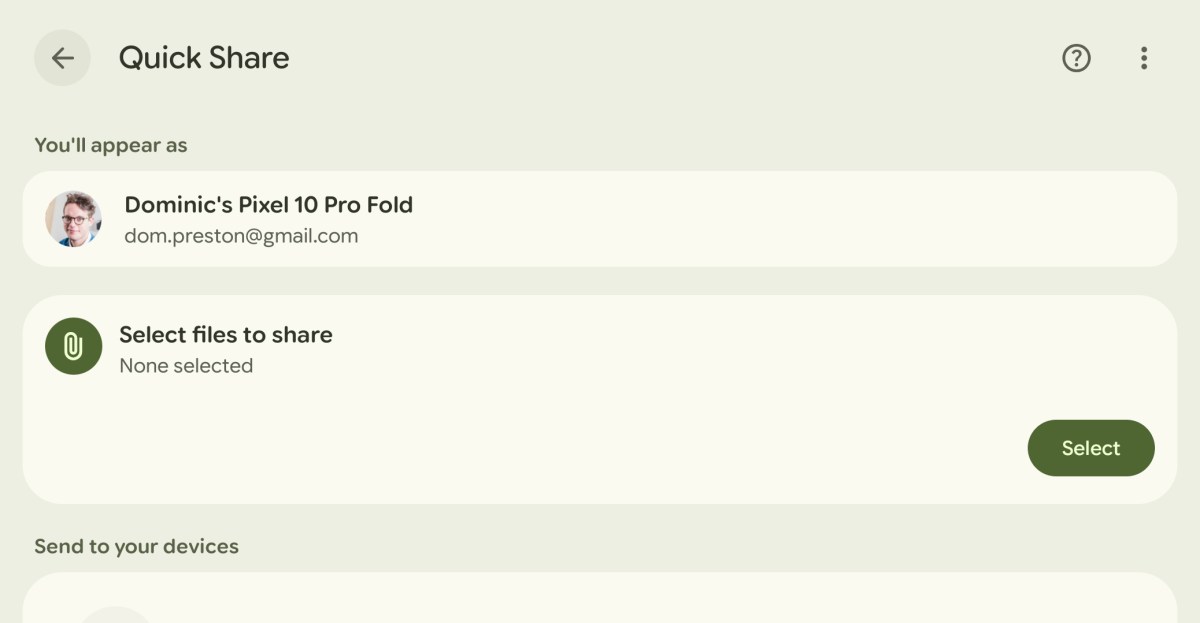
Google’s AirDrop workaround is doing something screwy with Wi-Fi.
Follow…