Apple has partnered with Japanese fashion house ISSEY MIYAKE to launch a new accessory dubbed “iPhone Pocket”, a 3D-knitted, pleated case that blends fashion and function.
Inspired by ISSEY MIYAKE’s design philosophy of “a piece…

Apple has partnered with Japanese fashion house ISSEY MIYAKE to launch a new accessory dubbed “iPhone Pocket”, a 3D-knitted, pleated case that blends fashion and function.
Inspired by ISSEY MIYAKE’s design philosophy of “a piece…

RM of…
Nexon was one of the first game developers to adopt the free-to-play business model in the 1990s. While players can play these games for free, they are incentivized to spend money on in-game items that unlock character cosmetics or…

A health worker prepares to administer a vaccine at a vaccination center in Mexico City, capital of Mexico, Nov. 12, 2025. Mexico City has set up a vaccination center offering influenza, COVID-19, pneumococcal and measles vaccines to the public…

A health worker prepares to administer a vaccine at a vaccination center in Mexico City, capital of Mexico, Nov. 12, 2025. Mexico City has set up a vaccination center offering influenza, COVID-19, pneumococcal and measles vaccines to the public…

A health worker prepares to administer a vaccine at a vaccination center in Mexico City, capital of Mexico, Nov. 12, 2025. Mexico City has set up a vaccination center offering influenza, COVID-19, pneumococcal and measles vaccines to the public…
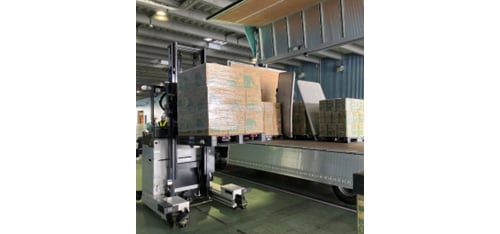
Demonstration testing at Kirin Group Logistics’ Nishi-Nagoya facility
Tokyo, November 13, 2025 – Mitsubishi Heavy Industries, Ltd. (MHI) completed a joint demonstration with Kirin Beverage Co., Ltd. and Kirin Group Logistics Co., Ltd. to establish the elemental technologies for automation of inbound and outbound warehouse operations at beverage warehouses, and truck loading and unloading. Going forward, the companies will pursue further development and verification with the aim of practical application.
The joint demonstration, begun in August 2024, was conducted at LogiQ X Lab, a demonstration facility located within Yokohama Hardtech Hub (YHH), MHI’s co-creation space in Honmoku, Yokohama, and at Kirin Group Logistics’ Nishi-Nagoya facility and other sites.(Note1)
For this joint demonstration, MHI utilized a new type of unmanned forklift that is currently under development equipped with ΣSynX (Sigma Syncs)(Note2), part of the “Smart Connections” solutions incorporating ΣSynX technology. The demonstration tests aimed to establish elemental technologies to enable flexible autonomous operation and safe human-machine coordination, including appropriate load assortment in warehouse work, altering of operational routes in response to changes in placement locations and storage conditions, and highly efficient storage methods.
Through this joint demonstration, MHI has established the processes for future automation of the entire cargo handling process, including unloading of trucks, warehouse handling, and loading onto trucks, and was able to verify the effectiveness of these processes at actual logistics facilities.
MHI categorized routine logistics warehouse work, which up to now has been conducted safely and efficiently through the expertise, experience and skill of operators, into the three areas of picking, inbound and outbound processes, and the loading and unloading of trucks, and progressively implemented measures incorporating ΣSynX for automation and intelligence. An automated picking solution for cargo handling inside the warehouse was put into operation in December 2024 at Kirin Group’s Ebina Logistics Center in Kanagawa Prefecture.(Note3) Based on the results of this joint demonstration, MHI will continue to work to enhance the scalability of its “Smart Connections” solutions in all areas of logistics and warehouse operations.
Going forward, MHI will continue to contribute to society by more deeply developing “Smart Connections” solutions incorporating ΣSynX to address the various issues facing the logistics industry, including the shortage of logistics operators, improvement in working conditions, and the challenges posed by regulatory changes implemented in 2024 aimed at reducing working hours and waiting times for truck drivers.
Overview of the Joint Demonstration
■ Period
August 1, 2024, to September 30, 2025
■ Demonstration sites
(MHI)
LogiQ X Lab demonstration facility at Yokohama Hardtech Hub (YHH)
Demonstration facility at Kobe Shipyard
(Kirin Group Logistics)
Nishi-Nagoya facility
■ Demonstration content

“Smart Connections” solutions incorporating ΣSynX

Natural gas has long been promoted by power suppliers as Thailand’s reliable, affordable, and cleaner alternative to coal. Over the past two decades, it has become the backbone of the national power system, supplying nearly two-thirds of the country’s electricity. Yet this dominance has come at a growing cost.
Today, the assumptions that power companies once used to justify expanding gas power no longer hold true. Domestic gas reserves are declining, import dependence is rising, and gas-fired electricity is becoming more expensive than renewable alternatives. Moreover, the supposed climate benefits of gas are eroded by methane emissions.
Thailand’s operating and planned gas power plants release large volumes of toxic air pollutants — 30.5 kilotonnes (kt) of nitrogen oxides (NOX), 1.4 kt of sulphur dioxide (SO2), and 1.1 kt of fine particulate matter (PM2.5) every year, once the planned plants are in operation. The majority of these gas plants are clustered around Bangkok, a densely populated city that suffers from major air quality issues, and the Eastern Economic Corridor, exposing millions of people to harmful air pollution.
The NOX emissions from Thailand’s gas power plants exceed the combined emissions from buses, motorcycles, and taxis in Bangkok Metropolitan Region (25.9 kt).
This briefing presents new evidence on the scale and distribution of pollutant emissions from Thailand’s gas power stations, revealing how the country’s reliance on gas undermines both clean air and energy security.
Figure 4 – Comparison of total pollutant emissions (NOX, SO2, PM2.5) from gas power plants estimated in this study, and a comparison to other notable sources, including nationwide biomass burning, as well as transportation in Bangkok Metropolitan Region (BMR) taken from Aung et al. (2025)
Money in different currency bills – U.S. Dollar, Chinese Renminbi Yuan, Japanese Yen, European Euro
Alex Segre | Moment | Getty Images
The yen wallowed near a record low versus the euro and a nine-month trough to the dollar Thursday after Japan’s new premier said she wants the central bank to go slow on interest rate hikes.
The Aussie dollar climbed to a two-week high after official data showed a larger decline in the unemployment rate than economists had forecast, lessening the impetus for rate cuts.
Currency markets could face some volatility over coming days with the prolonged U.S. government shutdown likely to end soon, triggering the release of a backlog of economic data. However, the White House said on Wednesday that jobs and consumer price figures for October may never be released.
The yen was little changed at 179.32 per euro in the Asian morning, after dipping to an unprecedented 179.47 overnight. It was steady at 154.82 per dollar, following its decline to the lowest since early February at 155.05 on Wednesday, crossing the psychological 155 mark.
The euro eased 0.1% to $1.1582.
Japanese Prime Minister Sanae Takaichi on Wednesday expressed her administration’s preference for interest rates to stay low and asked for close coordination with the Bank of Japan.
She also has asked BOJ Governor Kazuo Ueda to report regularly to the government’s Council on Economic and Fiscal Policy.
Meanwhile, Japanese Finance Minister Satsuki Katayama gave a new verbal warning on yen weakness as it approached 155 per dollar on Wednesday, noting “one-sided and rapid movements in the foreign exchange market.”
A weak yen could force the BOJ’s hand, leading to a hike next month. Traders see a 24% chance of a quarter-point increase to the key rate in December, rising to 46% odds for a hike by January.
“The yen’s weakness…is likely making the government increasingly nervous,” said Norihiro Yamaguchi, an economist at Oxford Economics.
“The exchange rate is crucial to the survival of the administration,” he said. “To mitigate yen weakness, the government has to accept the Bank of Japan’s rate hikes in the end.”
In Australia, traders lay 16% odds for a quarter-point rate cut in December, following some solid economic data this week that reduced the likelihood of easier policy in the near term.
Thursday’s figures showed employment jumped in October as firms took on more full-time workers, pulling the jobless rate down from a four-year high and calming fears the labor market was slowing sharply.
A top Australian central banker said on Wednesday there was increasing debate about whether the current cash rate of 3.6% is restrictive enough to keep inflation in check, adding that the question is critical for the policy outlook.
The Aussie gained 0.3% to $0.6559 on Thursday, and earlier touched $0.6563, the strongest level since October 30.
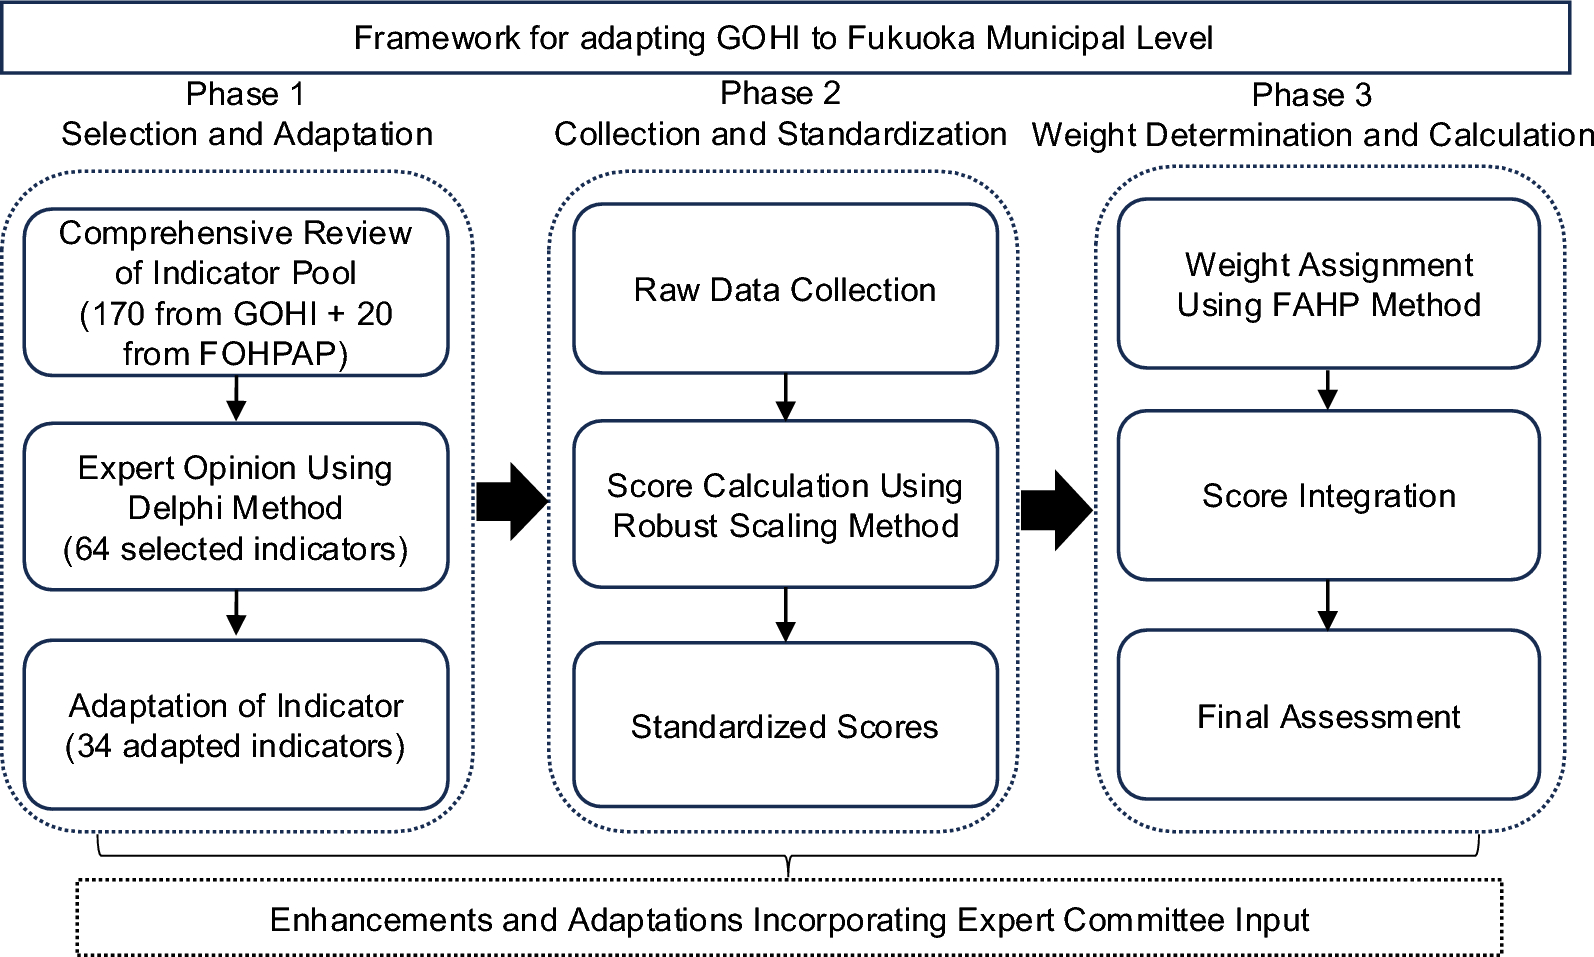
The research design framework of adapting GOHI to Fukuoka municipal level for constructing FOHI consists of three phases: Phase 1 (Indicator Selection & Adaptation), Phase 2 (Data Collection & Score Standardization), and Phase 3 (Weight Determination & Score Calculation) (Fig. 1).
Flowchart of GOHI Adaptation for Construction of FOHI. GOHI Global One Health Index, FOHPAP Fukuoka One Health Promotion Action Plan, FAHP Fuzzy Analytic Hierarchy Process
In Phase 1, we began with a thorough review and analysis of the comprehensive pool of both GOHI 170 sub-indicators and 20 measurable indicators from FOHPAP [13,14,15, 25]. The GOHI sub-indicators were evaluated based on selection criteria (Table 1). Data and information were thoroughly searched, reviewed, and assessed from the following sources: e-Stat (Comprehensive portal site for Japan government statistics), FOHPAP, Fukuoka Prefectural One Health portal site, Fukuoka One Health Official Annual Reports, Fukuoka Prefecture website, and Fukuoka Prefecture open data site. [25, 33,34,35,36,37].
The initial selection of potentially suitable indicators was made from the GOHI and FOHPAP indicator pool. Indicators were finally determined from these initially selected indicators based on multiple expert consultations and validation using the Delphi method, which is a structured forecasting technique that gathers expert opinions, refining responses iteratively to achieve consensus [38].
In Phase 2, we collected data from the sources listed in Table 2. Most indicators were derived from national and Fukuoka Prefectural Official databases, supplemented by internal data obtained from the Fukuoka Prefectural Office.
The collected data for each indicator underwent rigorous standardization using the robust scaling method to address the heterogeneous nature of municipal-level data and potential outliers [53, 54]. This initial transformation centers the data around the median and scales it based on the interquartile range. The data was then linearly re-scaled to a uniform 0–100 scale for score standardization, while maintaining the relative relationships between municipalities.
Only two indicators had missing values. For the indicator A1.2 in Table 6, there are 32 water quality data monitoring points in 17 municipalities in Fukuoka prefecture. Therefore, the mean value from these 17 municipalities were imputed for missing in the remaining 43 municipalities. For the indicator C5.3 in Table 6, there are only 12 municipal observational monitoring sites. Therefore, the same imputation method as the indicator A1.2 was used for the indicator C5.3.
The robust scaling method is expressed by Eq. (1):
$$begin{array}{c}{X}_{text{scaled}}=frac{X-{text{median}}left(Xright)}{{text{IQR}}left(Xright)}times 100#end{array}$$
where X represents the original value, median(X) is the median of the indicator across all municipalities, and IQR(X) is the interquartile range. This transformation centers the data and scales it based on the interquartile range, making it less sensitive to extreme values. After this, we designated the highest observation value (ranked first among all 60 municipalities) as the optimal value, and the lowest observation value (ranked last among all municipalities) as the worst value to be standardized. We then linearly re-scaled the standardized data to ensure each indicator’s score falls within a uniform range of 0–100 points. For indicators where higher values indicate poorer performance, we applied reverse scoring after standardization to maintain interpretive consistency, ensuring higher scores uniformly represent better performance across all metrics. We deliberately avoided applying Min–Max normalization directly to the raw data as used in GOHI, as such an approach is susceptible to distortion from extreme outliers [55]. Instead, we first applied robust scaling to reduce the influence of outliers before performing the Min–Max normalization as a second step on the already robust-scaled data. For binary indicators (Yes/No), we assigned scores of 100 and 0 respectively. For ordinal indicators, we applied proportional scoring (e.g., 0, 33.3, 66.7, and 100 for the four levels). For temporal consistency and data reliability, we established 2022 as our baseline year, aligning with the implementation of the FOHPAP. To address missing data points, we conducted multiple imputation procedures using contextually relevant variables identified through rigorous expert consultation processes.
In Phase 3, we determined “weighing” for each 3 categories and 13 key indices using the Fuzzy Analytic Hierarchy Process (FAHP), which incorporates fuzzy logic to handle uncertainty and imprecision in decision-making by using fuzzy pairwise comparisons to derive more reliable priority weights [56]. Equal weights were assigned to the 34 different measurement indicators within the same key indicator, according to the consensus from 23 One Health experts (Table 2). All 23 experts participated in a questionnaire survey which included 23 series of pairwise questions to compare “which of 3 categories and 13 key indices are more important”. Based on the results of each pairwise question, the relative importance of 3 categories and 13 key indices were determined at different hierarchical levels. Results from expert evaluations were systematically collected through repeated pairwise comparisons for each pair of indicators from 23 experts, transforming qualitative judgments into quantitative ratios [57].
To systematically aggregate the binary judgments from all experts, we constructed fuzzy judgment matrices for each hierarchical level. For each pairwise comparison between indicators i and (j), we counted the number of experts who preferred indicator (i) over indicator (j), denoted as ({a}_{ij}). This value could range from 0 to 23, reflecting the strength of collective expert preference. The reciprocal relationship between matrix elements was maintained as ({a}_{ji}) = 23/({a}_{ij}), ensuring mathematical consistency in the preference structure. This approach effectively converted binary judgments into a quantitative framework that captured both the direction and strength of collective expert preferences.
The aggregated judgment matrices were constructed at multiple hierarchical levels: (1) a top-level matrix comparing the three main categories (EDI, IDI, CDI), (2) a matrix for the five key indices within EDI, (3) a matrix for the three key indices within IDI, and (4) a matrix for the five key indices within CDI. For each matrix, we calculated the Consistency Ratio (CR) to verify judgment consistency. The CR values were 0.026, 0.081, 0.068 for the top-level, EDI, and IDI matrices respectively, all well below the strict threshold of 0.1, while the CDI matrix had a CR value of 0.131, which exceeded the stringent standard but remained below the secondary threshold of 0.15. This indicates that expert judgments maintained satisfactory consistency across all hierarchical levels, with most matrices demonstrating high consistency under the rigorous criterion.
The weight vector for each level was calculated using the geometric mean method, which is particularly suitable for fuzzy hierarchical analyses due to its ability to minimize the influence of extreme values and maintain ratio scale properties. For each indicator (i), the weight was calculated as:
$${W}_{i}=frac{{left(prod_{j=1}^{n} {a}_{ij}right)}^{1/n}}{sum_{k=1}^{n} {left(prod_{j=1}^{n} {a}_{kj}right)}^{1/n}}$$
where ({W}_{i}) represents the normalized weight of indicator (i); ({a}_{ij}) represents the fuzzy preference value of indicator (i) over indicator (j) (transformed to a 0–1 scale by dividing by the total number of experts); (n) is the total number of indicators being compared.
This weighting methodology was applied across all hierarchical levels of our assessment framework. For the system component level, the comparisons revealed varying degrees of relative importance. The final One Health performance score for each municipality was calculated through a hierarchical aggregation process that integrates the standardized indicator scores with their corresponding FAHP-derived weights. The calculation follows a bottom-up approach, progressively combining scores from the 34 measurement indicators to 13 main indices, and finally to the three index categories.
$$KI=sum ({X}_{i}times {w}_{i})$$
where ({X}_{i}) represents the standardized score for measurement indicator (i), and ({w}_{i}) represents its corresponding weight derived from the FAHP process. Based on expert recommendations, measurement indicators under the same Key Indicator were assigned equal weights in this study.
The Category scores (CS) are then computed by aggregating their respective Key Indicators:
$$CS=sum (K{I}_{j}times w{k}_{j})$$
where (K{I}_{j}) represents the score of Key Indicator (j), and (w{k}_{j}) represents the weight assigned to that key indicator within its category.
Finally, the overall One Health score (OHS) for each municipality is calculated by combining the three Categories:
$$OHS=(EDItimes {w}_{1})+(IDItimes {w}_{2})+(CDItimes {w}_{3})$$
where EDI, IDI, and CDI represent the scores for the External Drivers Index, Internal Drivers Index, and Core Drivers Index respectively, and w₁, w₂, w₃ represent their corresponding weights in the overall assessment framework. This hierarchical aggregation ensures that the final score reflects both the relative importance of different components and their interconnected relationships within the One Health system.
After calculating One Health scores for 60 municipalities in Fukuoka Prefecture, we employed various statistical methods to analyze the distribution of these scores. Common statistical approaches including descriptive statistics, box plots, and violin plots were utilized to examine the overall level of One Health governance and internal variations across the prefecture. Beyond standard statistical methods, we constructed spatial distribution maps of the scores and created bar charts of the top 20 municipalities in each of the three index categories. These additional analyses enabled a more detailed examination of regional differences, assessed the applicability of our indicator system at the municipal level, and provided scientific evidence for developing strategies to enhance One Health performance throughout Fukuoka Prefecture.
Additionally, we employed Latent Class Analysis (LCA) [58] to identify different One Health performance patterns among 60 municipalities in Fukuoka Prefecture. This analytical approach was guided by our hypothesis that geographically neighboring municipalities might exhibit similar patterns in One Health performance due to various forms of inter-municipal influence, including knowledge sharing, policy diffusion, shared environmental conditions, and collaborative initiatives. We assumed that each municipality belongs to one of n latent classes based on their scoring patterns across the three core indices: EDI, IDI, and CDI. To facilitate the analysis, we categorized the scores of these three core indices into four distinct score groups; “below 40.01,” “40.01–50,” “50.01–60,” and “above 60” as shown in Fig. 2. Using a data-driven approach, LCA determined the number of existing latent classes based on the distribution patterns of municipalities across the three core indices’ score groups. The analysis also calculated the posterior probability of each municipality belonging to each latent class, with the class having the highest posterior probability considered as the municipality’s latent class membership. The optimal number of latent classes was determined by the model with the lowest Bayesian Information Criterion (BIC) value among models containing 2–6 latent classes.

FOHI Scores among 60 municipalities in Fukuoka by Total A, EDI B, IDI C, and CDI D categories. Created based on National Land Numerical Information (Administrative Boundary Data), Ministry of Land, Infrastructure, Transport and Tourism, Japan (https://nlftp.mlit.go.jp/ksj/gml/datalist/KsjTmplt-N03-2025.html), retrieved on November 15, 2024. FOHI Fukuoka One Health Index, EDI External Drivers Index, IDI Internal Drivers Index, CDI Core Drivers Index
All statistical analyses and data visualizations were performed using R software version 4.2.1 (R Foundation for Statistical Computing, Vienna, Austria) [59]. The hierarchical fuzzy analytic hierarchy process (FAHP) was implemented using custom R scripts based on the algorithm described in the method section. Weight calculations, consistency ratio evaluations, and matrix manipulations were performed using the base R functions. For data visualization, the ggplot2 package [60] was utilized to create figures displaying weight distributions and comparative analyses across municipalities.