Vertiv recently announced its gigawatt-scale reference architectures for the NVIDIA Omniverse DSX Blueprint, enabling faster and more flexible AI factory deployments across platforms such as NVIDIA Vera Rubin, and offering solutions like prefabricated, hybrid, and traditional data center builds.
This collaboration features extensive integration of Vertiv’s advanced liquid cooling, power management, and digital twin capabilities, establishing the company as a core enabler of next-generation generative AI infrastructure expansion.
We’ll now examine how Vertiv’s AI infrastructure partnership and innovation could reshape its growth and competitive outlook going forward.
Find companies with promising cash flow potential yet trading below their fair value.
Owning Vertiv Holdings Co means believing in sustained demand for AI-optimized data centers and the company’s ability to deliver integrated power and cooling solutions at scale. The latest NVIDIA-related product launch reinforces Vertiv’s role as an AI infrastructure enabler, likely supporting near-term demand momentum, the main catalyst for the stock, while direct competition and margin pressures from supply chain disruptions remain the primary short-term risks to watch; the overall impact of this announcement on those risks appears limited.
The recent Q3 2025 earnings report stands out, underscoring the same strong AI-driven demand seen in the NVIDIA partnership update. The company’s robust 29% revenue growth and raised full-year sales guidance tie directly into expectations for rapid AI data center expansion, providing useful context for how product innovation and execution remain critical for converting demand into financial results.
However, it is just as important to recognize that, in contrast, margin expansion is still at risk if supply chain and cost inefficiencies persist…
Read the full narrative on Vertiv Holdings Co (it’s free!)
Vertiv Holdings Co’s narrative projects $13.9 billion revenue and $2.3 billion earnings by 2028. This requires 15.2% yearly revenue growth and an increase in earnings of approximately $1.5 billion from the current $812.3 million.
Uncover how Vertiv Holdings Co’s forecasts yield a $173.11 fair value, a 10% downside to its current price.
VRT Community Fair Values as at Nov 2025
Simply Wall St Community members estimate Vertiv’s fair value between US$123.78 and US$177.94, with 12 individual views represented. This diversity comes as global demand for AI data centers accelerates, but execution and competitive pressure could shape very different outcomes, review their opinions to see every angle.
Explore 12 other fair value estimates on Vertiv Holdings Co – why the stock might be worth 36% less than the current price!
Disagree with existing narratives? Create your own in under 3 minutes – extraordinary investment returns rarely come from following the herd.
Right now could be the best entry point. These picks are fresh from our daily scans. Don’t delay:
This article by Simply Wall St is general in nature. We provide commentary based on historical data and analyst forecasts only using an unbiased methodology and our articles are not intended to be financial advice. It does not constitute a recommendation to buy or sell any stock, and does not take account of your objectives, or your financial situation. We aim to bring you long-term focused analysis driven by fundamental data. Note that our analysis may not factor in the latest price-sensitive company announcements or qualitative material. Simply Wall St has no position in any stocks mentioned.
Companies discussed in this article include VRT.
Have feedback on this article? Concerned about the content? Get in touch with us directly. Alternatively, email editorial-team@simplywallst.com
After two intense months of back-to-back tests during China’s “Golden September and Silver October” retail peak, local fashion players are redefining how to balance globalization and localization, narrative and conversion.
The End of the Scale Myth
For much of the past decade, China’s apparel industry has been dominated by a “scale-first” mentality. Speed was the weapon; size, the defense. Brands raced to expand through new stores and soaring stock keeping units — using quantity as the main measure of success.
That strategy worked in an era of rapid economic growth. But as China’s market matures and competition shifts from expansion to retention, the marginal benefits of scale have sharply declined. Digitalization has also transformed the landscape: in an age of endless scrolling and information overload, attention has become the rarest currency.
To hold that attention — and convert it — brands have moved beyond pure product play, embracing aesthetics, culture, and ideology. Fashion weeks have emerged as the ultimate stage for that expression: a place where high-end image building meets global dialogue. Yet once the applause fades, brands must return to the commercial frontlines — livestream rooms, social commerce platforms, and Singles’ Day.
This season, many of China’s rising stars did exactly that — flying from Paris back to Shanghai overnight, shifting seamlessly from runway storytelling to retail strategy.
Oriental Narratives on the Global Stage
As Chinese brands evolve from chasing scale to shaping meaning, global fashion weeks have become essential to building emotional resonance. But unlike in the past, Chinese designers are no longer just seeking validation abroad — they’re creating cultural conversations that speak to global and local audiences.
Icicle returned to Paris with its spring 2026 Artisan Series, themed “Beyond the Window.” Through fluid fabrics, natural textures, and hues inspired by China’s traditional five-color philosophy, the collection explored the balance between transparency and freedom — a continuation of the brand’s humanist and ecological roots.
A look from Icicle’s spring 2026 collection.
SongMont, the first Chinese luggage label to exhibit at Paris Fashion Week for two consecutive years, translated the spirit of China’s Central Plains into a multisensory experience. Its “Song of Mont” exhibition incorporated heritage stone carvings, architectural silhouettes, and Silk Road-inspired design details — a dialogue between ancient craftsmanship and contemporary form.
Songmont was the first Chinese luggage label to exhibit during Paris Fashion Week in two consecutive years.
For Keigan, founded by a team that includes an architect, the goal was to redefine what a fashion brand can represent. Its Keigan Genius Salon revived the intimate cross-disciplinary gatherings of 18th-century Europe — bringing together designers, artists and cultural figures to explore the intersection of fashion, architecture and art. Following its Paris debut, Keigan opened its first flagship store in a historic building on Shanghai’s West Nanjing Road, symbolizing its commitment to aesthetic co-creation.
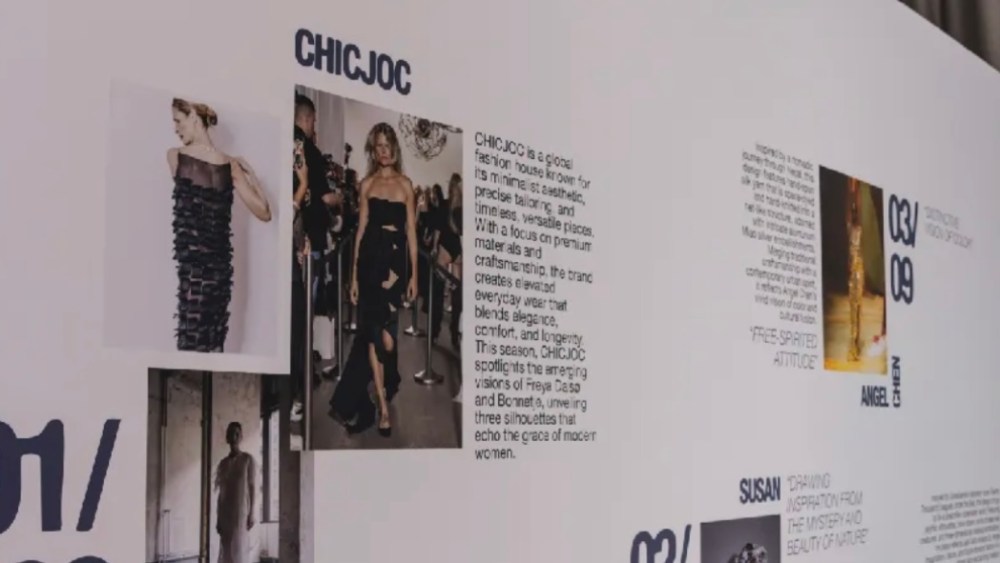
Meanwhile, Chicjoc, through the WWD China Select program, bridged global and Chinese creativity in Milan with “Heritage Next: Glowing Milano.” The exhibition, part of Milan Fashion Week’s official calendar, connected emerging international designers with Chinese retail expertise and consumer insights — transforming cultural exchange into commercial opportunity.
Together, these initiatives revealed a shared ambition: to merge cultural identity with international relevance, and to convert global visibility into sustainable growth back home.
Singles’ Day: From Cultural Symbols to Consumption Power
As the spotlights of global fashion weeks dimmed, a different kind of spotlight came on in China: Singles’ Day. For many brands, it was the next major test of their ability to turn storytelling into sales.
The 2025 Singles’ Day presale began Oct. 15, with down payments starting Oct. 21. Within hours, domestic players dominated key categories. On Tmall, two brands under Anta Group took the top two positions in sports and outdoor sales, surpassing long-time leader Nike. In beauty, Chinese brands such as Chando, Proya and Maogepingalso continued their upward trajectory, outpacing many international names.
For fashion brands returning from global stages, Singles’ Day was more than a shopping festival — it was a test of monetizing cultural momentum. Chicjoc, for example, built on last year’s success, where its live show with Taobao Apparel generated more than 64.2 million yuan (about $9 million) in a single day. This year, the brand partnered again with Taobao Apparel to host the 2.0 Super Fashion Launch, featuring emerging Danish designers Freya Dalsjø and Bonnetje, both part of the WWD China Select program.
Bonnetje founders Anna Myntekær (left) and Yoko Maja Hansen (right).
A New Playbook: From Aesthetics to Conversion
In an era where aesthetics are the ultimate differentiator, brands can no longer rely solely on price or speed. The new formula is a closed loop of aesthetics — engagement — conversion.
Cultural storytelling builds awareness; engagement sustains relevance, and strategic digital integration turns influence into sales. The synergy between fashion weeks and Singles’ Day — between high fashion and high traffic — is becoming the hallmark of China’s next-generation brand strategy.
As the boundaries between global prestige and domestic performance blur, 2026 will likely see deeper integration between international fashion calendars and China’s digital economy. True globalization, after all, means more than showing abroad — it means transforming global fascination with Oriental aesthetics into genuine consumer connection and tangible growth.
Editor’s Note: China Insight is a monthly column from WWD’s sister publication WWD China on trends and developments in that all-important market.
Corcel Exploration (CSE:CRCL,OTCQB:CRLEF) is a Vancouver-based explorer unlocking copper and gold opportunities across North America. Anchored by its flagship Yuma King project in Arizona, the company applies historical datasets, cutting-edge geoscience, and modern technology to uncover and expand near-surface and buried mineralized systems.
Corcel’s approach is centered on disciplined, data-driven exploration. The company’s 2025 work program includes its maiden 2,000-meter diamond drill program, along with IP surveys and hyperspectral mapping to test priority copper-gold skarn and porphyry targets across the Yuma King Mine, Yuma King West, and Three Musketeers zones. By validating and extending historical mineralization, Corcel aims to delineate a near-term resource base while unlocking the broader district-scale potential.
Yuma King property overview
The Yuma King copper-gold project covers a 3,200-hectare district-scale property in the historic Ellsworth mining district of west-central Arizona, approximately 150 km northwest of Phoenix. The property hosts the past-producing Yuma mine, where operations between 1940 and 1963 yielded high-grade copper and gold ore.
Company Highlights
Flagship Yuma King Project (Arizona): District-scale, 3,200-hectare land package with 515 federal mining claims in the historic Ellsworth mining district.
High-grade Historical Production: 8,600 tons averaging 2.3 percent copper, 0.3 oz silver per ton, and 0.03 oz gold per ton from the past-producing Yuma mine.
Dual Mineralization System: Copper-gold skarn mineralization with potential for a buried copper-molybdenum-gold porphyry system.
Strong Recent Results: Rock samples grading up to 17.15 grams per ton gold and 11.6 percent copper, confirming widespread surface mineralization.
Advanced Drill-ready Targets: 1.6 km skarn corridor open along strike and down-dip; multiple untested anomalies from geophysics and soil sampling.
Experienced Leadership: Led by a technically strong management team with deep experience in discovery, development, and capital markets.
Strategic US Positioning: Located near infrastructure and in the same state as one of only three US copper smelters.
When Kiara Morris, an early in career lawyer at MinterEllison, opens a draft of legal advice, she launches Microsoft Copilot alongside. With court dates approaching, she turns to the AI tool to anticipate potential questions from opposing counsel and uncover case examples relevant to her jurisdiction in Western Australia.
“As a junior lawyer, there aren’t a lot of opportunities to get courtroom experience early on,” Morris explains. “With my first appearance coming up, Copilot has helped me think through the kinds of questions I might face. It’s been a huge boost to my confidence and how prepared I feel.”
By mid-morning in MinterEllison’s Sydney office, Jett Potter is usually also working in Copilot, using agents he’s built to help shape briefing decks or review his work. The Lawyer, who is part of the firm’s AI advisory team, will drop an outline into his critique agent and ask it to improve the structure and tone, and pull any relevant research in so he can focus on the argument rather than formatting.
“I rely on it for the majority of my day – more than I use Teams,” he explains. “I’ve created an agent that is designed to think like a top-tier consulting partner, pointing it to content that has been reviewed by Partners and has received positive feedback.
“I can get to the final output faster because I’ve already incorporated multiple rounds of feedback using the agent before sharing it for review,” he said.
Kiara and Jett are among the many young professionals who are using AI as a ‘rehearsal room’, a reviewer and more to accelerate their learning curves.
Embracing high-value work with AI assistance
Morris is using Microsoft Copilot’s Researcher Agent extensively in her role to speed up and deepen the research that she does as a junior lawyer.
“I work in the Infrastructure and Construction team, where I’m often getting my head around complex engineering terminology,” said Morris. “Researcher helps me quickly surface and contextualise technical concepts that aren’t necessarily legal but are important to understanding the client’s requirements.
“It can be targeted at Western Australia specifically, ensuring I can deliver precise, context-appropriate information, making my research process much more thorough and efficient.”
From there, she asks Copilot to probe her drafts from the client’s perspective to identify what’s missing, what questions could be asked and what she’ll need to defend. That way, she can pre-answer those questions before sending the draft up the chain.
“When seniors ask, ‘Have you considered this approach?’, I can say yes, and justify why this is the best path forward. That builds their trust in me,” she says.
Potter, too, is using AI to accelerate his progression towards higher-value work. As part of the AI Advisory team, he uses his skills to build custom agents and design courses the firm can present to clients. He recently scoped a short AI training program with practice leads, grouping common questions into modules and pairing real scenarios with step-by-step prompts.
That work brings him into partner and director discussions earlier, where he is invited to provide perspective on new initiatives and ideas for AI, as well as run demos.
“There’s often a big shift from being a junior doing the administrative work to joining senior employees in thinking strategically about how we work with and what we offer clients. I feel like my early in career peers and I get to do more of that now because leaders are engaging with us for our AI skills.
“We’ve just successfully sold our first AI training program to a client. It’s an idea that I originally proposed to our leadership and took the lead on drafting the supporting documents and prompt guide,” he says. “Using AI made the turnaround fast and didn’t impact my other priorities, while also giving me greater visibility with Partners.”
What’s happening at MinterEllison mirrors a broader trend. In a recent data drop from Microsoft, CTRL+Career, a survey of 500 early-career professionals across Australia and New Zealand found that 80 percent those surveyed feel their AI skills have given them more visibility at work compared to before they started using AI. Meanwhile, 83 percent also say their senior leaders actively seek input or ideas from them on how AI can be used at work.
Improving career prospects by joining senior conversations
Morris, Potter and other younger staff members are now being asked to contribute across the firm as its leaders seek to harness their practical understanding of AI.
“I get opportunities to sit in high-level executive meetings where I’m two or three levels below the next person because they want our perspective on whether a process could be improved using AI,” says Potter.
Morris says MinterEllison offices in Perth and across Australia have been sharing ways of developing day-to-day AI use, with her input. “I’ve had opportunities to share ideas and best practice for rolling out tools and client solutions with senior leadership, in a forum that wasn’t really possible before AI,” she says.
However, despite the broad applications for this developing technology within their sector, both employees are conscious that human input will still be required to ensure all AI output meets the bar. Legal work, in particular, still demands a human at the centre of all client work.
“We have professional obligations not to take information at face value,” says Morris. “Even if AI gives you a small extract from a case, you need to ensure the case as a whole is relevant – and this is the critical step to ensuring you actually learn the content that AI produces. If you’re just copying and pasting, it will get exposed later when seniors test your understanding.”
Learning the content and not just using AI as information retrieval or shortcut remains top of mind for early in career professionals, with the CTRL+Career survey revealing that nearly half feel they don’t learn the content as well as they did before they started using AI. However, the majority (92 percent) feel confident in their ability to critically assess and challenge the AI-generated outputs – Signalling a need to ensure they are taught to use it to enhance critical thinking, not take away from it.
While Potter also acknowledges the need for human checks and balances, he is ultimately convinced that AI literacy has become a non-negotiable for any aspiring employee, whether they are pursuing a career in law or another industry.
“It’s a must. There’s this rumbling in our entire industry, with people asking, ‘Can AI replace my job?’ The way I think about it is that the person using AI will get your job,” he says. “So, you need to jump on the bandwagon. If nothing else, you need to understand how the technology works and how to get the most out of it. It’s not perfect; there are limitations, but you only know that by using it.”
Dr. Emrullah Yilmaz, MD, PhD, has stepped into a pivotal role as Senior Medical Director at Johnson & Johnson, a global leader in healthcare innovation. Announced through his professional network, Dr. Yilmaz shared his excitement for embarking on this new chapter, one that builds on a legacy of excellence in oncology, research, and collaborative medical leadership.
Early Life and Academic Journey
Originally from Turkey, Dr. Yilmaz pursued his formative medical education at Hacettepe University. His commitment to research and patient care was evident from the start, leading him to complete his MD and later earn his PhD focused on advanced oncology topics. His years at Hacettepe University laid the groundwork for his dedication to both scientific inquiry and the practical dimensions of clinical care.
His academic journey continued through rigorous clinical training in both residency and fellowship programs, with posts at celebrated institutions in Turkey and the United States. A decisive move was his entry into cancer research as a postdoctoral scholar and then clinical fellow, honing his focus on head and neck oncology as well as precision medicine. These early years helped shape his philosophy of combining advanced therapeutics with compassionate patient-centered care.
Career and Leadership Roles
Before his recent appointment at Johnson & Johnson, Dr. Yilmaz held progressively senior roles in prestigious healthcare settings across the US. Notably, between 2016 and 2021, he served as Assistant Professor and Co-Leader of the Head & Neck Clinical Working Group at the University of New Mexico, where he developed new protocols for the management and clinical trial design in head and neck cancers.
Joining Cleveland Clinic in 2021, Dr. Yilmaz became Head & Neck Medical Oncologist and then Director of Precision Oncology, further deepening his expertise in integrating genomics and individualized targeted therapy. In these positions, he mentored younger clinicians, influenced national cancer guidelines, and contributed meaningfully to multidisciplinary research teams.
In 2024, his leadership roles expanded at Johnson & Johnson Innovative Medicine, first as Medical Director and subsequently as Senior Medical Director. Dr. Yilmaz now oversees medical strategy and clinical development at one of the world’s leading life sciences giants, where his focus is on translating scientific advances into effective therapies for patients globally.
Research Contributions and Innovation
Dr. Yilmaz is recognized for significant contributions in head and neck oncology, precision medicine, and clinical trials. His research has addressed the molecular basis of cancer, with emphasis on biomarker-driven therapy, improving outcomes in both common and rare tumor types.
He has worked on projects that integrate large-scale genomic profiling into clinical workflows, enabling more personalized and adaptive approaches to cancer treatment. His published work covers topics such as therapeutic sequencing in head and neck cancers, real-world use of targeted drugs, and the application of novel immunotherapies.
Peer-reviewed journal articles authored or co-authored by Dr. Yilmaz appear in publications such as the Journal of Clinical Oncology, CA: Cancer Journal for Clinicians, and Cancer Research. His leadership in multi-institutional studies and advisory roles for pharmaceutical innovation highlight a commitment to data-driven and evidence-based advancement in oncology.
Recognition and Awards of Emrullah Yilmaz
Dr. Yilmaz’s career trajectory is marked by multiple honors reflecting his dedication to clinical excellence and scientific advancement. He has received distinguished awards for his work in translational oncology and clinical trial innovation, although specific public awards are not overtly shared in social media profiles. His reputation among colleagues is evidenced by invitations to speak at international congresses and serve on expert panels within organizations such as the American Society of Clinical Oncology.
A New Chapter at Johnson & Johnson
Dr. Yilmaz’s recent announcement made via Linkedln reflects both a sense of accomplishment and forward-looking vision:
“I’m happy to share that I’m starting a new position as Senior Medical Director at Johnson & Johnson!”
In this capacity, Dr. Yilmaz will lead teams focused on the global development of novel cancer therapies, mentor clinical scientists, and support partnership building across research networks. His appointment affirms Johnson & Johnson’s ongoing commitment to advancing medical science through expert leadership and international collaboration.
Looking Ahead
With Dr. Emrullah Yilmaz’s appointment, Johnson & Johnson further strengthens its position as an industry leader in the creation and dissemination of life-saving therapies. Dr. Yilmaz’s unique blend of medical expertise, research rigor, and visionary leadership aligns perfectly with the company’s mission to improve health outcomes for patients worldwide.
His journey—from a dedicated young clinician-researcher in Turkey to senior roles spanning top US academic medical centers, culminating in a key directorial position at Johnson & Johnson—serves as inspiration to the next generation of clinicians and scientists. Dr. Yilmaz continues to exemplify the ideals of innovation, patient-centered care, and global impact in medical oncology.
The Australian market is showing resilience, with shares moving towards a modest gain despite volatility in global indices. As investors navigate these shifting conditions, penny stocks remain an intriguing area of interest. Although the term may seem outdated, it still represents smaller or less-established companies that can offer potential value. By focusing on those with strong financials and growth potential, investors might uncover promising opportunities among these lesser-known stocks.
Name
Share Price
Market Cap
Financial Health Rating
Alfabs Australia (ASX:AAL)
A$0.49
A$140.43M
★★★★★☆
EZZ Life Science Holdings (ASX:EZZ)
A$2.25
A$106.14M
★★★★★★
Dusk Group (ASX:DSK)
A$0.895
A$55.73M
★★★★★★
IVE Group (ASX:IGL)
A$2.79
A$428.8M
★★★★★☆
MotorCycle Holdings (ASX:MTO)
A$3.77
A$278.25M
★★★★★★
Pureprofile (ASX:PPL)
A$0.048
A$56.15M
★★★★★★
West African Resources (ASX:WAF)
A$3.04
A$3.47B
★★★★★★
LaserBond (ASX:LBL)
A$0.53
A$62.59M
★★★★★★
Service Stream (ASX:SSM)
A$2.27
A$1.39B
★★★★★★
Fleetwood (ASX:FWD)
A$2.95
A$272.39M
★★★★★★
Click here to see the full list of 418 stocks from our ASX Penny Stocks screener.
Let’s review some notable picks from our screened stocks.
Simply Wall St Financial Health Rating: ★★★★☆☆
Overview: DevEx Resources Limited, along with its subsidiaries, focuses on the exploration and evaluation of mineral properties in Australia, with a market cap of A$61.84 million.
Operations: The company’s revenue segment is derived from Exploration and Evaluation, amounting to A$0.36 million.
Market Cap: A$61.84M
DevEx Resources is a pre-revenue company with a market cap of A$61.84 million, focusing on mineral exploration in Australia. Despite having no debt and short-term assets of A$7.4 million exceeding both its short and long-term liabilities, the company faces financial challenges with less than a year of cash runway and ongoing unprofitability. Recent earnings reports show a net loss reduction to A$9.11 million for the year ended June 2025, yet auditors have expressed concerns about its ability to continue as a going concern. The management team is experienced but must navigate these financial hurdles carefully.
ASX:DEV Financial Position Analysis as at Nov 2025
Simply Wall St Financial Health Rating: ★★★★★★
Overview: GR Engineering Services Limited offers engineering, process control, automation, and construction services to the mining and mineral processing industries globally, with a market cap of A$613.49 million.
Operations: The company’s revenue is derived from two main segments: Oil and Gas, contributing A$95.93 million, and Mineral Processing, which accounts for A$383.09 million.
Market Cap: A$613.49M
GR Engineering Services, with a market cap of A$613.49 million, has demonstrated steady financial performance. The company reported sales of A$479.02 million for the year ended June 2025, an increase from the previous year, and net income rose to A$34.21 million. Despite a dividend yield of 6.56% that is not well covered by earnings or free cash flows, GR Engineering remains debt-free and maintains high-quality earnings with no shareholder dilution over the past year. Its short-term assets comfortably cover both short and long-term liabilities, reflecting robust financial health amid stable market conditions.
ASX:GNG Debt to Equity History and Analysis as at Nov 2025
Simply Wall St Financial Health Rating: ★★★★☆☆
Overview: Navigator Global Investments (ASX:NGI), operating as HFA Holdings Limited, is a fund management company based in Australia with a market capitalization of A$1.22 billion.
Operations: Navigator Global Investments generates revenue primarily through its Lighthouse segment, which accounts for $122.84 million.
Market Cap: A$1.22B
Navigator Global Investments has shown robust financial performance, with revenue growing to US$365.79 million and net income reaching US$119.36 million for the year ended June 2025. Despite a significant one-off gain of A$29.6 million impacting results, the company maintains high-quality earnings and has not diluted shareholders recently. With more cash than debt and stable weekly volatility, its financial stability is evident; however, short-term liabilities exceed short-term assets slightly. The upcoming leadership transition may influence strategic direction as Roger Davis prepares to assume the Chairmanship following Michael Shepherd’s retirement in November 2025.
ASX:NGI Financial Position Analysis as at Nov 2025
This article by Simply Wall St is general in nature. We provide commentary based on historical data and analyst forecasts only using an unbiased methodology and our articles are not intended to be financial advice. It does not constitute a recommendation to buy or sell any stock, and does not take account of your objectives, or your financial situation. We aim to bring you long-term focused analysis driven by fundamental data. Note that our analysis may not factor in the latest price-sensitive company announcements or qualitative material. Simply Wall St has no position in any stocks mentioned.
Companies discussed in this article include ASX:DEV ASX:GNG and ASX:NGI.
This article was originally published by Simply Wall St.
Have feedback on this article? Concerned about the content? Get in touch with us directly. Alternatively, email editorial-team@simplywallst.com
A small business owner is preparing to face down the cosmetics giant L’Oréal at a tribunal next week over a trademark dispute she says has had a devastating impact on her.
Rebecca Dowdeswell, 49, from Nottinghamshire, has been locked in a three-year legal battle with the French company since it claimed her use of the name nkd for her business would cause “consumer confusion” with its own range of Naked beauty products.
Dowdeswell has been forced to close one of her two nkd salons and has run up legal fees of more than £30,000 ($39,500) fighting the £170 billion company, which has instructed top-tier law firm Baker McKenzie.
Before the intellectual property office tribunal on Wednesday, she said, “There’s never been any question or any evidence of any consumer confusion. From my perspective, we operate in very different sections of the beauty market. I only have an interest in waxing and hair removal.
“My three products I’ve launched under the nkd name are tied to hair removal aftercare, whereas they only use the Naked brand name against a handful of eyeshadow palettes and then a few other items of very specific makeup.
“And then the two brand names are spelt and pronounced differently, so I’ve always been pronounced ‘n-k-d’, they’ve always been ‘naked.’”
Dowdeswell launched her business in 2009, a year before L’Oréal launched its first Naked product in the UK, she said.
Her trademark expired in 2019, at which point she said she had a six-month window to automatically renew it but forgot to because of Covid, for which she said, “I fully hold my hands up.” When she got round to renewing in 2022, L’Oréal objected.
“We had already by then coexisted for over 12 years,” said Dowdeswell. “For a large company, £30,000 plus in legal fees is not a lot of money but to a very small business like mine it’s been really devastating. And the bigger impact has been the drain on my resources and the distraction that this has been to me, the drain on my time, my energy, my focus.”
She said it was the need to focus on the case that made her shut down her original — and biggest — salon in Nottingham at the end of 2023.
Dowdeswell did receive some good news earlier this week when L’Oréal reduced the scope of its objection, which means her remaining salon, in Leicester, will not need to be renamed and she can use the nkd brand for some beauty services and products.
But the two sides remain in dispute over other issues and she said the company’s late concession was in keeping with a “deliberate strategy to grind me down, to waste my legal expenses and to hope that this never gets as far as the hearing.
“I just feel really angry that nobody has held L’Oréal to account. And I really, really hope that they do get held to account on Wednesday.”
A L’Oréal spokesperson said, “Since 2022 L’Oréal’s position has never changed or been updated. We have always been willing to work with Rebecca Dowdeswell to support her business aspirations whilst respecting our longstanding trademark rights.
“The proceedings are still ongoing and we remain wholly committed to resolving this matter in a mutually agreeable way.”
By Haroon Siddique
Learn more:
L’Oréal to Acquire Kering Beauty Portfolio for $4.6 Billion
The companies announced on Sunday that L’Oréal will acquire Kering’s beauty brands and licenses for its fashion house names, including Gucci.
Abhotel (TSE:6565) posted a net profit margin of 24.6% for the year, up from 23.4% last year, with earnings growing 17.9% year-over-year. Over the past five years, annual earnings growth averaged 42.7%. Shares currently trade at ¥1,751, just above their estimated fair value of ¥1,745.32. The stock’s valuation remains favorable compared to the broader Japanese hospitality industry’s high price-to-earnings ratios.
See our full analysis for Abhotel.
The next section will put these headline results side by side with the leading narratives in the market. This will highlight where expectations were met and where surprises may drive new investor debate.
Curious how numbers become stories that shape markets? Explore Community Narratives
TSE:6565 Earnings & Revenue History as at Nov 2025
Abhotel reported a five-year average annual earnings growth of 42.7%, which far surpasses typical industry rates. However, the most recent year’s growth came in at 17.9%, showing a notable moderation versus its longer-term trend.
The prevailing market view weighs this shift in momentum. Investors are watching closely to see if this year’s deceleration is a simple pause or hints at a maturing growth story.
While such high multi-year earnings expansion strongly supports the argument that Abhotel still holds upside potential in a recovering travel market, the drop from the five-year average to the latest 17.9% figure creates tension about whether outsized growth is sustainable as the company scales.
Robust expansion has set a high bar, and demand tailwinds offer support, yet the sharp slowdown in this year’s growth will rightly focus attention on the company’s ability to drive further margin gains or unlock new segment performance.
Net profit margin increased to 24.6% in the latest period, a meaningful lift from last year’s 23.4%, as the company bucked stagnant sector trends and further widened its operational cushion.
According to the prevailing market view, margin resilience is a crucial differentiator in the hospitality sector, especially when most peers face inflation headwinds or cyclical cost pressures.
Higher profitability relative to the broader industry underlines bullish arguments that Abhotel benefits from strong cost controls and a nimble operational playbook.
Bulls will need to see ongoing margin improvement, rather than a one-off jump, to confidently price in long-term competitive advantages.
With a price-to-earnings ratio of 8.7x, Abhotel trades in line with similar peers and at a significant discount to the broader Japanese hospitality industry, which averages 23.1x. Its share price of ¥1,751 sits only slightly above the DCF fair value of ¥1,745.32.
The prevailing market view suggests this relative discount amplifies Abhotel’s appeal for value-seeking investors.
Well-above-sector-average profit margins combined with a modest valuation multiple challenge the idea that all hotel operators are equally exposed to cyclical swings, a stance seen in some more cautious perspectives.
As long as Abhotel sustains its margin gains without chasing valuation premiums, the current share price offers what many would consider a favorable risk-reward setup.
Don’t just look at this quarter; the real story is in the long-term trend. We’ve done an in-depth analysis on Abhotel’s growth and its valuation to see if today’s price is a bargain. Add the company to your watchlist or portfolio now so you don’t miss the next big move.
Abhotel’s impressive multi-year growth has slowed sharply this year, raising questions about whether the company’s rapid momentum can be sustained going forward.
If stable performance matters most to you, check out stable growth stocks screener (2087 results) to discover companies that consistently deliver reliable earnings and smoother long-term growth trajectories.
This article by Simply Wall St is general in nature. We provide commentary based on historical data and analyst forecasts only using an unbiased methodology and our articles are not intended to be financial advice. It does not constitute a recommendation to buy or sell any stock, and does not take account of your objectives, or your financial situation. We aim to bring you long-term focused analysis driven by fundamental data. Note that our analysis may not factor in the latest price-sensitive company announcements or qualitative material. Simply Wall St has no position in any stocks mentioned.
Companies discussed in this article include 6565.T.
Have feedback on this article? Concerned about the content? Get in touch with us directly. Alternatively, email editorial-team@simplywallst.com
Zurletrectinib (ICP-723) demonstrated tolerability and promising antitumor activity among pediatric and adolescent patients with NTRK/ROS1-altered solid tumors in a phase 1/2 clinical trial (NCT04685226), according to a news release from the developers, InnoCare Pharma.1
Data were presented at the Congress of International Society of Pediatric Oncology (SIOP) 2025 in an oral presentation by Juan Wang of the Sun Yat-sen University Cancer Center in Guangzhou, China. As of July 31, 2025, the objective response rate (ORR) among patients treated with zurletrectinib was 90% as assessed by an independent review committee (IRC). Additionally, among patients who completed full efficacy evaluations, those resistant to first-generation TRK inhibitors all achieved partial responses.
Furthermore, no dose-limiting toxicities were observed with the investigational agent, and treatment-related adverse effects (TRAEs) were primarily grade 1 or 2.
Additionally, the recommended phase 2 dose (RP2D) was found to be 7.2 mg/m2 for pediatric patients and 8 mg/m2 for adolescent patients. At the RP2D, comparable exposure levels between pediatric or adolescent patients vs adult patients were shown for zurletrectinib.
Previous interim findings presented at the 2025 American Society of Clinical Oncology (ASCO) Annual Meeting revealed that as of November 23, 2024, the median duration of response (DOR) and progression-free survival (PFS) were not reached.2 The 12-month rates for DOR and PFS were 92.0% and 90.5%, respectively. Additionally, of 3 patients with brain metastases, 2 achieved intracerebral responses.
Furthermore, the new drug application (NDA) for zurletrectinib as a treatment for patients with NTRK gene fusion-positive tumors was accepted by the Centre for Drug Evaluation (CDE) and was given priority review status in May 2025.3 The agency accepted the zurletrectinib NDA for review in the same patient population in April 2025.4
“Zurletrectinib has demonstrated outstanding efficacy and safety in adult, adolescent, and pediatric patients with tumors harboring NTRK fusion genes, bringing better treatment options for patients with solid tumors,” Jasmine Cui, PhD, co-founder, chairwoman, and chief executive officer of InnoCare, said in a news release on the NDA submission.4 “[InnoCare] is expanding the scope of its solid tumor pipelines through a combination of targeted therapies, immune-oncology approaches, and cutting-edge antibody drug conjugate [ADC] technology, looking forward to meeting the unmet needs of patients with solid tumors early.”
The multicenter, open-label phase 1/2 trial assigned patients with histopathologically confirmed, surgically unresectable, locally advanced or metastatic solid tumors who were 12 years of age and older to receive zurletrectinib as an oral tablet.5 The primary end points of the phase 1/2 study were safety and tolerability and maximum tolerated dose. Secondary end points included maximum concentration of zurletrectinib and ORR.
Patients were eligible for enrollment if they had at least 1 measurable lesion per RECIST v1.1 criteria, or for primary central nervous system tumors, per Response Assessment in Neuro-Oncology (RANO) or International Neuroblastomas Response Criteria (INRC) criteria; an ECOG performance status of 0 to 1 or Karnofsky or Lansky performance status of greater than 60; and a life expectancy of more than 3 months.
Exclusion criteria included having any concurrent malignancy within 5 years prior to first study dose, receipt of prior anti-cancer treatment within 28 days of the first study dose, or any major surgical procedures within 4 weeks or minor surgical procedure within 2 weeks of first study dose. Those with a history of allergic disease, severe drug allergy, or known hypersensitivity to any component of the tablet formulation were ineligible for study enrollment.
References
Latest data of InnoCare’s zurletrectinib orally presented at SIOP 2025. News release. InnoCare Pharma. October 29, 2025. Accessed October 31, 2025. https://tinyurl.com/3suebres
Latest data of InnoCare’s robust oncology pipelines presented at the 2025 ASCO Annual Meeting. News release. InnoCare Pharma. June 1, 2025. Accessed October 31, 2025. https://tinyurl.com/tbsukc6f
InnoCare’s zurletrectinib receives priority review from China’s NMPA. News release. InnoCare Pharma. May 2, 2025. Accessed October 31, 2025. https://tinyurl.com/ycx7vdv7
InnoCare announces the acceptance of new drug application for pan-TRK inhibitor zurletrectinib in China. News release. InnoCare Pharma. April 16, 2025. Accessed October 31, 2025. https://tinyurl.com/4w29v4kc
A phase I/II clinical trial of ICP-723 in the treatment of advanced solid tumors. ClinicalTrials.gov. Updated September 2, 2025. Accessed October 31, 2025. https://tinyurl.com/3xc4746u