Could Apple expectations be any higher? The Club stock made history Tuesday, eclipsing a $4 trillion market capitalization for the first time ever, joining fellow portfolio names Nvidia and Microsoft above that level. (Nvidia on Wednesday became the first company to go above a $5 trillion valuation .) Apple shares closed just below the $4 trillion milestone Tuesday and were back and forth a session later. The remarkable comeback for Apple shares, which earlier this year were left for dead, occurred as CEO Tim Cook got on the right side of President Donald Trump ‘s desire to bring manufacturing back to the U.S., and more recently, as demand for the new iPhone models turned out to be stronger than analysts had expected. Throw in the favorable ruling in a landmark antitrust case that secures Apple’s lucrative search partnership with Alphabet’s Google, and the tech behemoth’s upcoming earnings report Thursday evening becomes one of Apple’s most pivotal in recent memory. That’s because a seemingly long-awaited iPhone upgrade cycle finally taking shape, combined with other tailwinds, have bought Apple more time to deliver on its crucial generative artificial intelligence features before its lackluster AI rollout comes back into focus. AAPL YTD mountain Apple YTD Bank of America, however, is not worried about AI. In fact, the analysts said in a Wednesday note that Apple will be an “eventual winner” in artificial intelligence. That’s why BofA thinks Apple’s earnings could double from 2024 to 2030. The analysts also increased their Apple price target to $320 per share from $270, implying an 18% upside from Tuesday’s close. Earlier this week, JPMorgan said Apple shares are “heading into the upcoming earnings print with a greater halo of positivity than any time in the past year.” The analysts cited “robust revenue and margins” that will “reinforce to investors a positive product cycle for the company.” The analysts raised their price target to $290 from $280. Despite positives, Apple naysayers continue to doubt the stock due to management’s underwhelming artificial intelligence rollout. Apple Intelligence, the iPhone maker’s generative AI suite, has faced a series of delays. Making matters worse, the company still hasn’t shared much about its roadmap despite postponing its AI-enhanced version of Siri until at least 2026. Plus, top AI talent at Apple keeps getting poached by Big Tech peers such as Club holding Meta Platforms . Still, Apple has enough going for it to shake off these AI concerns heading into the company’s earnings report. In fact, the Club sees three reasons that investors have been able to overlook the overhang. iPhone 17 demand For starters, the latest lineup of iPhone 17 models, along with the iPhone Air, has shown promising signs since their launch in September. Early iPhone 17 lead times, a gauge for consumer demand, have largely exceeded those of last year’s iPhone 16 debut. Recent data from research firms reinforce this idea, too. According to Counterpoint Research , Apple’s global smartphone shipments increased 4% year-over-year in the third quarter. The report, published on Oct. 15, also described the newest iPhone 17 series as being “well received” and having experienced “record-breaking pre-booking across regions.” Upbeat commentary from cellular providers on iPhone sales, Apple’s biggest source of revenue, has also been welcomed news. Late last month, Mike Sievert, then-outgoing CEO of T-Mobile , said the company experienced all-time high iPhone sales. “We just had the biggest iPhone week,” Sievert, who has since stepped down as chief executive, told Jim Cramer in a CNBC interview. “We’re up double digits from a year ago,” he said at the time. For the Club’s part, Jim has described the iPhone 17’s debut as “gigantic,” adding that the newest devices are “more of a bargain” than past versions. “What Apple is saying is, ‘Look, these are full price, but because you get a discount from the carriers like Mike Sievert at T-Mobile and the value of the trade-in turned out to be more than we thought.’ So, there’s been no increase in price,” Jim said in September. Baird analysts said a solid reception to the iPhone could mean better-than-expected fiscal 2025 fourth quarter results. “We continue to view AAPL as well positioned to report upside to Sep-qtr expectations and guide Dec-qtr above Street expectations later this week,” Baird said in a Tuesday note. “Our checks suggest this may be more than the average iPhone refresh cycle, as lead times for the base iPhone 17 continue to outpace last year’s levels (6+ weeks post launch).” The analysts, in turn, hiked their Apple price target to $280 from $230. Tariffs Apple is better positioned this quarter because of how management handled Trump’s tariff demands. After the White House threatened Apple with an additional 25% tariff on iPhones made outside the country in May, Cook announced in August an additional $100 billion investment into U.S. manufacturing to get on a better footing with the White House. That was a big deal for Apple, given that a lot of its manufacturing still takes place in China, which is also the company’s second-largest market. Apple has been able to mitigate a lot of these risks from tariffs, which could force the company to eat extra costs or raise device prices. The latter could dampen demand down the road. Google ruling Apple is in a better position than feared this quarter after a federal judge ruled in early September that Google could continue paying Apple billions per year to be the default search engine for the iPhone and other devices. The ruling follows a years-long battle between the Justice Department and Google over alleged violations of U.S. antitrust laws. Jim described the news as “shockingly favorable” at the time, adding it was a “big win for Apple.” The decision means that Apple can continue raking in billions for its high-margin services division with little cost associated. (The services unit garners revenues from subscriptions and licensing fees through offerings like Apple TV, iCloud, Apple Music, the App Store, and more.) Apple is estimated to have been paid $20 billion annually by Google as part of the deal. Overall, TDCowen analysts said Monday that Apple stock sentiment is “markedly positive” into quarterly earnings, in part, because these search revenue streams from Google remain intact. And, it can serve as a blueprint for AI chatbot placement. To be sure, Apple does have a high bar to hit this earnings season following a great third-quarter release in July. The company posted its biggest growth in quarterly revenue since 2021. Yet again, Apple notched an all-time high base of active devices in all of its product categories. The crucial services business hit a new record, supported by better-than-expected gross margins. Bottom line High expectations aside, Apple still seems well-positioned heading into the release. According to market data provider LSEG’s consensus estimate, Apple is expected to report earnings-per-share (EPS) growth of 8% to $1.77 in its final quarter of its 2025 fiscal year. Revenue in the three months ended in September is seen rising 7.7% year-over-year to $102.24 billion. Since the iPhone’s September launch, the Club has pounded the table on the newest line of smartphones. It’s been especially important as Apple faces an increasingly crowded smartphone market in China, too. Investors can heave a sigh of relief into the quarter, as Apple has been able to bypass two major headwinds that weighed on shares earlier this year as well: Trump’s tariff demands and the DOJ ruling. While Apple’s staggered artificial intelligence rollout is something to watch, we have said time and time again that the company doesn’t need to be the first to market to win. Why should AI be any different? What matters more is management’s track record of delivering the best, most innovative devices. Apple didn’t invent the smartphone, but the iPhone still remains the “greatest product in the world,” Jim has said. That’s why we continue to maintain our “own, don’t trade it” thesis on this high-quality stock. (Jim Cramer’s Charitable Trust is long AAPL, META, MSFT, NVDA. See here for a full list of the stocks.) As a subscriber to the CNBC Investing Club with Jim Cramer, you will receive a trade alert before Jim makes a trade. Jim waits 45 minutes after sending a trade alert before buying or selling a stock in his charitable trust’s portfolio. If Jim has talked about a stock on CNBC TV, he waits 72 hours after issuing the trade alert before executing the trade. THE ABOVE INVESTING CLUB INFORMATION IS SUBJECT TO OUR TERMS AND CONDITIONS AND PRIVACY POLICY , TOGETHER WITH OUR DISCLAIMER . NO FIDUCIARY OBLIGATION OR DUTY EXISTS, OR IS CREATED, BY VIRTUE OF YOUR RECEIPT OF ANY INFORMATION PROVIDED IN CONNECTION WITH THE INVESTING CLUB. NO SPECIFIC OUTCOME OR PROFIT IS GUARANTEED.
NEPTUNUS-1 and NEPTUNUS-2 achieved primary objective of reduced disease activity and provided clinically meaningful benefit1
Data showed consistent improvements across secondary outcome measures, and a favorable safety profile1
Novartis plans to submit to health authorities globally in early 2026
If approved, ianalumab could become first targeted treatment for this heterogeneous, systemic autoimmune disease
Basel, October 29, 2025 – Novartis today presented new ianalumab data in Sjögren’s disease, the second most prevalent rheumatic autoimmune disease2, at a late-breaker presentation during the American College of Rheumatology Convergence congress1.
Ianalumab 300 mg monthly delivered a clinically meaningful benefit in the global NEPTUNUS-1 and NEPTUNUS-2 Phase III trials, showing both improvement in disease activity and reductions in patient burden1. Compared to placebo, ianalumab achieved a numerically greater reduction in disease activity by Week 16 with improvements sustained through Week 52 as measured by the EULAR Sjögren’s Syndrome Disease Activity Index (ESSDAI)1.
“Sjögren’s disease is a debilitating autoimmune condition affecting multiple organs causing a wide spectrum of symptoms such as dryness, fatigue, pain, and an increased risk of lymphoma – that together may create a substantial disease burden,” says Professor Xavier Mariette, Head of Department of Immuno-Rheumatology, Bicêtre Hospital, Assistance Publique – Hôpitaux de Paris, Paris-Saclay University, France. “The NEPTUNUS trials were the first Phase III studies in Sjögren’s in which a treatment significantly improved disease activity and demonstrated that ianalumab has the potential to provide a clinically meaningful benefit to patients.”
Ianalumab is a fully human monoclonal antibody with a novel dual mechanism of action that depletes B-cells and also inhibits their activation and survival via BAFF-R blockade3. B-cell dysfunction plays a significant role in Sjögren’s disease by causing an autoimmune response that leads to inflammation and tissue damage4-6.
“Today’s results reinforce our confidence that ianalumab has the potential to transform the treatment of this complex disease where no targeted medications currently exist,” said Shreeram Aradhye, M.D., President of Development and Chief Medical Officer at Novartis. “We look forward to working with health authorities globally to bring this innovation to people with Sjögren’s disease, the second most prevalent rheumatic autoimmune disease.”
NEPTUNUS study outcomes from 219 trial sites in 35 countries The replicate NEPTUNUS trials showed statistically significant improvement in ESSDAI, the primary endpoint, at week 48 for ianalumab 300 mg monthly1. Numerical improvements were observed as early as Week 16, which were sustained throughout the study1.
Reduction in overall disease burden as early as Week 8 continuing to Week 52 as assessed by Patient Global Assessment1
Numerical improvement in dryness, pain and fatigue as assessed by Sjögren’s Syndrome Symptom Diary and EULAR Sjögren’s Syndrome Patient Reported Index1
Improvement of stimulated Salivary Flow (sSF) rate and oral dryness vs placebo in patients with sSF>0.4 mL/min at baseline, in a post-hoc analysis1
Ianalumab 300 mg monthly numerically improved physician- and patient-reported outcomes1. Nominal significance was observed in NEPTUNUS-1 and the pooled data set for PhGA and PaGA, as well as the number of patients achieving low disease activity based on ESSDAI in the pooled data set1. The pooled and individual patient-reported secondary outcomes did not reach statistical significance1.
The trial results showed favorable safety with an overall incidence of adverse events and serious adverse events comparable to placebo in both studies1.
About NEPTUNUS-1 and NEPTUNUS-2 The Phase III clinical trials, NEPTUNUS-1 and NEPTUNUS-2, are global, multicenter, pivotal studies evaluating the efficacy and safety of ianalumab in patients with Sjögren’s disease7,8. These trials were designed to provide comprehensive data on the potential of ianalumab as a targeted treatment for Sjögren’s disease, in patients with active extraglandular disease3,7,8.
NEPTUNUS-1 is a randomized, double-blind, 2-arm multicenter Phase III trial (N=275) designed to evaluate the clinical efficacy, safety, and tolerability of ianalumab 300 mg subcutaneous (s.c.) monthly compared with placebo for 52 weeks7. NEPTUNUS-2 is a randomized, double-blind, 3-arm multicenter Phase III trial (N=504) to evaluate the clinical efficacy, safety, and tolerability of ianalumab 300 mg s.c. monthly or every 3 months compared with placebo for up to 52 weeks8.
Patients currently enrolled in the trials have been given the opportunity to continue follow-up in these studies or enter a long-term extension trial that will continue to assess the long-term efficacy and safety of ianalumab9.
Ianalumab (VAY736) is also being investigated for its potential to treat other B-cell driven autoimmune diseases including immune thrombocytopenia (ITP), systemic lupus erythematosus (SLE), lupus nephritis (LN), warm autoimmune hemolytic anemia (wAIHA) and systemic sclerosis (SSc)3,10-14. Ianalumab originates from an early collaboration with MorphoSys AG, a company which Novartis acquired in 202415.
About Sjögren’s disease (previously called Sjögren’s syndrome) Sjögren’s disease is a complex, systemic autoimmune disease that causes inflammation and tissue damage, impacting the entire body16. It primarily affects exocrine glands, leading to excessive dryness, with over 90% of patients experiencing dry eyes and dry mouth16,17. The disease is heterogenous and inflicts a wide range of symptoms, with patients most commonly experiencing dryness, fatigue and widespread pain, though 30-40% of patients will also show extraglandular organ involvement18,19. Extraglandular manifestation can be very diverse and can affect skin, musculoskeletal system, kidneys, lungs and other organs19. The risk of lymphoma is increased in patients with Sjögren’s18. Sjögren’s affects approximately 0.25% of the population with an estimated 50% undiagnosed 20-21. Sjögren’s is nine times more common in women than men16.
Disclaimer This press release contains forward-looking statements within the meaning of the United States Private Securities Litigation Reform Act of 1995. Forward-looking statements can generally be identified by words such as “potential,” “can,” “will,” “plan,” “may,” “could,” “would,” “expect,” “anticipate,” “look forward,” “believe,” “committed,” “investigational,” “pipeline,” “launch,” or similar terms, or by express or implied discussions regarding potential marketing approvals, new indications or labeling for the investigational or approved products described in this press release, or regarding potential future revenues from such products. You should not place undue reliance on these statements. Such forward-looking statements are based on our current beliefs and expectations regarding future events, and are subject to significant known and unknown risks and uncertainties. Should one or more of these risks or uncertainties materialize, or should underlying assumptions prove incorrect, actual results may vary materially from those set forth in the forward-looking statements. There can be no guarantee that the investigational or approved products described in this press release will be submitted or approved for sale or for any additional indications or labeling in any market, or at any particular time. Nor can there be any guarantee that such products will be commercially successful in the future. In particular, our expectations regarding such products could be affected by, among other things, the uncertainties inherent in research and development, including clinical trial results and additional analysis of existing clinical data; regulatory actions or delays or government regulation generally; global trends toward health care cost containment, including government, payor and general public pricing and reimbursement pressures and requirements for increased pricing transparency; our ability to obtain or maintain proprietary intellectual property protection; the particular prescribing preferences of physicians and patients; general political, economic and business conditions, including the effects of and efforts to mitigate pandemic diseases; safety, quality, data integrity or manufacturing issues; potential or actual data security and data privacy breaches, or disruptions of our information technology systems, and other risks and factors referred to in Novartis AG’s current Form 20-F on file with the US Securities and Exchange Commission. Novartis is providing the information in this press release as of this date and does not undertake any obligation to update any forward-looking statements contained in this press release as a result of new information, future events or otherwise.
About Novartis Novartis is an innovative medicines company. Every day, we work to reimagine medicine to improve and extend people’s lives so that patients, healthcare professionals and societies are empowered in the face of serious disease. Our medicines reach nearly 300 million people worldwide.
Reimagine medicine with us: Visit us at https://www.novartis.com and connect with us on LinkedIn, Facebook, X/Twitter and Instagram.
References
Thomas GB, Xavier M, Stephanie F et al. Ianalumab demonstrates significant reduction in disease activity in patients with Sjögren’s Disease: Efficacy and safety results from two global Phase 3, randomized, placebo-controlled double-blind studies (NEPTUNUS-1 and NEPTUNUS-2). Presented at the American College of Rheumatology (ACR) Congress; October 24-29, 2025; Chicago, Illinois
National Academies of Sciences, Engineering, and Medicine; Health and Medicine Division; Board on Health Care Services; Committee on Selected Immune Disorders and Disability. Sjögren’s Disease/Syndrome. [Last accessed: October 2025] https://www.ncbi.nlm.nih.gov/books/NBK584486/
Dorner T et al, Safety and Efficacy of ianalumab in patients with Sjögren’s disease: 52-week results from a randomized, placebo-controlled, Phase 2b dose-ranging study, Arthritis and Rheumatology 2025, 77(5):560-570
Lee AY, Qi Z, Jackson KJ, et al. Self-reactive B cells are increased in all major stages of peripheral development in Sjögren’s disease. Immunology & Cell Biology 2025; 103: 401-410.
Both T, Dalm VA, van Hagen PM, et al. Reviewing primary Sjögren’s syndrome: beyond the dryness – From pathophysiology to diagnosis and treatment. Int J Med Sci 2017; 14: 191-200.
Cornec D, Devauchelle-Pensec V, Tobón GJ, et al. B cells in Sjögren’s syndrome: from pathophysiology to diagnosis and treatment. J Autoimmun 2012; 39: 161-167.
ClinicalTrials.gov NCT05350072 [Last accessed: October 2025]
ClinicalTrials.gov NCT0539214 [Last accessed: October 2025]
ClinicalTrials.gov NCT05985915 [Last accessed: October 2025]
ClinicalTrials.gov NCT05653219 [Last accessed: October 2025]
ClinicalTrials.gov NCT05639114 [Last accessed: October 2025]
ClinicalTrials.gov NCT05126277 [Last accessed: October 2025]
ClinicalTrials.gov NCT05648968 [Last accessed: October 2025]
ClinicalTrials.gov NTC06470048 [Last accessed: October 2025]
Novartis to strengthen oncology pipeline with agreement to acquire MorphoSys [AG Press release]. [Press release]. Available at: Novartis to strengthen oncology pipeline with agreement to acquire MorphoSys AG for EUR 68 per share or an aggregate of EUR 2.7bn in cash | Novartis [Last accessed: October 2025]
Negrini S et al, Sjögren’s syndrome: a systemic autoimmune disease, Clin Exp Med. 2022; 22(1): 9–25
Maleki Fischbach-M, et al, Manifestations and management of Sjögren’s disease, Arthritis Res Ther, 2024; 26(1):43
Mariette, Primary Sjögren’s symptoms, New England Journal of Medicine, 2018, 378;10
Kerry Gairy et al, Burden of illness among subgroups of px with primary SjD and systemic involvement, Rheumatology 2021, Volume 60, Issue 4, April 2021, Pages 1871–1881
Conrad N, et al, Incidence, prevalence, and co-occurrence of autoimmune disorders over time and by age, sex, and socioeconomic status: a population-based cohort study of 22 millions individuals in the UK, Lancet. 2023;401(10391):1878-1890;
Narváez J et al, Prevalence of Sjögren’s syndrome in the general adult population in Spain: estimating the proportion of undiagnosed cases, Sci Rep. 2020;10(1):10627
Nvidia (NVDA) remains the dominant force in AI computing — becoming the first company to reach a market capitalization of $5 trillion — as it transforms from a chipmaker into the essential platform powering the global shift toward accelerated computing and generative AI. The company’s new Blackwell architecture is driving a fresh product cycle, supported by expanding partnerships with major hyperscalers and rapid adoption of Spectrum-X networking, which extends NVDA’s influence across the entire data center stack. With management guiding to another record quarter and visibility into a $2T+ AI infrastructure opportunity, NVDA continues to combine exceptional growth, profitability and execution at a valuation that remains attractive relative to its earnings trajectory. Trade timing & outlook NVDA’s breakout above its prior $200 ceiling completes a three-month consolidation pattern, signaling continuation of its multi-quarter uptrend. Relative strength remains a key tailwind, with NVDA leading both the semiconductor sector and S & P 500, suggesting upside towards our $235 target. Fundamentals At roughly 31x forward earnings, NVDA trades modestly above the industry average of 26x but with far superior growth — consensus expects 37% EPS growth and 36% revenue growth, more than triple sector peers. With net margins exceeding 52%, NVDA’s profitability is unmatched among large-cap technology firms and reflects its scale advantage and vertical integration across hardware, networking, and software. Bullish thesis Record growth cycle: Q2 FY26 revenue grew 56% YoY to $46.7B, and guidance for Q3 at $54B signals sustained acceleration. Blackwell ramp: Strong demand for GB200 systems, up 17% sequentially, positions the new architecture as the key driver of 2026 growth. Ecosystem expansion: Spectrum-X networking wins with Meta and Oracle broaden NVDA’s reach beyond GPUs into AI infrastructure. Operational agility: The company effectively reallocated supply amid China export restrictions, preserving top-line momentum. Secular AI demand: With hyperscalers, governments, and enterprises all investing in AI compute, NVDA remains the defining beneficiary of the multi-year AI buildout. Options trade With an IV Rank of 40%, options premiums are moderately priced, offering attractive risk/reward through defined-risk debit spreads. I’m buying the Dec 19, 2025 $200/$235 Call Vertical @ $11 Debit. This entails: Buying the Dec 19, 2025 $200 call @ $14.90 Selling the Dec 19, 2025 $235 call @ $3.90 The maximum reward is $2,400 per contract if NVDA is above $235 at expiration. The maximum risk is $1,100 per contract if NVDA is below $200 at expiration. The breakeven point for this trade is $211. View this Trade with Updated Prices at OptionsPlay Summary NVDA’s breakout confirms renewed leadership in both AI infrastructure and networking, margin expansion, and visibility into another record-setting quarter. With the Blackwell cycle ramping, networking attach broadening, and trade headwinds proving manageable, NVDA remains one of the market’s clearest high-conviction plays on the continued acceleration of AI-driven compute demand. DISCLOSURES: Zhang has a position in NVDA. All opinions expressed by the CNBC Pro contributors are solely their opinions and do not reflect the opinions of CNBC, NBC UNIVERSAL, their parent company or affiliates, and may have been previously disseminated by them on television, radio, internet or another medium. THE ABOVE CONTENT IS SUBJECT TO OUR TERMS AND CONDITIONS AND PRIVACY POLICY . THIS CONTENT IS PROVIDED FOR INFORMATIONAL PURPOSES ONLY AND DOES NOT CONSITUTE FINANCIAL, INVESTMENT, TAX OR LEGAL ADVICE OR A RECOMMENDATION TO BUY ANY SECURITY OR OTHER FINANCIAL ASSET. THE CONTENT IS GENERAL IN NATURE AND DOES NOT REFLECT ANY INDIVIDUAL’S UNIQUE PERSONAL CIRCUMSTANCES. THE ABOVE CONTENT MIGHT NOT BE SUITABLE FOR YOUR PARTICULAR CIRCUMSTANCES. BEFORE MAKING ANY FINANCIAL DECISIONS, YOU SHOULD STRONGLY CONSIDER SEEKING ADVICE FROM YOUR OWN FINANCIAL OR INVESTMENT ADVISOR. Click here for the full disclaimer.
The Japanese auto giant Toyota Motor has denied Donald Trump’s suggestion that it is poised to invest more than $10bn in the United States over the coming years.
On a visit to Japan earlier this week, the US president claimed he had been told that the carmaker was going to be setting up factories “all over” the US “to the tune of over $10bn”.
“Go out and buy a Toyota,” added Trump.
But a senior executive at Toyota – the world’s largest automaker – said that no such explicit promise of investment at that level had been made, although Toyota plans to invest and create new jobs in the US.
The firm held talks with Japanese and American officials ahead of Trump’s visit.
“During the first Trump administration, I think the figure was roughly around $10bn, so while we didn’t say the same scale, we did explain that we’ll keep investing and providing employment as before,” Hiroyuki Ueda told reporters, on the sidelines of the Japan Mobility Show in Tokyo. “So, probably because of that context, the figure of about $10bn came up.”
Toyota “didn’t specifically say that we’ll invest $10bn over the next few years”, Ueda said, adding that the topic of investment did not come up when Akio Toyoda, the firm’s chairman, spoke with Trump at a US Embassy event on Tuesday.
Trump met with Japan’s new prime minister and first female premier, Sanae Takaichi, on Tuesday. He welcomed Takaichi’s pledge to accelerate a military buildup, while also signing deals on trade and rare earths.
skip past newsletter promotion
after newsletter promotion
During the visit, Takaichi pledged to realise a “golden age” in relations with the US and to “fundamentally reinforce” her country’s defense posture. The two leaders signed an agreement laying out a framework to secure the mining and processing of rare earths and other minerals.
Today’s investors have a lot of options for where to invest their money. Between private markets, cryptocurrencies, and other financial instruments, more traditional stocks may look a little old-fashioned.
“If you dial the clock back [to] two decades ago, if you had money and wanted to invest, you would call up your brokers and talk about what stocks there are available,” Bonnie Chan, CEO of Hong Kong Exchanges and Clearing (HKEX), said Monday at the Fortune Global Forum in Riyadh.
“Now, people can get exposure to all sorts of investment opportunities. We’re entering a stage where exchanges are not really competing with one another, but working together.”
Since the first Bitcoin boom in the early 2010s, investors have increasingly explored new investment instruments, such as cryptocurrencies and other digital assets.
Meanwhile, stock markets are performing well this year, with indices reaching all-time highs, in part due to retail investors piling into buzzy companies and investment fads. On Monday, Chan’s fellow panelists, Saudi Tadawul Group CEO Eng. Khalid Abdullah Al Hussan and Nasdaq vice chairman Bob McCooey, noted that investor appetite was returning globally.
“The U.S. went through, from the end of 2021, two or three years of tough markets where people couldn’t get public. In 2025, we’re getting some momentum here,” McCooey said, referring to U.S. markets. He added that a growing number of companies want to go public (i.e. list shares for sale on the stock exchange), including private equity firms and government-backed companies.
Al Hussan also pointed to burgeoning investor appetite in Saudi Arabia’s market, noting that in the last three years, the country went from having eight to nine IPOs a year, to around 40 to 45 annually.
Chan, from HKEX, pointed out that Hong Kong’s exchanges have in recent times completed close to 80 IPOs. “We went through a phase in the last few years where there were questions as to the invest-ability of Chinese stocks. But I think we have made a lot of progress,” she said.
She attributed the global rise in IPOs to investors’ desire to diversify their investment and trading strategies, in order to hedge against market volatility from geopolitical uncertainty and new protectionist policies.
“They want to put their eggs in more than one basket,” she said, adding that Hong Kong has recently seen a return of international investors. “This year, we’ve seen a strong appetite from investors. They want AI, semiconductors, and names in the green technology space.”
Aside from tech, Chan noted a new investment trend, which she called “new consumption.” She cited the latest consumer craze for Labubu dolls, collectible plush toys designed by Hong Kong illustrator Kasing Lung. Pop Mart, which sells Labubu dolls in blind boxes, currently has a market value of over $40 billion.
Bank of Canada trims key interest rate, hints at end to cuts Reuters
Will the Bank of Canada pause its easing cycle after delivering another rate cut? FXStreet
BoC preview: a rate cut is expected but the focus will centre on forward guidance investingLive
In the news today: Is an interest rate cut coming? Blue Jays win Game 4 over Dodgers iNFOnews.ca
Canada Economics Brief: Bank of Canada Governing Council Sees Current Policy Rate at “About the Right Level” to keep Inflation Close to 2% MarketScreener
Carmakers in the EU are “days away” from closing production lines, the industry has warned as a crisis over computer chip supplies from China escalates.
The European Automobile Manufacturers’ Association (ACEA) issued an urgent warning on Wednesday saying its members, which include Volkswagen, Fiat, Peugeot and BMW, were now working on “reserve stocks but supplies are dwindling”.
“Assembly line stoppages might only be days away. We urge all involved to redouble their efforts to find a diplomatic way out of this critical situation,” said its director general, Sigrid de Vries.
Another ACEA member, Mercedes, is now searching globally for alternative sources of the crucial semiconductors, according to its chief executive, Ola Källenius.
The chip shortage is also causing problems in Japan, where Nissan’s chief performance officer, Guillaume Cartier, told reporters at a car show in Tokyo that the company was only “OK to the first week of November” in terms of supply.
Beijing banned exports of Nexperia chips near the start of the month in response to the Dutch government’s decision to take over the Netherlands-headquartered company on 30 September and suspend its Chinese chief executive after the US flagged security concerns.
Last week car companies in the UK, EU and Japan, including brands such as Volvo, Volkswagen, Honda and Nissan, said the ban on exports from Nexperia factories in China could halt production lines.
“The industry is currently working through reserve stocks but supplies are rapidly dwindling. From a survey of our members this week, some are already expecting imminent assembly line stoppages,” de Vries said.
The Nexperia chip ban was a blow to Europe’s car sector, which has already been hit by President Xi Jinping’s decision to reintroduce controls on exports of rare earth exports as part of the escalating trade tensions with the US.
Xi and Donald Trump are expected to sign off on a trade agreement when they meet on the sidelines of a summit in South Korea on Thursday. The proposed deal would pause the export ban on the crucial minerals for a year, but it is unclear if this will also cover deliveries to the EU.
Rare earths, in particular magnets, are used across the car industry for window, door and boot openings, while chips are critical to all electronics in vehicles, ranging from dashboard functions to ignition and transmission systems.
De Vries said while alternative suppliers for chips existed, it could take “months to build up additional capacity”. She said the “industry does not have that long before the worst effects of this shortage are felt”.
A high-level delegation from Beijing will arrive in Brussels on Friday for talks but there are fears the diplomatic tools deployed by the EU in the past months are not as effective as the hardballing used by the US and China.
“We know that all parties to this dispute are working very hard to find a diplomatic solution. At the same time, our members are telling us that part supplies are already being stopped due to the shortage,” de Vries said.
The Dutch government seized control of Nexperia on 30 September, citing lapses in governance. On 4 October, the Chinese ministry of commerce blocked exports of the chipmaker’s products out of China. While most of Nexperia’s semiconductors are produced in Europe, about 70% are packaged in China before distribution.
The company’s Chinese arm has taken steps toward independence and has resumed selling products to domestic Chinese customers.
The sources said the Dutch government believes it can negotiate a resolution with China that will restore the company to a unified Dutch-Chinese structure.
Ladha JK, Jat ML, Stirling CM, Chakraborty D, Pradhan P, Krupnik TJ et al. Achieving the sustainable development goals in agriculture: The crucial role of nitrogen in cereal-based systems. In: Sparks DL, editor. Advances in Agronomy, Vol 163. Advances in Agronomy. 1632020. pp. 39–116.
Menegat S, Ledo A, Tirado R. Greenhouse gas emissions from global production and use of nitrogen synthetic fertilisers in agriculture. Sci Rep. 2022;12(1):14490.
Chauhan BSJ, Khawar J, Mahajan G. Rice production worldwide. Springer. 2017;247.
Xu JZ, Peng SZ, Yang SH, Wang WG. Ammonia volatilization losses from a rice paddy with different irrigation and nitrogen managements. Agric Water Manage. 2012;104:184–92.
Article
Google Scholar
Hu B, Wang W, Chen JJ, Liu YQ, Chu CC. Genetic improvement toward nitrogen-use efficiency in rice: lessons and perspectives. Mol Plant. 2023;16(1):64–74.
Article
CAS
PubMed
Google Scholar
Neeraja CN, Barbadikar KM, Mangrauthia SK, Rao PR, Subrahmanayam D, Sundaram RM. Genes for NUE in rice: a way forward for molecular breeding and genome editing. Plant Physiol Rep. 2021;26(4):587–99.
Article
CAS
Google Scholar
Cassman KG, Peng S, Olk DC, Ladha JK, Reichardt W, Dobermann A, et al. Opportunities for increased nitrogen-use efficiency from improved resource management in irrigated rice systems. Field Crops Res. 1998;56(1–2):7–39.
Article
Google Scholar
Li H, Hu B, Chu CC. Nitrogen use efficiency in crops: lessons from Arabidopsis and rice. J Exp Bot. 2017;68(10):2477–88.
Article
CAS
PubMed
Google Scholar
Reig-Valiente J, Viruel J, Sales E, Marqués L, Terol J, Gut M et al. Genetic diversity and population structure of rice varieties cultivated in temperate regions. Rice. 2016;9:58.
Andaya VC, Tai TH. Fine mapping of the qCTS12 locus, a major QTL for seedling cold tolerance in rice. Theor Appl Genet. 2006;113(3):467–75.
Article
CAS
PubMed
Google Scholar
Hour AL, Hsieh WH, Chang SH, Wu YP, Chin HS, Lin YR. Genetic diversity of landraces and improved varieties of rice (Oryza sativa L.) in Taiwan. Rice. 2020;13:82.
Kumar V, Rithesh L, Raghuvanshi N, Kumar A, Parmar K. Advancing nitrogen use efficiency in cereal crops: A comprehensive exploration of genetic manipulation, nitrogen dynamics, and plant nitrogen assimilation. South Afr J Bot. 2024;169:486–98.
Article
CAS
Google Scholar
Nazish T, Arshad M, Jan SU, Javaid A, Khan MH, Naeem MA, et al. Transporters and transcription factors gene families involved in improving nitrogen use efficiency (NUE) and assimilation in rice (Oryza sativa L). Transgenic Res. 2022;31(1):23–42.
Article
CAS
PubMed
Google Scholar
Hou MM, Yu M, Li ZQ, Ai ZY, Chen JG. Molecular regulatory networks for improving nitrogen use efficiency in rice. Int J Mol Sci. 2021;22(16):9040.
Chaudhary S, Kalkal M. Rice transcriptome analysis reveals nitrogen starvation modulates differential alternative splicing and transcript usage in various Metabolism-Related genes. Life-Basel. 2021;11(4):285.
Feng Y, Lu Q, Zhai RR, Zhang MC, Xu Q, Yang YL, et al. Genome wide association mapping for grain shape traits in indica rice. Planta. 2016;244(4):819–30.
Article
CAS
PubMed
PubMed Central
Google Scholar
Qiu XJ, Zhu SB, Hu H, Wang CC, Lv WK, He LP, et al. Genome-Wide association mapping for grain shape in rice accessions. Int J Agric Biology. 2020;23(3):582–8.
CAS
Google Scholar
Liu YZ, Xin W, Chen LQ, Liu YQ, Wang X, Ma C et al. Genome-Wide association analysis of effective tillers in rice under different nitrogen gradients. Int J Mol Sci. 2024;25(5):2969.
Cheng XP, Chang YP, Sun JH, Du MY, Liang LP, Zhang MY et al. Identification of candidate genes and favourable haplotypes for yield traits in rice based on a genome-wide association study. Euphytica. 2023;219(12):125.
Peng SS, Liu YC, Xu YC, Zhao JH, Gao P, Liu Q et al. Genome-Wide association study identifies a Plant-Height-Associated Gene OsPG3 in a population of commercial rice varieties. Int J Mol Sci. 2023;24(14):11454.
Rakotoson T, Dusserre J, Letourmy P, Frouin J, Ratsimiala IR, Rakotoarisoa NV, et al. Genome-Wide association study of nitrogen use efficiency and agronomic traits in upland rice. Rice Sci. 2021;28(4):379–90.
Article
Google Scholar
Wang YY, Cheng YH, Chen KE, Tsay YF. Nitrate Transport, Signaling, and Use Efficiency. In: Merchant SS, editor. Annual Review of Plant Biology, Vol 69. Annual Review of Plant Biology. 692018. pp. 85–122.
Wei D, Cui KH, Ye GY, Pan JF, Xiang J, Huang JL, et al. QTL mapping for nitrogen-use efficiency and nitrogen-deficiency tolerance traits in rice. Plant Soil. 2012;359(1–2):281–95.
Article
CAS
Google Scholar
Li Q, Lu XL, Wang CJ, Shen L, Dai LP, He JL, et al. Genome-wide association study and transcriptome analysis reveal new QTL and candidate genes for nitrogen-deficiency tolerance in rice. Crop J. 2022;10(4):942–51.
Article
CAS
Google Scholar
Ding CQ, You J, Chen L, Wang SH, Ding YF. Nitrogen fertilizer increases spikelet number per panicle by enhancing cytokinin synthesis in rice. Plant Cell Rep. 2014;33(2):363–71.
Article
CAS
PubMed
Google Scholar
Das K, Panda BB, Shaw BP, Das SR, Dash SK, Kariali E et al. Grain density and its impact on grain filling characteristic of rice: mechanistic testing of the concept in genetically related cultivars. Sci Rep. 2018;8:4149.
Gao HB, Wang WG, Wang YH, Liang Y. Molecular mechanisms underlying plant architecture and its environmental plasticity in rice. Mol Breeding. 2019;39(12):167.
Dou Z, Zhou YC, Zhang YY, Guo W, Xu Q, Gao H. Influence of nitrogen applications during grain-Filling stage on rice (Oryza sativa L.) yield and grain quality under high temperature. Agronomy-Basel. 2024;14(1):216.
Li RH, Li MJ, Ashraf U, Liu SW, Zhang JE. Exploring the relationships between yield and yield-Related traits for rice varieties released in China from 1978 to 2017. Front Plant Sci. 2019;10:543.
Zhang QG, Sun J, Wang LP, Chen J, Ke J, Wu LQ. Effects of nitrogen application at different panicle development stages on the panicle structure and grain yield in hybrid indica rice cultivars. Agronomy-Basel. 2025;15(3):595.
Xin W, Wang JG, Li J, Zhao HW, Liu HL, Zheng HL et al. Candidate gene analysis for nitrogen absorption and utilization in Japonica rice at the seedling stage based on a Genome-Wide association study. Front Plant Sci. 2021;12:670861.
García-Romeral J, Castanera R, Casacuberta J, Domingo C. Deciphering the genetic basis of allelopathy in japonica rice cultivated in temperate regions using a Genome-Wide association study. Rice. 2024;17(1):22.
Walkley A, Black IA. An examination of the Degtjareff method for determining soil organic matter, and a proposed modification of the chromic acid titration method. Soil Sci. 1934;37(1):29–38.
Article
CAS
Google Scholar
Bouyoucos GJ. The hydrometer as a new method for the mechanical analysis of soils. Soil Sci. 1927;23(5):343–54.
Article
CAS
Google Scholar
Lancashire PD, Bleiholder H, Vandenboom T, Langeluddeke P, Stauss R, Weber E, et al. A uniform decimal code for growth-stages of crops and weeds. Ann Appl Biol. 1991;119(3):561–601.
Article
Google Scholar
Inc. SI. JMP®. 16 ed. Cary, NC: SAS Institute Inc.; 1989–2023.
Team RC. R: A Language and environment for statistical computing. Vienna, Austria: R Foundation for Statistical Computing; 2023.
Google Scholar
Kowarik A, Templ M. Imputation with the R package VIM. J Stat Softw. 2016;74(7):1–16.
Bradbury PJ, Zhang Z, Kroon DE, Casstevens TM, Ramdoss Y, Buckler ES. TASSEL: software for association mapping of complex traits in diverse samples. Bioinformatics. 2007;23(19):2633–5.
Article
CAS
PubMed
Google Scholar
Yu J, Pressoir G, Briggs WH, Vroh Bi I, Yamasaki M, Doebley JF, et al. A unified mixed-model method for association mapping that accounts for multiple levels of relatedness. Nat Genet. 2006;38(2):203–8.
Article
CAS
PubMed
Google Scholar
Patil I. Visualizations with statistical details: the ‘ggstatsplot’ approach. J Open Source Softw. 2021;6:3167.
Article
Google Scholar
Sakai H, Lee SS, Tanaka T, Numa H, Kim J, Kawahara Y, et al. Rice annotation project database (RAP-DB): an integrative and interactive database for rice genomics. Plant Cell Physiol. 2013;54(2):e6.
Article
CAS
PubMed
PubMed Central
Google Scholar
Kawahara Y, de la Bastide M, Hamilton JP, Kanamori H, McCombie WR, Ouyang S, et al. Improvement of the Oryza sativa Nipponbare reference genome using next generation sequence and optical map data. Volume 6. New York, NY: Rice; 2013. p. 4. 1.
Google Scholar
McCouch SR, Rice Genetics C. Gene nomenclature system for rice. Rice. 2008;1(1):72–84.
Article
Google Scholar
Kurata N, Yamazaki Y, Oryzabase. An integrated biological and genome information database for rice. Plant Physiol. 2006;140(1):12–7.
Article
CAS
PubMed
PubMed Central
Google Scholar
Mansueto L, Fuentes RR, Borja FN, Detras J, Abriol-Santos JM, Chebotarov D, et al. Rice SNP-seek database update: new snps, indels, and queries. Nucleic Acids Res. 2017;45(D1):D1075–81.
Article
CAS
PubMed
Google Scholar
Alexandrov N, Tai SS, Wang WS, Mansueto L, Palis K, Fuentes RR, et al. SNP-Seek database of SNPs derived from 3000 rice genomes. Nucleic Acids Res. 2015;43(D1):D1023–7.
Article
CAS
PubMed
Google Scholar
Yang WZ, Yoon J, Choi H, Fan YL, Chen RM, An G. Transcriptome analysis of nitrogen-starvation-responsive genes in rice. BMC Plant Biol. 2015;15:31.
Yan M, Fan XR, Feng HM, Miller AJ, Shen QR, Xu GH. Rice OsNAR2.1 interacts with OsNRT2.1, OsNRT2.2 and OsNRT2.3a nitrate transporters to provide uptake over high and low concentration ranges. Plant Cell Environ. 2011;34(8):1360–72.
Article
CAS
PubMed
Google Scholar
Liu XQ, Huang DM, Tao JY, Miller AJ, Fan XR, Xu GH. Identification and functional assay of the interaction motifs in the partner protein OsNAR2.1 of the two-component system for high-affinity nitrate transport. New Phytol. 2014;204(1):74–80.
Article
CAS
PubMed
PubMed Central
Google Scholar
Jiang HZ, Wang YM, Lai LR, Liu XT, Miao CJ, Liu RF, et al. OsAMT1.1 Expression by Nitrate-Inducible promoter of OsNAR2.1 Increases nitrogen use efficiency and rice yield. Rice Sci. 2023;30(3):222–34.
Article
Google Scholar
Chen HL, Xu N, Wu Q, Yu B, Chu YL, Li XX, et al. OsMADS27 regulates the root development in a NO3-dependent manner and modulates the salt tolerance in rice (Oryza sativa L.). Plant Sci. 2018;277:20–32.
Article
CAS
PubMed
Google Scholar
Pachamuthu K, Sundar VH, Narjala A, Singh RR, Das S, Pal H, et al. Nitrate-dependent regulation of miR444-OsMADS27 signalling cascade controls root development in rice. J Exp Bot. 2022;73(11):3511–30.
Article
CAS
PubMed
Google Scholar
Singh RK, Khan W, editors. Effect of nitrogen levels on growth and yield of basmati rice varieties2021.
Li G, Zhang Y, Zhou C, Xu J, Cj Z, Ni C, et al. Agronomic and physiological characteristics of high yield and nitrogen use efficient varieties of rice: comparison between two near-isogenic lines. Food Energy Secur. 2024;13(2):e539.
Article
CAS
Google Scholar
Tayefe M, Gerayzade A, Amiri E, Zade AN. Effect of nitrogen on rice yield, yield components and quality parameters. 2014.
Haghshenas H, Ghanbari Malidarreh A. Response of yield and yield components of released rice cultivars from 1990–2010 to nitrogen rates. Cent Asian J Plant Sci Innov. 2021;1(1):23–31.
Google Scholar
Zhang SY, Huang YZ, Ji Z, Fang YZ, Tian YN, Shen CB, et al. Discovery of SOD5 as a novel regulator of nitrogen-use efficiency and grain yield via altering auxin level. New Phytol. 2025;246(3):1084–95.
Article
CAS
PubMed
Google Scholar
Wu J, Sun LQ, Song Y, Bai Y, Wan GY, Wang JX, et al. The OsNLP3/4-OsRFL module regulates nitrogen-promoted panicle architecture in rice. New Phytol. 2023;240(6):2404–18.
Article
CAS
PubMed
Google Scholar
Duan YH, Zhang YL, Ye LT, Fan XR, Xu GH, Shen QR. Responses of rice cultivars with different nitrogen use efficiency to partial nitrate nutrition. Ann Botany. 2007;99(6):1153–60.
Article
CAS
Google Scholar
Tsednee M. Linking timing to nitrogen use efficiency: rice OsEC-Ghd7-ARE1 module works on it. Plant Physiol. 2024;196(3):1720–1.
Article
CAS
PubMed
PubMed Central
Google Scholar
Zhang L, Shen C, Zhu S, Ren N, Chen K, Xu J. Effects of sowing date and nitrogen (N) application rate on grain yield, nitrogen use efficiency and 2-acetyl-1-pyrroline formation in fragrant rice. Agronomy. 2022;12(12):3035.
Article
CAS
Google Scholar
Zhang SN, Zhang YY, Li KN, Yan M, Zhang JF, Yu M, et al. Nitrogen mediates flowering time and nitrogen use efficiency via floral regulators in rice. Curr Biol. 2021;31(4):671–83.
Article
CAS
PubMed
Google Scholar
Mo Y, Jeong JM, Ha SK, Kim J, Lee C, Lee GP et al. Characterization of QTLs and candidate genes for days to heading in rice Recombinant inbred lines. Genes. 2020;11(9):957.
Song J, Tang LQ, Cui YT, Fan HH, Zhen XQ, Wang JJ. Research progress on photoperiod gene regulation of heading date in rice. Curr Issues Mol Biol. 2024;46(9):10299–311.
Article
CAS
PubMed
PubMed Central
Google Scholar
Reig-Valiente JL, Marqués L, Talón M, Domingo C. Genome-wide association study of agronomic traits in rice cultivated in temperate regions. BMC Genomics. 2018;19:706.
Song YL, Gao ZC, Luan WJ. Interaction between temperature and photoperiod in regulation of flowering time in rice. Sci China-Life Sci. 2012;55(3):241–9.
Article
CAS
PubMed
Google Scholar
Matsubara K, Yamanouchi U, Wang ZX, Minobe Y, Izawa T, Yano M. Ehd2, a rice ortholog of the maize INDETERMINATE1 gene, promotes flowering by up-regulating Ehd1. Plant Physiol. 2008;148(3):1425–35.
Article
CAS
PubMed
PubMed Central
Google Scholar
Ohkubo Y, Kuwata K, Matsubayashi Y. A type 2 C protein phosphatase activates high-affinity nitrate uptake by dephosphorylating NRT2.1. Nat Plants. 2021;7(3):310.
Article
CAS
PubMed
Google Scholar
Wu JY, Yang SQ, Chen NA, Jiang QN, Huang LL, Qi JX et al. Nuclear translocation of OsMADS25 facilitated by OsNAR2.1 in reponse to nitrate signals promotes rice root growth by targeting OsMADS27 and OsARF7. Plant Commun. 2023;4(6):100642.
Alfatih A, Zhang J, Song Y, Jan SU, Zhang ZS, Xia JQ et al. Nitrate-responsive OsMADS27 promotes salt tolerance in rice. Plant Commun. 2023;4(2):100458.
Song X, Xiong Y, Kong X, Huang G. Roles of auxin response factors in rice development and stress responses. Plant Cell Environ. 2023;46(4):1075–86.
Article
CAS
PubMed
Google Scholar
Zhang S, Wu T, Liu S, Liu X, Jiang L, Wan J. Disruption of OsARF19 is critical for floral organ development and plant architecture in rice (Oryza sativa L). Plant Mol Biology Report. 2016;34:748–60.
Article
CAS
Google Scholar
Gho YS, Song MY, Bae DY, Choi H, Jung KH. Rice PIN auxin efflux carriers modulate the nitrogen response in a changing nitrogen growth environment. Int J Mol Sci. 2021;22(6):3243.
Zhang S, Zhu L, Shen C, Ji Z, Zhang H, Zhang T, et al. Natural allelic variation in a modulator of auxin homeostasis improves grain yield and nitrogen use efficiency in rice. Plant Cell. 2020;33(3):566–80.
Article
PubMed Central
Google Scholar
Zhang S, Wang S, Xu Y, Yu C, Shen C, Qian Q, et al. The auxin response factor, OsARF19, controls rice leaf angles through positively regulating OsGH3-5 and OsBRI1. Plant Cell Environ. 2015;38(4):638–54.
Article
PubMed
Google Scholar
Wu D, Cao Y, Wang D, Zong G, Han K, Zhang W, et al. Auxin receptor OsTIR1 mediates auxin signaling during seed filling in rice. Plant Physiol. 2024;194(4):2434–48.
Article
CAS
PubMed
Google Scholar
Cortes LT, Zhang ZW, Yu JM. Status and prospects of genome-wide association studies in plants. Plant Genome. 2021;14(1):e20077.
Curtin SJ, Tiffin P, Guhlin J, Trujillo DI, Burghardt LT, Atkins P, et al. Validating genome-wide association candidates controlling quantitative variation in nodulation. Plant Physiol. 2017;173(2):921–31.
Immunotherapy, particularly immune checkpoint inhibition, has revolutionized modern oncology by achieving durable remissions across a wide range of tumor types. Despite these transformative outcomes, only 20–30% of patientsexperience sustained benefit, underscoring a critical challenge in accurately predicting who will respond to treatment. The clinical and economic implications are substantial—given that the global ICI market is projected to surpass $189 billion by 2032, the urgency for precise, clinically actionable predictive tools has never been greater.
In this comprehensive and forward-looking review, Oisakede et al. explore the rapidly advancing field of predictive modeling for immunotherapy response, encompassing biomarker-driven strategies, artificial intelligence and machine learning algorithms, mechanistic modeling, and multi-modal integration frameworks. Drawing from more than 200 studies, the authors deliver one of the most extensive comparative analyses to date, evaluating predictive accuracy, clinical applicability, and translational readiness across emerging methodologies.
Key Findings and Conceptual Advances
Limitations of single biomarkers
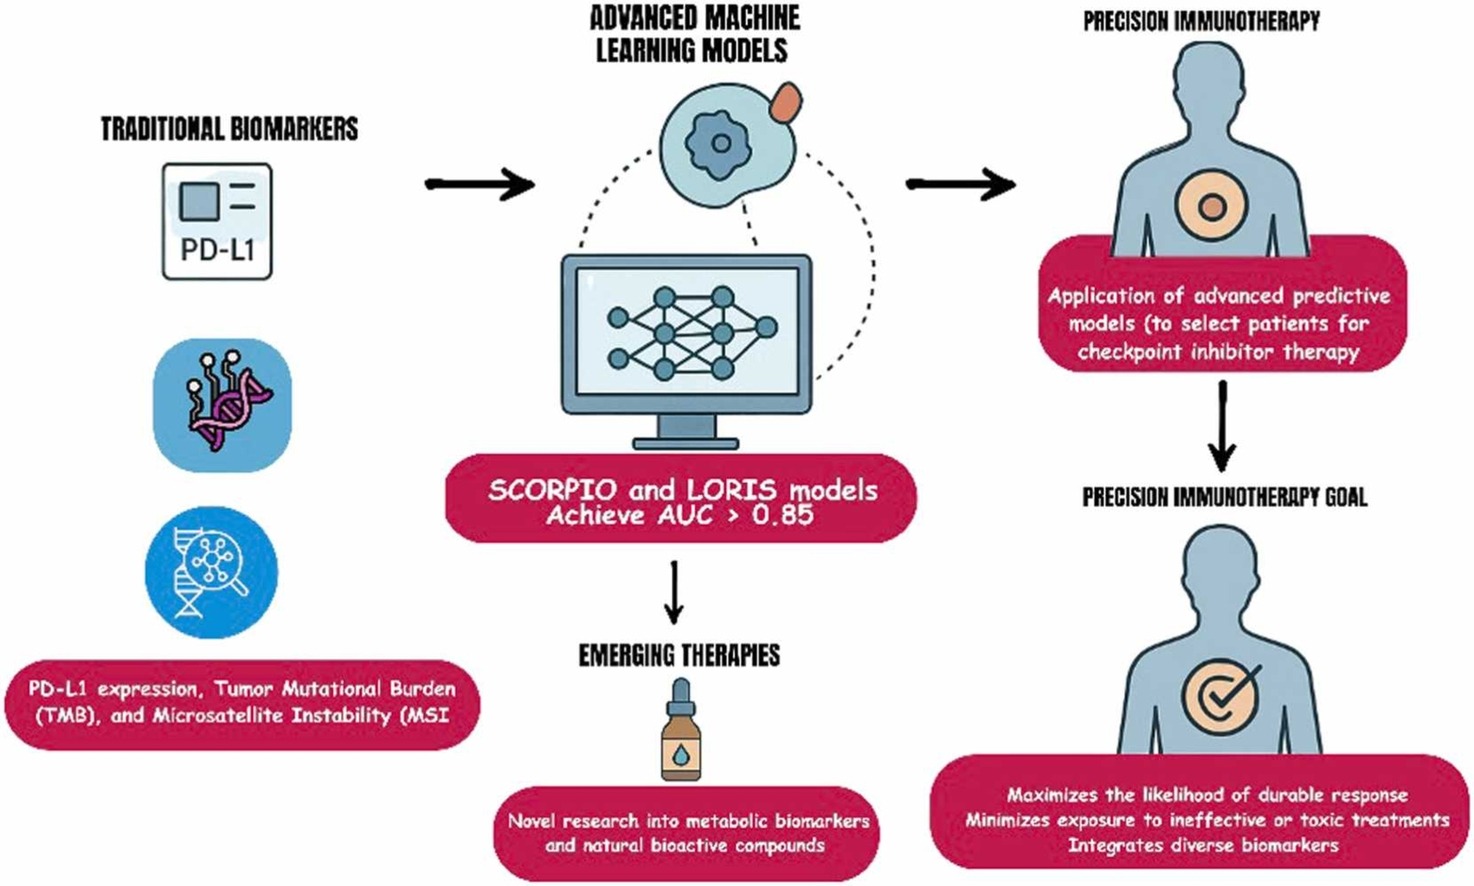
Traditional biomarkers—such as PD-L1 expression, tumor mutational burden (TMB), and microsatellite instability (MSI)—have long served as the foundation for selecting patients who might benefit from immune checkpoint inhibitors. However, their predictive accuracy remains limited.
PD-L1 expression, for instance, is predictive in only about 29% of FDA-approved indications, and both TMB and MSI show highly variable reliability across cancer types. These inconsistencies stem from biological heterogeneity, differences in testing platforms, and the complex interplay between tumor and immune factors.
The authors highlight that predicting immunotherapy response cannot rely on any single molecular marker. Instead, multi-parametric models—those integrating molecular, immunologic, and spatial data—are needed to capture the full biological context of the tumor microenvironment (TME).
The rise of metabolic biomarkers
Beyond genomics, metabolic reprogramming has emerged as a critical determinant of immune evasion and treatment resistance. Tumors with elevated expression of glucose transporters GLUT1 and GLUT3 exhibit enhanced glycolysis, creating an acidic microenvironment that suppresses T-cell activity. This glucose competition between tumor and immune cells not only limits immune effector function but also promotes immune exhaustion.
Incorporating these metabolic biomarkers into predictive models could refine patient stratification—particularly for tumors that are both metabolically active and immunologically “cold.” Such integrated models could help identify patients who may benefit from therapies that target both metabolism and immune regulation.
Artificial intelligence outperforms traditional biomarkers
Artificial intelligence (AI) and machine learning (ML) now represent the fastest-growing frontiers in predictive oncology. These approaches are capable of integrating high-dimensional clinical, molecular, and imaging data to uncover complex patterns not visible to human observers.
The SCORPIO model, developed at Memorial Sloan Kettering Cancer Center, analyzed data from nearly 10,000 patients across 21 cancer types and achieved an AUC of 0.76 for predicting overall survival—significantly outperforming PD-L1 and TMB.
The LORIS model, based on six routine clinical and genomic parameters (age, albumin, neutrophil-to-lymphocyte ratio, TMB, prior therapy, and cancer type), achieved 81% predictive accuracy and showed strong external validation across multiple international cohorts.
Deep learning approaches applied to histopathology images have further advanced predictive precision, enabling automated assessment of PD-L1 expression and tumor-infiltrating lymphocytes (TILs) with AUC values exceeding 0.9 in controlled research settings.
Despite these advances, one major challenge persists: external validation. Many AI models perform exceptionally well within the institution where they were developed but fail to maintain accuracy when tested on independent patient populations—a problem the authors refer to as the “validation gap.”
Integrating multi-modal data for precision prediction
Combining multiple types of data—genomic, spatial, clinical, and metabolic—has proven far more effective than using single-modality biomarkers. These multi-modal frameworks have achieved AUC values above 0.85 in several cancers, outperforming traditional metrics. For example, integrating PD-L1 expression, TMB, and immune cell infiltration patterns improved predictive power in non–small cell lung cancer and melanoma.
Modern spatial profiling technologies, such as multiplex immunofluorescence and digital spatial transcriptomics, now reveal how immune and tumor cells are organized within the TME. This spatial information often correlates more strongly with treatment response than bulk biomarker measurements, underscoring the importance of tumor architecture in predicting therapeutic outcomes.
Dynamic and mechanistic modeling approaches
A new generation of mathematical and systems biology models aims to simulate tumor–immune interactions in real time. These models capture key parameters—such as tumor growth kinetics, immune infiltration, and checkpoint blockade dynamics—to forecast treatment outcomes and understand resistance mechanisms.
Early studies show promising results: some of these mechanistic models can classify responders versus non-responders with up to 81% accuracy in pilot validation cohorts. Although still in early stages, these models complement data-driven AI approaches by offering a mechanistic understanding of immune dynamics, which could ultimately guide personalized dosing, combination strategies, and treatment adaptation.
Natural Compounds and Metabolic–Immune Crosstalk
A novel section of the review explores the integration of natural bioactive compounds—such as thymoquinone (Nigella sativa), cucurbitacins (Cucurbitaceae), and organosulfur compounds (garlic derivatives)—which have demonstrated immunomodulatory and metabolic reprogramming effects in preclinical studies. These agents may augment ICI efficacy by:
Reducing tumor glycolysis and acidosis;
Enhancing T-cell function and cytokine production;
Such multi-target actions highlight a potential role for metabolic–immune combinatorial therapy, though clinical validation remains limited.
Implementation Challenges
The review identifies three persistent barriers that hinder translation from research to practice:
Validation and reproducibility: promising models rarely replicate performance outside their development cohort.
Data standardisation: inconsistencies in biomarker assays, imaging platforms, and sequencing pipelines undermine generalisability.
Healthcare integration: lack of interoperability between predictive algorithms and clinical information systems delays implementation in real-world oncology workflows.
The authors call for international standardisation frameworks, similar to those of the Global Alliance for Genomics and Health (GA4GH), to harmonise data collection, model validation, and AI governance in oncology.
Significance
This landmark review represents one of the most comprehensive syntheses of predictive model development in immuno-oncology. It bridges traditional pathology and next-generation computational science, highlighting the need for multidisciplinary collaboration among pathologists, oncologists, data scientists, and regulatory bodies. By systematically evaluating every major class of predictive approach—from PD-L1 scoring to AI integration—this work outlines a roadmap for clinically implementable, validated, and interpretable models capable of guiding patient selection and optimizing immune checkpoint inhibitor therapy.
Key Takeaway Messages
ICIs benefit only a minority of patients; precision prediction is critical for therapeutic success.
AI and multi-modal models outperform traditional biomarkers, but external validation remains the main translational bottleneck.
Integration of metabolic and spatial biomarkers provides new biological dimensions for prediction.
Natural bioactive compounds may enhance checkpoint inhibitor efficacy via metabolic and immune modulation.
Future success depends on global standardisation, real-time adaptive modeling, and clinically interpretable AI integration.