[music]
SIGNÉ: Hello, I am Landry Signé, a senior fellow at the Global Economy and Development Program and at the Africa Growth Initiative at the Brookings Institution. Welcome to the Foresight Africa podcast, where I engage with distinguished leaders in policy, academia, business and civil society who share their unique insights and innovative solutions to Africa’s challenges while highlighting opportunities to advance engagements between Africa and the rest of the world.
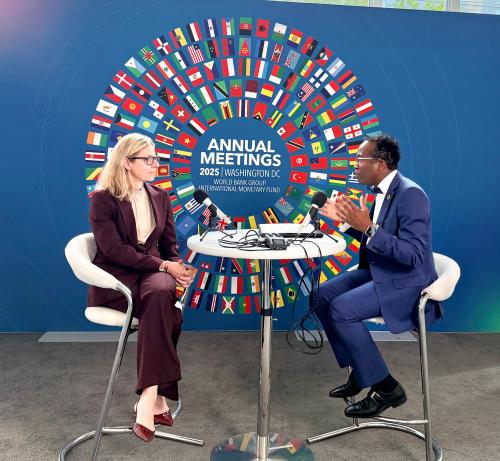
Today we are fortunate to be meeting on the sideline of the World Bank Group and International Monetary Fund Annual Meetings, a yearly gathering of the world’s most prominent figures in the development finance space such as central bankers, ministers of finance, but also heads of global and regional financial institutions, corporate CEOs, entrepreneurs, and civil society leaders.
Before we begin could you please state your full name and title for the recording. Welcome to the Foresight Africa podcast.
BJERDE: I am Anna Bjerde, the managing director of operations at the World Bank.
SIGNÉ: Welcome to the Foresight Africa podcast. I am delighted to have you join me during this busy week, and I truly appreciate you taking the time to share your insight with our audience.
BJERDE: Wonderful to be here. Thank you so much for having me.
SIGNÉ: Amazing! As you take part of this year’s Annual Meetings, which priorities do you see as most essential for driving sustainable and inclusive growth and why?
[2:06]
BJERDE: So thank you so much for that question. The most pressing, challenge, but also the biggest opportunity lies in creating jobs. And that is what we here at the World Bank Group has made really the focus, or laser focus, I should say, of all of our efforts.
And that is very much because what we’re seeing is that over the next decade we will have over a billion people come into the job market looking for work. And there’s simply not enough jobs the way we’re projecting it to be able to meet this demand for jobs.
So we have been working hard to come up with a plan for this, essentially, and I’ll just briefly summarize it. It comprises three pillars in the form of an approach. The first one is to invest in what we call foundational infrastructure, and that is both the physical infrastructure like energy, roads, ports, digital, but also the soft infrastructure: human capital enabling, health, education.
The second is to make sure that we have an enabling environment that really is conducive. And that means having stable policy and regulatory environments. That means focusing on the business environment, rule of law. A big issue in many countries is how is land allocated? And of course also the overall investment climate.
And the third pillar is all about attracting and mobilizing the private sector for both capital, but also for skills and innovation. And we believe those three together is what’s going to make a huge impact in the aspiration to create jobs.
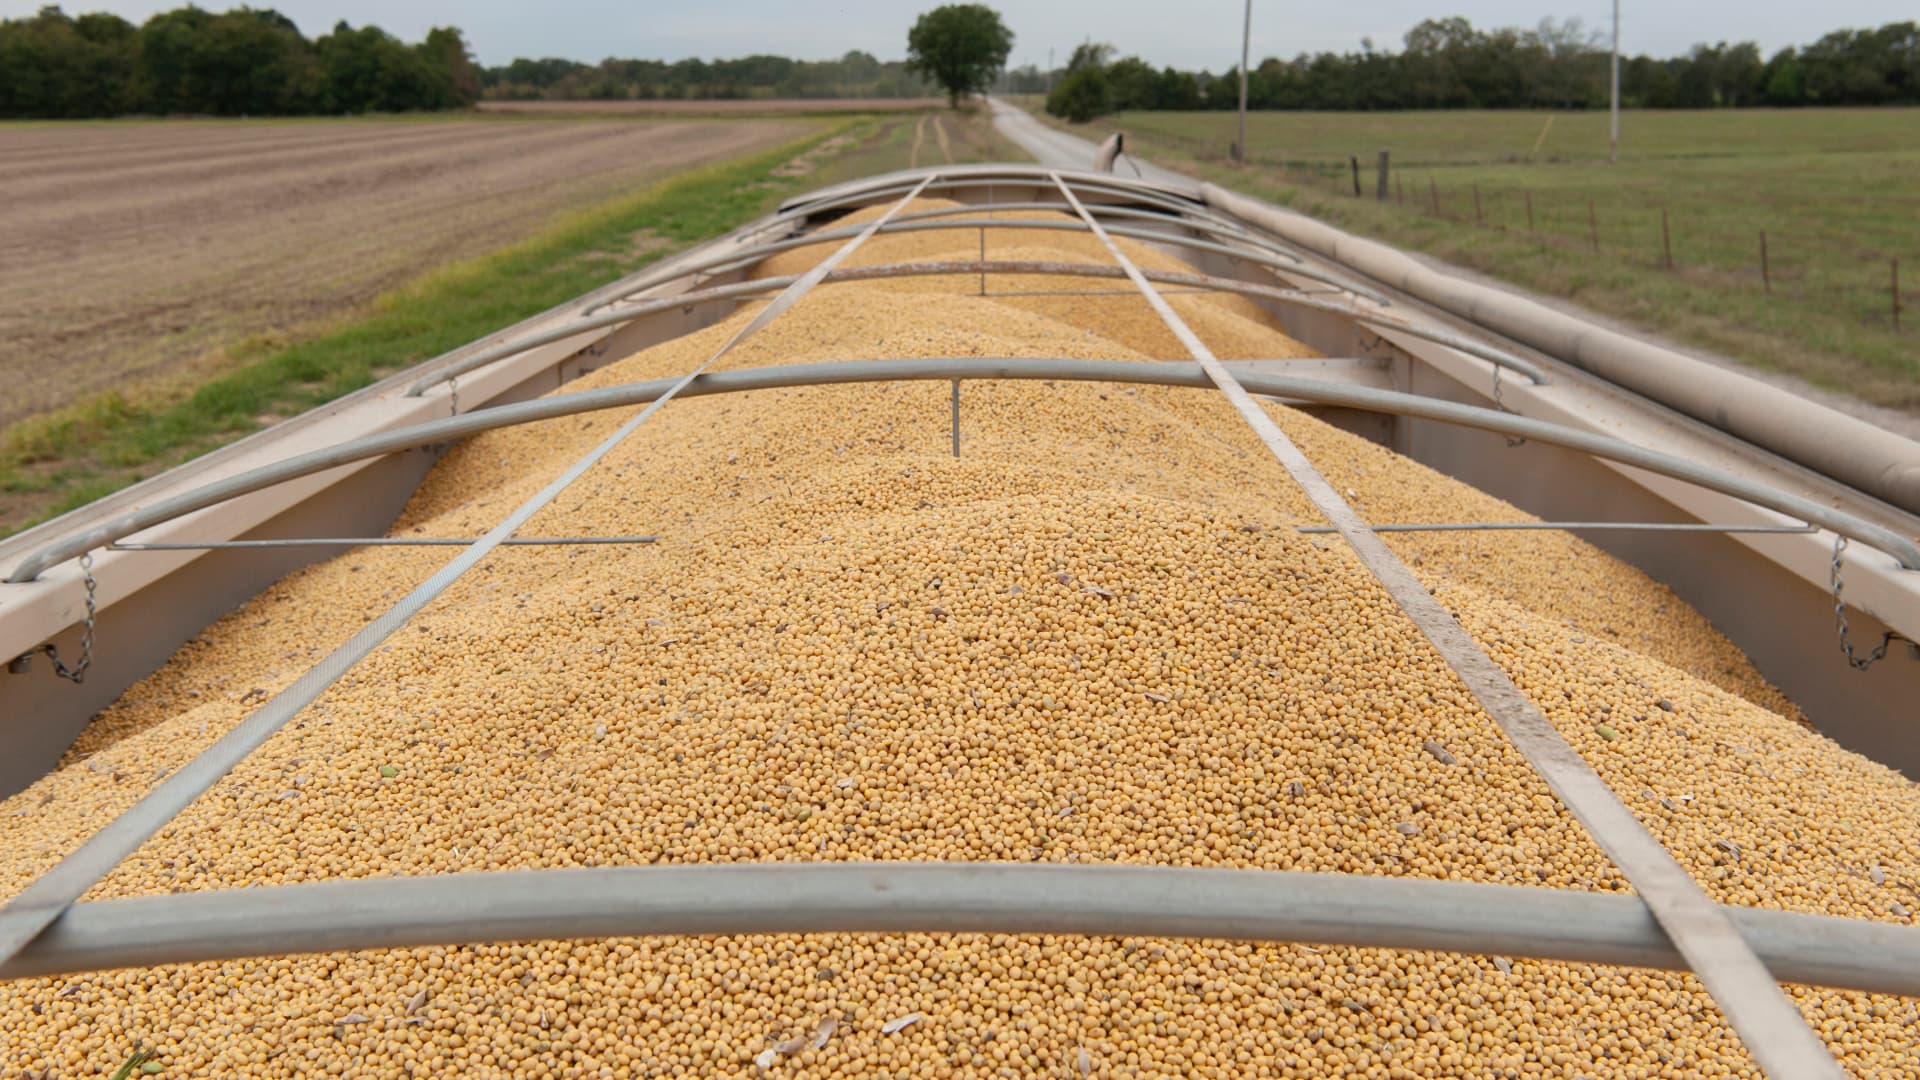
If I may, just very quickly, we want to take those three approaches or three pillars through essentially five sectors that we believe are particularly prone to job creation. One is, again, infrastructure. The second is health care. Why? Because people have to be healthy. But we also believe that the health care sector and industry lends itself to jobs. The third one is the very important sector of agriculture, which I hope to get a chance to speak again about. And then we have tourism, which is a very, very significant industry to attract young people and women. And the final one is what we call value-added manufacturing.
All of this, the three approaches, the five sectors. And then of course, initiatives like one of my favorite Mission 300, which is all about electricity in Africa, is what we think is going to set us apart.
SIGNÉ: Fantastic! I really like the comprehensive, multi-stakeholder, agile approach. What insights or lessons from these discussions or from your broader work should global leaders act to strengthen resiliency, and address today’s most pressing economic and social challenges?
[5:03]
BJERDE: Yes. So here if I may, let me maybe think about Africa because for us, our work in Africa is so important. And if I go back to this question of what are some of the most pressing issues in Africa, again, I come to jobs. And in Africa what we really need is to focus on job creation by focusing on the new growth model, because Africa is going through its most significant and largest demographic shift in its history. We anticipate that the working age population looking for jobs in Africa will increase by 600 million by 2050, and the current growth model just won’t be able to meet this or step up to it.
So what we would very much like to do is focus on changing this. Why? Because too many people in Africa enter the job market in such a way that it’s low productivity, it’s informal, and it gives very little upside for income generation, poverty reduction, or even upward mobility.
So we want to focus on two things. The number of jobs, but not only the number of jobs, the quality of jobs, because without the quality, we won’t address the issue around productivity, informality, and upward mobility. This requires, first and foremost, that the private sector can play a larger role. And not just any private sector — medium and larger firms, because we know jobs get created when firms grow.
And that’s why we are really focusing, again, on the infrastructure needed, the foundation infrastructure, the business environment, and the enabling conditions, and of course, private capital mobilization.
SIGNÉ: Fantastic! Quality job creation as a development escalator and the private sector as a development agent.
BJERDE: Perfect.
SIGNÉ: So how are international institutions adapting their mandates and instruments to an evolving geopolitical trade economic landscape? And where can they most effectively lead transformative change?
[7:17]
BJERDE: Yeah, great question. So we have been focusing on speed, impact, and scale. Speed by cutting the time it takes us to get any kind of project approved. So we have reduced by 26% last year compared to the previous year, and we’re not done yet. We want to go even faster.
Second, we want to focus more, and we have reduced our indicators that we track from about 150 to 22, just to allow us to be more focused on what really matters.
And scale. We have been able to, through a number of different innovations, make more funding available to developing countries. So we have another hundred billion dollars in exposure over the next 10 years.
But I want to also emphasize another thing which is so important. We’re changing our business model in that we’re capitalizing more on our parts. We have the public sector, the private sector. We have a guarantee mechanism and global, what we call the Unified Guarantee platform. And we have a settlement and disputes agency. So between all of these parts, we are internally becoming much more cohesive to offer our clients something much stronger. And outside, it’s all about partnerships.
SIGNÉ: Fabulous! That is powerful and thank you so much for sharing so beautifully the instruments to address some of those challenges. What bold actionable ideas from this week do you see shaping global policy and practice, and how do you plan to translate them into tangible results?
[8:55]
BJERDE: So we are very excited because this week we will be launching a new bold idea, and it’s all about agriculture, because we cannot reduce poverty without supporting farmers. And we want to support farmers through what we call a comprehensive ecosystem. We want farmers to have access to technology, data, and finance. And by doing so, they will be able to transform their agricultural practices into businesses and be able to reduce poverty in and of itself, but also do things like secure food for the future, and to be able to trade among themselves, and be able to come up with innovations thanks to both the technology, the data, and the access to finance.
So, we’re excited about this. Recently we announced that we will go to $9 billion a year by 2030. That’s doubling our support to the sector, in addition to mobilizing another $5 billion. So watch this space for some very interesting work around agriculture, which we believe is going to be an incredible contribution to the work we’re trying to do on poverty reduction.
SIGNÉ: What a beautiful way to conclude. Thank you so much for joining me today.
[music]
BJERDE: Thank you so much for having me. Really appreciate it.
SIGNÉ: I am Landry Signé, and this has been Foresight Africa. This is the final episode of season four of the podcast. Thank you, listeners, for joining me today and throughout the season. Stay tuned for season five to start early next year.
The Foresight Africa podcast is brought to you by the Brookings Podcast Network. Send your feedback and questions to podcasts at Brookings dot edu. My special thanks to the production team including Fred Dews, producer; Dafe Oputu and Nicole Ntungire, associate producers; Gastón Reboredo, audio engineer; and Izzy Taylor, senior communications coordinator in Brookings Global. The show’s art was designed by Shavanthi Mendis.
Additional promotional support for this podcast comes from my colleagues in Brookings Global and the Office of Communications at Brookings.