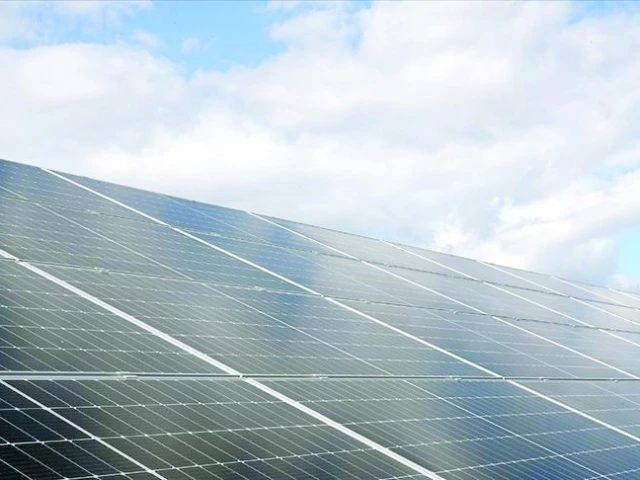
Solar panel. Photo: ANADOLU AGENCY
KARACHI:
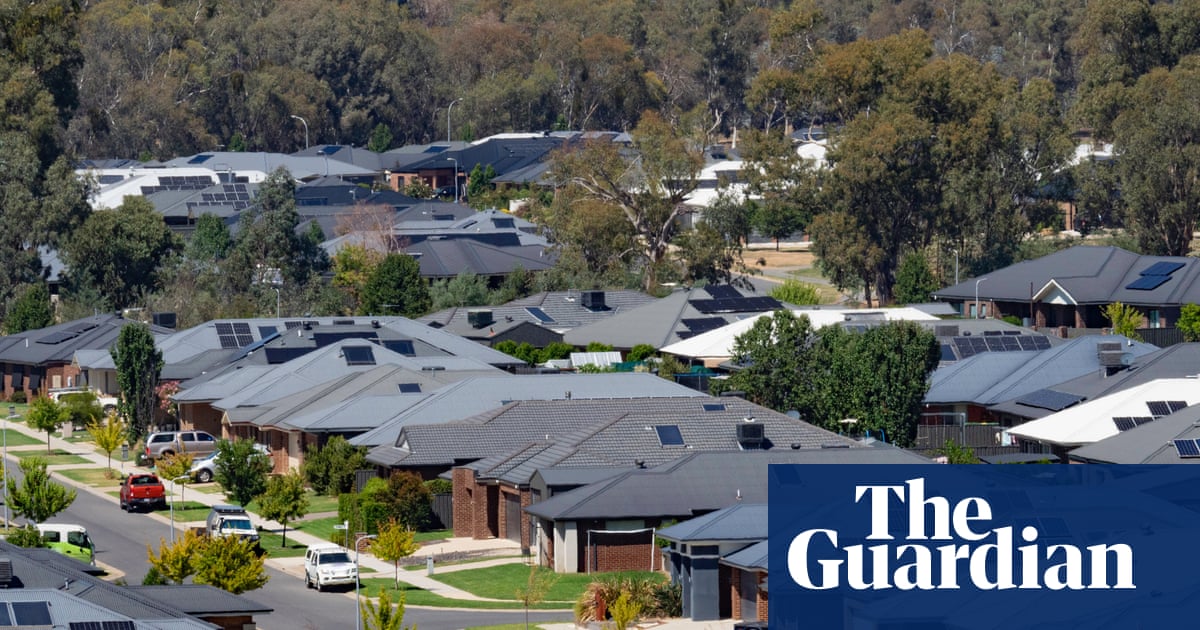
The roof of a sprawling rice mill in the eastern district of Pakistan’s commercial capital Karachi is covered with sky blue solar panels soaking rays under the broiling midday sun.
The mill is one of thousands of industrial units across Pakistan that have shifted to solar energy to counter rising electricity tariffs and frequent power outages in recent years.
The South Asian country of around 255 million people has witnessed a solar uptake, particularly over the past two years, after an International Monetary Fund (IMF) bailout forced Pakistan to sharply raise power and gas tariffs to support struggling suppliers in the heavily indebted energy sector.
From pharmaceuticals to cement manufacturers in Karachi, to textile units in Faisalabad, and from supermarkets to mosques in Lahore, solar panels paired with lithium batteries have been adopted as an alternative to electricity from the national grid.
“We were left with no other choice but to go for solar energy, as the power bills had literally become unpayable for industrialists,” Rafique Suleman, the owner of the mill, told Anadolu.
Suleman said that turning to solar has “really” helped him mitigate the tariff challenge, saving up to 50% of his monthly power-related expenses.
“The current power tariffs and Pakistan’s industry cannot survive together. Solar energy is the only viable option that local industrialists have to run their businesses,” added Suleman, a former chairman of the country’s rice exporters association.
Mehwish Salman Ali, chief executive officer of Data Vault Pakistan, a leading data provider and management solutions company, views solar solutions as a “game-changer” that helps the country tackle chronic energy deficits by providing affordable and reliable power to homes and businesses.
“From crippling blackouts and insane sky-high bills, we’ve seen solar’s share in electricity generation triple to 14% by 2025, with rural areas hitting 25% in the early months alone, filling the gaps where the grid fails us,” Ali told Anadolu.
Pakistan’s solar penetration ranks it among Asia’s leaders for solar-only share, surpassing nations like China (9%) and India (6%), according to Ember, a UK-based energy think tank.
Environmental challenges
Although solar solutions have contributed significantly to reducing energy gaps, environmentalists warn that electronic waste is adding to a long list of environmental challenges already plaguing the country.
Pakistan ranks among the top 10 countries most affected by climate change.
The country’s solar adoption has accelerated rapidly since 2015 due to rising electricity tariffs, frequent power shortages, falling panel prices, and net-metering incentives.
Currently, Pakistan is estimated to have around 3 million consumers using solar systems, including off-grid, according to the Seventh Population & Housing Census 2023. China exported 16.6 gigawatts of solar capacity to Pakistan in 2024, about five times higher than in 2022.
“While solar energy is a clean and renewable power source, the electronic waste (e-waste) generated from its components – particularly solar panels, inverters and batteries – is an emerging environmental challenge in Pakistan and worldwide,” Rafiul Haq, a Karachi-based environmentalist, told Anadolu.
Most systems use lead-acid, lithium-ion, or gel batteries and panels with lifespans between 10 and 25 years. When these reach the end of their life, they become electronic waste, often unmanaged, Haq added.
Endorsing the view, Ali said that without affordable solar options, the energy gap widens, increasing dependence on fossil fuels, which harms the environment and hinders progress toward sustainable development. A 2023 United Nations Development Program (UNDP) report estimated that over 80% of Pakistan’s lead-acid battery recycling is unregulated, exposing workers and nearby communities to neurotoxic lead.
Pakistan currently has no dedicated solar or battery recycling facility, according to Haq.
He said the first wave of solar panels installed between 2010 and 2015 is now approaching end-of-life. Without a recycling system, millions of panels could generate thousands of tons of e-waste annually over the next decade.
“The solution lies in strong recycling legislation, formal waste collection systems, and producer responsibility frameworks – turning clean energy into a truly sustainable system,” Haq maintained, calling for the establishment of a “National Solar E-Waste Management Framework.”
Mustafa Amjad, an Islamabad-based energy expert, said the existing power system “isn’t really ready for all of that solar. It does not mean it does not have to be ready. It will still have to make that journey, a bit earlier than initially thought out,” he told Anadolu.
“And it would need new regulatory structures.”
Social division
Waqar Phulpoto, director general of the Sindh Environment Protection Authority (SEPA), contended that the electronic waste issue is not alarming for now.
“This is a reality, and it is for sure going to be an environmental challenge. But at the moment, its extent is not huge, as Pakistan has logged a boom in solar adoption over the past five years,” Phulpoto told Anadolu.
SEPA is considering introducing legislation and guidelines “soon” to tackle the electronic waste issue, he said, adding: “It will be done well before this issue (electronic waste) becomes an actual challenge,” Phulpoto said.