China’s import-export hit a record US$6.36 trillion in 2025, buffering against domestic weakness amid increasing geopolitical tensions. High-tech and green exports have replaced low-cost manufacturing as the primary growth engine.
Against a backdrop of geopolitical fragmentation, slowing global demand, and persistent trade protectionism, China’s foreign trade performance in 2025 underscored the adaptability of the world’s second‑largest economy. Total imports and exports reached a record RMB 45.47 trillion (US$6.36 trillion), marking a 3.8 percent year‑on‑year increase and affirming China’s continued centrality to global trade flows. Export growth remained the primary driver, rising 6.1 percent to RMB 26.99 trillion (US$3.77 trillion), while imports showed tentative recovery, edging up 0.5 percent to RMB 18.48 trillion (US$2.58 trillion).
Beyond the aggregate numbers, the data reflects a deeper shift underway. China is moving decisively away from its traditional role as a low‑cost manufacturing hub toward a trade profile anchored in high‑end manufacturing, green technologies, and strategically diversified markets. Expanding trade ties with ASEAN and Belt and Road partners have reduced exposure to geopolitical friction with developed economies, reinforcing China’s position not only as a global production center, but also as an increasingly sophisticated consumer and innovation market for multinational companies.
Overview of China’s import-export in 2025
The trade surplus set a record
A defining feature of China’s 2025 trade landscape was the widening import‑export gap, which pushed the annual trade surplus past the US$1 trillion threshold for the first time, reaching a record US$1.19 trillion. This divergence was driven primarily by sustained export momentum, which continued to outpace the relatively modest increase in imports, bringing total import value to US$2.65 trillion.
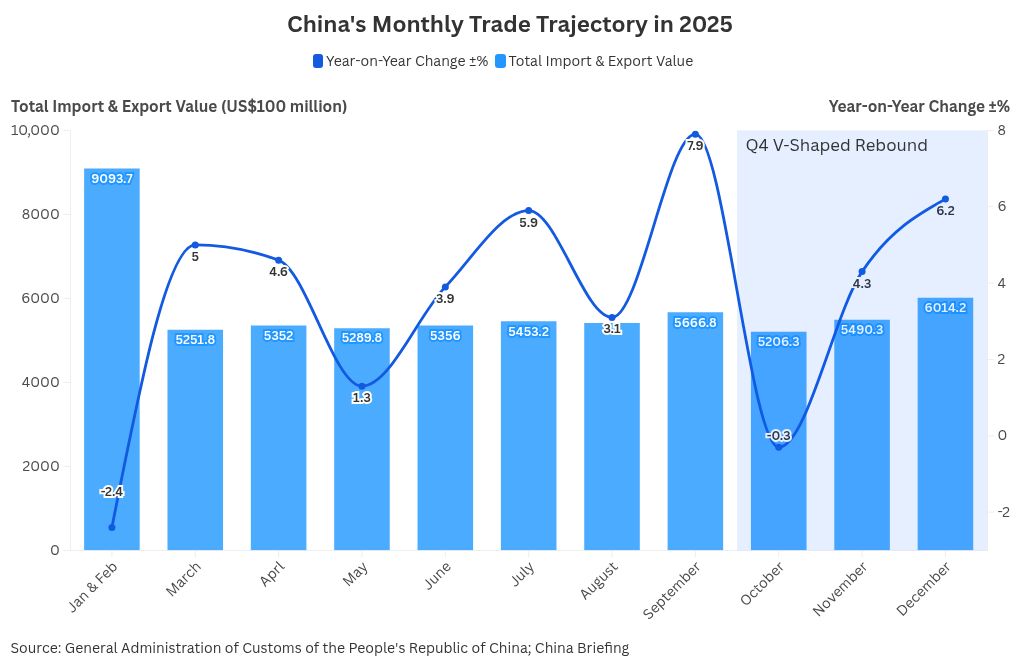
From a temporal perspective, trade performance followed a distinct V‑shaped trajectory over the course of the year. After a sluggish start marked by contraction in the first two months, trade activity stabilized in the second quarter before gaining momentum through the second half of the year. This acceleration culminated in December, when monthly imports and exports reached a new record of US$617 billion. In dollar terms, exports exceeded market expectations with a 6.6 percent year‑on‑year increase, while imports also accelerated, rising 5.7 percent and signaling a strong finish to the year.
This resilience was not cyclical alone, but structural in nature, underpinned by consistent policy support aimed at stabilizing foreign trade throughout 2025. In response to rising protectionism and heightened external uncertainty, Beijing rolled out targeted measures to stabilize export orders, support trade‑oriented enterprises, and encourage market diversification. These interventions helped buffer external shocks and sustain trade activity. As a result, China achieved positive import growth for three consecutive quarters starting in Q2, further supported by the scale and depth of its domestic market.
Structural shift in export landscape
China’s export performance in 2025 was defined by a clear divergence between technology‑intensive sectors and traditional labor‑intensive goods, underscoring the country’s ongoing industrial upgrading. Mechanical and electrical products remained the backbone of outbound shipments, delivering consistent year‑on‑year growth of around 8 percent throughout the year and accelerating to 8.4 percent in December. High‑tech exports mirrored this trajectory, expanding steadily and ending the year with a strong 7.5 percent annual increase, reflecting robust external demand for electronics, advanced machinery, and technology‑enabled products.
In contrast, traditional manufacturing categories faced persistent downward pressure. Exports of garments, footwear, furniture, toys, and travel goods declined on a year‑on‑year basis throughout 2025, with contractions deepening toward year‑end. Apparel and footwear exports, for example, fell by more than 10 percent year‑on‑year in December, highlighting both weak global consumer demand and intensifying competition in price‑sensitive markets. Textile exports proved comparatively more resilient, hovering close to flat growth by year‑end, suggesting partial stabilization rather than a full recovery.
Resource‑ and material-related exports showed mixed dynamics. Steel and aluminum products recorded mild contractions, while fertilizer exports surged mid‑year before tapering off, indicating sensitivity to global commodity cycles and seasonal demand. Agricultural exports stood out for their stability, maintaining low but positive growth across all months.
Overall, the 2025 export landscape reflects a structural shift toward higher‑value, technology‑driven growth, even as traditional sectors continue to adjust to global demand rebalancing and price pressures.
The most explosive growth occurred in the “New Three” industries: electric vehicles (EVs), lithium batteries, and solar products. Combined exports for these green technologies surged 27.1 percent in 2025. Within this green energy ecosystem, specific niches saw hyper-growth:
- Wind power: Exports of wind turbine generators jumped 48.7 percent.
- Batteries: Lithium battery exports grew 26.2 percent.
- Green transport: Exports of electric motorcycles and railway locomotives increased by 18.1 percent and 27.1 percent, respectively.
Beyond green energy, broader high-tech product exports climbed 13.2 percent to reach US$750 billion. A significant milestone in 2025 was China’s transition into a net exporter of industrial robots. Exports of industrial robots surged 48.7 percent, signaling that domestic technology has matured enough to compete in advanced automation markets globally. Similarly, exports of high-end machine tools and specialized equipment rose by over 20 percent, further eroding the market share of traditional industrial powers.
Diversification of trading partners
The 2025 data confirm a definitive geopolitical realignment of China’s supply chains. Trade with BRI partner countries reached US$3.39 trillion, capturing 51.9 percent of China’s total trade value. This majority share represents a critical structural hedge. By prioritizing these markets, China has partially insulated its export engine from Western decoupling pressures, building a trade ecosystem less dependent on G7 demand cycles.
ASEAN solidified its position as China’s largest trading partner, with total bilateral trade exceeding US$1.02 trillion. This relationship has evolved from simple commodity exchange to deep industrial integration, with Southeast Asia increasingly serving as the primary extension of China’s manufacturing base. Beyond Asia, the “Global South” delivered the year’s most impressive growth stories:
- Africa: Trade surged 18.4 percent, driven by China’s export of heavy machinery and infrastructure projects, which offset weaker consumer demand elsewhere.
- Latin America: Trade grew 6.5 percent, deepening ties in agricultural supplies and industrial equipment.
In stark contrast, trade with the United States (US) contracted sharply. Exports to the US fell 20 percent, while imports declined 14.6 percent. However, businesses must interpret this data with nuance. Rather than a simple evaporation of demand, much of this contraction likely reflects supply chain rerouting. Chinese intermediate goods are increasingly shipped to third-party hubs, such as Vietnam or Mexico, for final assembly before entering the U.S., masking the continued interdependence of the two economies.
The picture with the European Union (EU) is mixed. While overall volume growth has slowed compared to emerging markets, sectoral integration remains tight. Notably, European automotive parts and healthcare products continue to see robust demand in China, while Chinese green technology exports to the EU grew 11.5 percent in December, defying broader protectionist headwinds.
This shift may suggest that the “China + 1” strategy is evolving to more regionalized supply-chain configurations. It is no longer just about alternative sourcing, but about regionalized supply hubs. China is transitioning from a final assembly point for the West to the core industrial engine supplying intermediate goods to Southeast Asia and the BRI nations. Consequently, strategies are shifting from “In China, For China” to “In China, For Global,” leveraging the Chinese mainland supply chains to serve high-growth markets in the Global South.
Import dynamics and domestic demand
Despite modest full‑year growth of just 0.5 percent, China’s imports followed a clear V‑shaped recovery pattern in 2025. Year‑on‑year declines persisted from January to May, bottoming out at ‑8.4 percent in the January-February period, before giving way to a steady rebound from June onward. Import growth peaked at 7.4 percent in September and remained resilient through year‑end, closing December at 5.7 percent. This improvement was led primarily by industrial input, reflecting stabilizing manufacturing activity and firm underlying production demand despite continued price headwinds.
On the other hand, beneath the surface of China’s flat headline import growth lies a story of resilient industrial demand and evolving consumer tastes. The import growth figure was heavily suppressed by a global dip in commodity prices. A closer look at volumes reveals a robust industrial appetite that the dollar figures obscure.
The “price effect” created a divergence between value and volume in 2025. While the import value of key industrial commodities barely moved, physical volumes surged, confirming that China’s factory floors kept humming.
- Crude Oil: Import volumes increased by 4.4 percent, signaling steady energy needs for manufacturing and transport, even as import value settled at US$295.2 billion.
- Iron Ore: Import volumes climbed 5.2 percent, driven by infrastructure projects and machinery production, with total value reaching US$122.7 billion. This divergence confirms that the “sluggish” import growth was a monetary phenomenon, not a reflection of collapsing domestic activity.
Meanwhile, despite national self-sufficiency campaigns, China remains deeply integrated into global supply chains. Integrated circuits were the single largest import item, with full-year imports surpassing US$424 billion. This massive inflow underscores a critical reality for foreign tech firms: China’s demand for advanced processing power continues to outpace its domestic capacity, making it a vital market for global semiconductor majors.
While discretionary spending on big-ticket items like property softened, household consumption showed resilience in specific high-quality segments. Imports of “lifestyle” agricultural goods outperformed the broader market, signaling a continued upgrade in consumption habits among the middle class. For example:
- Edible vegetable oil: Imports surged 16.6 percent year-on-year to US$8.6 billion.
- Fresh & dried fruits: Imports grew 5.6 percent to US$19.4 billion. These bright spots indicate that Chinese consumers are prioritizing premium food and health products, offering a clear growth avenue for global agricultural exporters.
The 2025 import profile clarifies where commercial opportunities are becoming more concentrated. The “China opportunity” is narrowing but deepening in two specific lanes: high-tech components that China cannot yet manufacture at scale and premium consumer goods that cater to a discerning middle class. Exporters positioning themselves in these “deficit gaps” will find robust demand, regardless of the broader macroeconomic headwinds.
The role of private enterprise
In 2025, private enterprise did not just participate in China’s trade resilience but engineered it. The data confirms that private firms have cemented their status as the “main engine” of the country’s external economy, effectively decoupling their performance from the slower-moving state-owned sector.
Private companies generated US$3.74 trillion in import and export value, a 7.1 percent increase year-on-year. This growth outpaced the national average, pushing the private sector’s share of total foreign trade to a commanding 57.3 percent. For foreign investors, this metric is a crucial indicator: the vitality of China’s market is now overwhelmingly driven by non-state actors, who comprise over 80 percent of the 780,000 entities with active trade records.
The agility of private firms proved decisive in navigating the geopolitical fractures of 2025. Unlike larger, policy-bound state-owned enterprises (SOEs), private exporters were faster to pivot supply chains and sales networks toward emerging markets. They were the primary drivers of double-digit trade growth in Africa and Latin America, rapidly customizing products, from affordable smartphones to agricultural machinery, to meet local market needs. This adaptability allows them to capture market share in regions where Western competitors are often slower to mobilize.
Crucially, 2025 signaled a maturity milestone as Chinese firms are moving aggressively from original equipment manufacturing (OEM) to original brand manufacturing (OBM). Exports of products under “self-owned brands” grew by 12.9 percent, significantly faster than the headline export rate. This surge drove the share of branded exports up by 1.4 percentage points. This shift warns global competitors that Chinese rivals are no longer content with razor-thin margins on contract manufacturing; they are capturing the premium value of brand equity, competing directly on identity and reputation in global markets
Outlook for 2026 and challenges ahead
Looking ahead to 2026, China’s foreign trade is expected to remain resilient but more constrained, shaped by a combination of slowing global momentum and ongoing structural upgrading at home. Export growth is likely to moderate to around 4 percent, down from 2025 but still outperforming the global average, as market diversification and product upgrading continue to offset external headwinds. The deeper drivers of this resilience lie in China’s highly complete industrial chain and entrenched competitiveness in key manufacturing segments, even as global trade growth slows and protectionist barriers multiply.
The reconfiguration of global supply chains is paradoxically accelerating China’s export upgrade from mid‑ to low‑end consumer goods toward higher‑value intermediate and capital goods. Demand from emerging markets such as ASEAN, Africa, and Latin America will remain a core support, fueled by faster industrialization and continued reliance on Chinese intermediate inputs and equipment. At the same time, global investment in AI computing capacity is expected to sustain strong demand for China’s power equipment and data‑center‑related exports. That said, policymakers face a balancing challenge: guarding against excessive short‑term declines in labor‑intensive exports that could create employment pressures.
By market, 2026 may see a pattern of narrowing drag from the US and easing momentum in non‑US markets, though the latter will remain the primary growth engine. A potential easing of US‑China tariff tensions, combined with expansionary US fiscal and monetary policies, could help stabilize bilateral trade. Meanwhile, exports to ASEAN, Latin America, and the EU should stay firm, though growth may cool modestly due to higher base effects from transshipment trade and tightening regulatory and trade rules in advanced economies.
On the import side, China is likely to rely more heavily on domestic stimulus and institutional opening‑up to stabilize demand. Continued “trade‑in” programs for appliances and automobiles, expansion of Free Trade Zones, and deeper integration under RCEP and the China‑ASEAN FTA 3.0 will support both imports and regional trade integration. Strategically, 2026 points toward localization and insulation as key trade themes: firms that anchor production in China for the domestic market, while leveraging ASEAN as a regional connector, will be best positioned to navigate an increasingly fragmented global trade environment.
Dezan Shira & Associates provides supply chain and tariff advisory to help businesses improve resilience, optimize sourcing, and manage cross-border exposure. From supplier consolidation in China to expansion into Vietnam, India, or ASEAN, we support partner identification, due diligence, tariff engineering, and continuity planning. Backed by 30+ years of experience, we help businesses build agile, future-ready supply chains. To arrange a consultation, please contact China@dezshira.com.
About Us
China Briefing is one of five regional Asia Briefing publications. It is supported by Dezan Shira & Associates, a pan-Asia, multi-disciplinary professional services firm that assists foreign investors throughout Asia, including through offices in Beijing, Tianjin, Dalian, Qingdao, Shanghai, Hangzhou, Ningbo, Suzhou, Guangzhou, Haikou, Zhongshan, Shenzhen, and Hong Kong in China. Dezan Shira & Associates also maintains offices or has alliance partners assisting foreign investors in Vietnam, Indonesia, Singapore, India, Malaysia, Mongolia, Dubai (UAE), Japan, South Korea, Nepal, The Philippines, Sri Lanka, Thailand, Italy, Germany, Bangladesh, Australia, United States, and United Kingdom and Ireland.
For a complimentary subscription to China Briefing’s content products, please click here. For support with establishing a business in China or for assistance in analyzing and entering markets, please contact the firm at china@dezshira.com or visit our website at www.dezshira.com.