Category: 3. Business

  • Strong mismatch in climate change adaptation between intentions of private forest owners in Canada and institutional support

    Strong mismatch in climate change adaptation between intentions of private forest owners in Canada and institutional support

    Unprecedented adaptation intentions among Canadian private forest owners

    We found that our sample of Canadian forest owners and practitioners exhibit a strong intention to adapt, with 92.1% of the 611 participants willing to adopt at least one adaptation strategy (Fig. 1). Even when excluding ‘laissez-faire’, which could be seen as a passive strategy that requires minimal intervention or resource investment, the adaptation intention rate remains high at 79.6%. For comparison, adaptation intentions among foresters in similar studies worldwide are notably lower, with rates of only 18% in France32 and eastern Oregon10 and 25% to 40% in Sweden28,33. Although adaptation intentions can vary depending on the timeframe for taking action or the wording of the survey questions, these findings represent an unprecedented level of commitment.

    Fig. 1: Respondents are willing to implement multiple adaptation strategies within the next ten years.

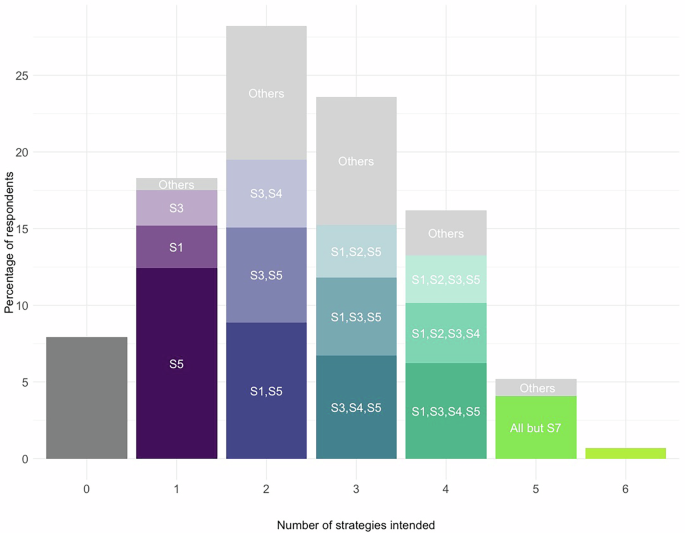
    Bars represent the percentage of respondents for each strategy (S) they intend to implement (0–6). Each color within the bars indicates a specific combination of strategies (S1–S6), with ‘Others’ representing less common combinations. Total number of respondents: 611. Adaptation strategies: S1, decrease stand density; S2, more frequent logging; S3, species diversification; S4, species replacement; S5, laissez-faire; S6, prescribed burning and fuel load reduction.

    While our sample of private forest owners shows a preference for certain adaptation strategies (Fig. 2), such as decreasing stand density (54.1%), a key finding of this study is the tendency to adopt multiple adaptation strategies, with 73.8% of respondents expressing intentions to implement two or more adaptations simultaneously (Fig. 1).

    Fig. 2: Willingness of forest landowners to implement each adaptation strategy.
    figure 2

    Most respondents intend to implement multiple strategies, hence strategies are not exclusive. Different letters indicate a posterior probability of ≥0.99 that mean-willingness differs between strategies. Scores to the left of the dashed line indicate a reluctance to adapt, while those to the right indicate a willingness to do so. Black lines denote a 95% equal-tailed credible interval for the mean willingness scores.

    At the lower end of the preference spectrum, ‘prescribed burning and fuel reduction’ is the least favored strategy, which aligns with respondents’ motivations related to timber production and the aesthetic value of landscapes, two major forest ecosystem services potentially impacted by this approach (Supplementary Fig. 1). Fire-resilient forestry also requires advanced technical skills and the highest level of coordination among forest owners, but private forest owners are completely—and notably—absent from Canada’s forest fire prevention strategies34.

    The most favored strategy, ‘laissez-faire’ (Fig. 2), requires the least effort and reflects a lower level of personal engagement in adaptive management. Yet, laissez-faire should not be confused with management cessation, as 95.5% of respondents intending to implement it are actively managing their forests.

    To identify the most influential covariates underlying the intention to adapt, we employed Bayesian predictive projection for variable selection35. This recent method employs cross-validation and takes into account the uncertainty in the posterior predictive distribution to identify a subset of explanatory variables that can sufficiently explain the outcome while avoiding overfitting. For this study, we set up predictive projection such that no other set of explanatory variables (including the full set of all variables) achieves better predictive performance than the subset that was selected (Fig. 3). Out of the 29 covariates selected based on their predictive performance (Fig. 3B), two belong to the category of demographic control variables, specifically private forest owners’ age and location in the province of Quebec (Fig. 4). The remaining covariates relate to personal stakes, threat appraisal, and coping appraisal, aligning directly with the protection motivation theory framework and revealing complex patterns in private forest owners’ willingness to adopt adaptation strategies (Fig. 3). However, the relevance of these covariates strongly differs between adaptation strategies (Fig. 3A): While sufficient predictive performance of the willingness to adopt the species replacement strategy requires 13 different covariates, no covariate contributes substantially to the adoption of prescribed burning. When comparing across multiple strategies, we found that 17 covariates are associated with only one strategy (Fig. 3B), further highlighting the need to distinguish between specific adaptation strategies. This shows that comprehensive adaptation measures (i.e. measures that focus on multiple strategies) are required to focus on a diverse set of underlying motivations and concerns. As foresters’ intention to adapt does not systematically translate into actual adaptive management change36, it is crucial to both understand how key variables can act as levers to increase their willingness to adapt, and identify where current understanding concerning the adaptation willingness and motivation remains limited.

    Fig. 3: Most important variables for predicting respondents’ willingness to implement adaptation strategies.
    figure 3

    A Model performance is the difference in expected log pointwise predictive density (ELPD) of the best model and the model considered. Vertical lines: standard errors of ELPD estimates. White background highlights covariate contrasts contained in the smallest model that is indistinguishable from the best model, i.e. for which performance is less than one standard error away from the best model. The performance of the best model is indicated by a solid red line. A description of the most influential non-selected variables is provided in Supplementary Tab. 2. B Explanatory variables can be selected for multiple strategies. Among the 29 variables selected based on their predictive performance, 17 of them relate to one strategy only, which underlines the importance of discriminating between adaptations, compared to approaches combining different adaptation actions. ‘Species replacement’ displays the highest complexity, with 13 unique variables selected.

    Fig. 4: Effects of covariates on the willingness to adopt a specific adaptation strategy.
    figure 4

    Each cell shows the maximal marginal effect of the corresponding variable on the willingness to adopt an adaptation strategy in the future, with positive effects in shades of green and negative effects in shades of brown. Darker shades indicate stronger positive or negative effects. For categorical covariates, numerical values correspond to the largest difference between factor levels (see Supplementary Table 1 for compared categories and corresponding credible intervals). For instance, NIPF owners for whom producing maple syrup is extremely important show a willingness to replace species that is 21% lower than respondents for whom it is not at all important. Due to correlations between covariates, marginal effects are not additive. Overall effect size decreases from left to right. Effects are shown only if the 0.1 posterior quantile is situated above zero, or the 0.9 quantile is situated below zero.

    How well threat appraisal, coping appraisal, and personal stakes may generally contribute towards the explanation of adaptation willingness is expressed by comparing, for each adaptation strategy, the intercept-only null model (which does not include any effects of survey items) to the model that includes the relevant subset of covariates (Fig. 3A). Including survey items based on protection motivation theory substantially increases predictive performance for five adaptation strategies (S1-S5), with performance increasing most strongly for the strategies of species replacement, species diversification, and more frequent logging. Conversely, the willingness to perform prescribed burning is not predicted by any survey items, suggesting that our analytical framework (at least for our sample and as implemented in our survey) does not provide an explanation for this adaptation behavior.

    Varying influence of ownership motivations and risk perception on adaptation intention

    Designing effective support policies requires a clear understanding of the motivations driving private forest owners to adapt. To that end, we quantified the effects of the entire set of influential covariates (as selected via predictive projection in the previous stage) across all six adaptation strategies simultaneously (Fig. 4). For this purpose, we use a multi-level item-response model37, which accounts for correlations between adaptation actions and covariates38. From this model we calculate marginal effects that express how adaptation willingness changes according to responses given to the survey items (i.e. explanatory variables), conditional on the demographic composition of the sample.

    Among all strategies, species replacement represents the most important change in forest operations and can be viewed as a cautious, but proactive approach to adaptive management, with benefits anticipated only in the distant future. The variables influencing species replacement support this perspective, indicating a focus on non-commercial forest ecosystem services (e.g., aesthetic value) and a disinterest in or rejection of commercial services (e.g., Christmas tree production). The active engagement in experimental changes, coupled with the negative impact of private forest owners’ age on species replacement, suggests a commitment to ongoing experimentation in adaptive forest management. A similar set of variables is associated with the ‘species diversification’ strategy, which is clearly oriented toward close-to-nature forestry aimed at preserving forests and enhancing resilience to climate risks5,6.

    Strategies such as ‘decreased stand density’ and ‘more frequent logging’ align with traditional forestry practices focused on the production of timber and maple syrup, two lucrative forest ecosystem services. ‘More frequent logging’ may also reflect increased salvage logging following climate disturbances (Supplementary Fig. 2). In contrast, the ‘laissez-faire’ and ‘prescribed burning’ strategies, which are respectively the most and least favored strategies (Fig. 2), are also the least versatile, with the fewest influencing variables and the smallest effect sizes. Laissez-faire is mainly adopted by owners who do not derive income from their forests, while prescribed burning is more strongly rejected in Quebec, possibly due to the lower perceived wildfire risk compared to provinces with a longer history of wildfires15.

    Two key variables stand out in our analysis of covariates influencing adaptation intentions: the diversity of ownership motivations and the belief in future changes in tree species composition. First, ownership motivations strongly influence adaptation decisions28,39, which suggests that programs and policies aimed at encouraging private forest owners to adapt to climate change should emphasize the co-benefits of adaptation for a wide range of forest ecosystem services rather than focusing on climate issues alone. No variables related to carbon sequestration are contained in the set of influential variables, which further supports that these aspects do not play an important role in influencing adaptation intentions among private forest owners.

    Second, the belief in future changes in tree species composition exerts a major positive influence on proactive adaptation strategies, such as ‘species diversification’ and ‘species replacement’. Consistent with studies in Sweden and Belgium33,40, our findings—representing the first analysis of this kind in North America—suggest that adaptation willingness among private forest owners is more strongly shaped by their subjective perceptions of climate risks than by objective measures of climate vulnerability. This is further supported by the results of the Bayesian variable selection, which found that variables tied to vulnerability, such as property size or proximity to harvest date provided little additional information (Supplementary Tab. 2). This might indicate sensitivity to climate-related disturbances such as wildfires and windstorms.

    For respondents with no intention to implement adaptive strategies, key barriers include limited know-how, uncertainty regarding the effectiveness of adaptation measures, and insufficient manpower (Fig. 5). Conversely, factors such as enhanced self-efficacy or improved woodlot accessibility do not appear to serve as effective levers for increasing adaptation intentions.

    Fig. 5: Reasons indicated by private forest owners for not intending to adapt their forests within ten years.
    figure 5

    Bars represent the percentage of respondents who rated each reason on a scale from ‘Not at all important’ (dark blue) to ‘Extremely important’ (dark green). The right side of the figure shows the proportion of respondents who rated each reason as ‘Neutral’ (gray). Number of respondents: 30.

    Overall, these results indicate that policies aimed at supporting private forest adaptation to climate change should appeal to forest owners’ common but differentiated motivations for owning forests and fully account for threat appraisal as a useful leverage point. Another important insight for policy formulation is that most of the highly influential explanatory variables show constant direction of effects across all adaptation strategies (although at varying degrees of impact) (Fig. 4). This suggests that the design of highly effective policies is indeed possible, targeting multiple strategies simultaneously with little trade-offs between competing options.

    Less than one in ten forest regulations or climate programs support private forest adaptation

    An important question remains, do current forest policies in Canada encourage private forest owners to implement adaptive management? To evaluate the extent of support provided to private forest owners in their efforts to adapt to climate change, we examined three primary levers of adaptive management in forestry: public regulations, voluntary programs, and sustainable certification systems. In Canada, public authorities have traditionally favored assistance and support programs over imposing laws and regulations, particularly in the context of public forests14. However, regulations do apply to private forests, primarily through provincial legislation41. We identified 100 acts, strategies, voluntary programs, and certification systems relevant to privately owned forests42, but only nine specifically addressed climate change mitigation or adaptation. This variation in public authority involvement, both across and within federal and provincial governments, affects the consistency and effectiveness of climate adaptation policies available to private forest owners.

    At the federal level, the Canadian government prioritizes partnerships with the private sector and non-governmental organizations (NGOs) over regulatory approaches43. For example, the ‘2030 Emissions Reduction Plan’ mobilizes funding for climate initiatives across Canada, including specific support for forest owners in Prince Edward Island, where over 85% of forests are privately owned, a marked contrast to the predominantly public forest ownership in the rest of Canada. The Prince Edward Island Woodlot Owners Association, supported by this federal funding, promotes forest biodiversity through a participatory conservation planning tool offering forest tours, information sessions, and the ‘Woodlot Owner of the Year’ award44. This initiative aligns well with one of the key motivations for climate change adaptation identified in our study: an emphasis on non-productive forest ecosystem services (Fig. 4). It is noteworthy that such voluntary, incentive-based programs are most effective when combined with regulatory frameworks45, yet none of the eight forestry-related federal acts explicitly addresses climate change adaptation in privately owned forests (Fig. 6). The closest approach to regulation comes through certification systems, such as the Forest Stewardship Council and the Sustainable Forestry Initiative. However, since these certifications primarily apply to private forest owners engaged in commercial logging, they predominantly encourage practices centered on timber production, such as ‘decreased stand density’ and ‘more frequent logging,’ while neglecting other adaptation strategies that respondents in our study favored, such as ‘species diversification’.

    Fig. 6: Federal and provincial regulations and incentives supporting the adaptation of private forests to climate change.
    figure 6

    The letters (A, S, V, F) represent different types of policy instruments or support mechanisms – A: Acts regulating forest management, including private forests. S: Strategies initiated by public authorities related to (private) forest management and/or climate change. V: Public voluntary programs supporting private forestry or climate change mitigation or adaptation. F (federal scale): Forestry certification systems. The numbers indicate the count of documents explicitly mentioning the role of private forests in mitigation or adaptation, with the total number of documents shown in parentheses (full dataset available online33). Spatial data on private forest locations is sourced from Stinson (2019)86 under a CC BY 4.0 license. ‘Other forests’ encompass treaty/settlement and Crown forests, Indian and federal reserves, and restricted or protected forested areas.

    At the provincial level, Alberta, Saskatchewan, Manitoba, and Newfoundland and Labrador offer no assistance for private forest owners’ climate change adaptation (Fig. 6). While this may be unsurprising in Newfoundland and Labrador, where private forest ownership is rare, it leaves nearly 3 million hectares of private forests in the Western provinces vulnerable to a wide range of climate change-related risks, from wildfires to pest outbreaks46. In contrast, British Columbia and Quebec have integrated adaptive practices into the management guidelines of their funding programs for timber-oriented private forest operations42, taking the lead in mainstreaming climate change adaptation in private timber production. However, we found no specific funding for private owners interested in non-timber forest ecosystem services, such as carbon sequestration or biodiversity conservation.

    Most regulations, strategies, and voluntary programs primarily allocate budgets to tax reductions or refunds for forest operations. However, our findings suggest that these funds could be utilized more effectively. Financial incentives alone do not appear to be important drivers of adaptation among private forest owners, as our analysis did not identify them as major motivators (variable ‘Forest as income source’, Fig. 4). For instance, increasing direct funding would likely have only a marginal impact on the small fraction of private forest owners currently unwilling to adapt (Fig. 4, Fig. 5).

    Instead, technical assistance emerged as a more effective driver of adaptation, consistent with findings from studies in Europe and other regions29,39,47. Redirecting funds toward providing appropriate forest reproductive material (e.g., seeds and seedlings for assisted migration) and protection against browsing damage could better support ‘species replacement’ strategies (Fig. 4). Technical assistance in the form of expert-led field tours could help build private forest owners’ confidence in changing tree species composition and strengthen their capacities to adapt their forests.

    While payments for ecosystem services remain popular among public authorities39, public support still predominantly targets timber-oriented adaptation strategies, overlooking opportunities to implement a wider array of strategies on private forests. Encouraging a more diversified approach to adaptation could better equip private forests to meet the challenges posed by climate change, even if such strategies are currently less favored by owners.

    Implications for policy formulations

    Extreme events, such as the unprecedented wildfire season in Canada in 202348, the extreme drought in central Europe in 201849 or the expected increase in climatic risk to the world forests particularly in southern boreal, dry tropics and central Europe50 underscore the urgent need for climate change adaptation strategies. As most countries have substantial private forest ownership, forest owners constitute an important lever to implement these strategies and ensure the provision of critical ecosystem services, particularly in proximity to more densely populated areas. Yet, our findings reveal a concerning paradox. On the one hand, we found one of the highest recorded intentions to adapt among private forest owners compared to the existing literature on forest management, along with a strong preference for implementing multiple adaptation strategies concurrently. On the other hand, we observed a mismatch in government efforts, as federal and provincial authorities often prioritize adaptation goals focused on productivity at the expense of other essential ecosystem services provided by private forests. This suggests an urgent and crucial need to reevaluate traditional policy approaches, such as tax reductions and forest operation reimbursements, which, while necessary, are insufficient to decidedly increase adaptation intentions. Our results indicate that the most effective support for private forest owners lies in providing detailed information on local climate change impacts and emphasizing the positive outcomes of adaptation for environmental and personal values rather than solely focusing on climate risk reduction. Despite limitations in the representativeness of our sample, these findings align with several articles in different national contexts emphasizing the importance of promoting voluntary adoption of adaptive forestry practices, e.g. ref. 51, alongside appropriately balanced regulatory approaches14,52. This international perspective offers a complementary framework for considering how supporting the adaptation of non-industrial private forests (NIPFs) to climate change benefits national objectives. Empirical insights from African53 and European54 contexts demonstrate that public support for private forests can simultaneously advance social and environmental objectives (e.g., poverty reduction, climate mitigation). This dynamic is of clear relevance to Canada’s efforts to achieve the targets of the Kunming–Montreal Global Biodiversity Framework.

    Offering technical assistance and capacity-building support on key aspects of adaptive practices implementation could complement this approach, supporting multiple adaptation strategies simultaneously, as outlined in European contexts32,55,56. Had it been feasible, a fully representative sample of NIPF owners could also have brought feedback on this point from voluntary programs led in British Columbia and New-Brunswick. Our study was also somewhat limited by the small number of private forest owners unwilling to adapt, which prevented a robust statistical analysis of their socio-economic profiles—insights that could help refine public policies and programs targeting this specific audience. In this regard, we must acknowledge the pioneering training provided by the University of British Columbia to forest experts aimed at enhancing climate change readiness among private sector consultants13.

    Our findings should also be assessed in light of adaptive forest management approaches that aim to reconcile biodiversity and climate goals. The strategies most favored by private forest owners align with the climate-smart forestry and functional network approaches5,6. For instance, the ‘laissez-faire’ strategy can lead to the successional development of old-growth forests, which exhibit unique structural attributes that enhance species diversification and support multiple ecosystem services57,58. This strategy reflects the motivations of these managers to allow forests to develop on their own, often driven by high uncertainty about the effectiveness of the strategies and a preference for less costly and time-consuming options20. Nevertheless, there are concerns regarding the ecological adaptive capacity of these forests, which may be outpaced by the rapidity of climate change59. While increasing species diversity could mitigate risks and enhance ecosystem stability, it may also entail economic costs for the forestry sector and pose risks of habitat losses for certain species60.

    Despite our best efforts, the study’s conclusions should be interpreted in light of its methodological limitations. In particular, representativeness biases are inherently difficult to avoid, especially in Canada, where data on non-industrial private forest owners remain fragmented and incomplete. This situation could be addressed through the development of comprehensive lists of forest landowners in the country, for instance by the Canadian Council of Forest Ministers. Although socio-economic comparisons were constrained by limited reference data, the sample appeared reasonably representative on key variables, with higher education levels and larger landholdings aligning with established patterns in voluntary survey participation. Nevertheless, the study makes a novel contribution by drawing on the protection motivation theory to connect individual-level determinants with broader institutional dynamics. It reinforces the idea that adaptation should not rest solely on landowners, but must also involve governments and institutions61.

    The lack of adequate institutional support for private forest owners, despite their willingness to adapt, represents a major opportunity not only for Canada but also for forest management globally. Effective governance and coordination among forest managers are critical to successfully implementing adaptation strategies, such as those emphasized in climate-smart forestry and functional diversity approaches. Involving private forest owners in participatory policy-making could shed light on practical barriers to implementation, such as access to diversified tree seeds, including setting up nurseries for seed production and supply. Private forest owners account for a substantial share of forested land in many countries8, are majorly found close to where people live, and we expect that, similarly to Canada, their high levels of motivation to pursue adaptive practices could create the potential for a rapidly implementable forest network that could serve as a long-term social-ecological adaptation observatory and testing ground for possible implementation in public forests worldwide. This presents a unique opportunity for a global body like the United Nations Forum on Forests Council of Forest Ministers to recommend and pilot programs offering local climate impact information, along with technical assistance and expert guidance.

    Continue Reading

  • New Mexico Child Support Services Division opens new Albuquerque office  – New Mexico Health Care Authority

    New Mexico Child Support Services Division opens new Albuquerque office  – New Mexico Health Care Authority

    SANTA FE — The New Mexico Health Care Authority announced the opening of a new Child Support Services Division office in a more centrally located area to serve the northern portion of Bernalillo County. 

    The new Child Support Services Division (CSSD) office, located at 3900 Masthead NE, Suite 300, opened Monday, Jan. 5. It will serve more than 7,000 cases previously handled by the CSSD office at 1010 18th St. NW, which closed Dec. 26, 2025. 

    “Child support offices historically have been located close to the district courthouse for hearings. However, since most hearings are now virtual, CSSD has the ability to move to an area closer to the customers we serve in Albuquerque,” said Betina Gonzales McCracken, CSSD director.  

    CSSD has two offices in Albuquerque, with cases assigned by ZIP code in Bernalillo County. The new Masthead office serves northern Bernalillo County ZIP codes, while the CSSD office at 1015 Tijeras NW, Suite 100, serves southern Bernalillo County ZIP codes. 

    Many child support services can be handled without the need to visit a child support office. Child support customers are encouraged to use the customer portal at YES.NM.GOV  or contact the HCA Customer Service Center at 1-800-283-4465.  

    ### 

    Continue Reading

  • Wave of Grok AI fake images of women and girls appalling, says UK minister | Grok AI

    Wave of Grok AI fake images of women and girls appalling, says UK minister | Grok AI

    The UK technology secretary has called a wave of images of women and children with their clothes digitally removed generated by Elon Musk’s Grok AI “appalling and unacceptable in decent society”.

    After thousands of intimate deepfakes circulated online, Liz Kendall said X, Musk’s social media platform, needed to “deal with this urgently” and she backed the UK regulator Ofcom to “take any enforcement action it deems necessary”.

    “We cannot and will not allow the proliferation of these demeaning and degrading images, which are disproportionately aimed at women and girls,” she said. “Make no mistake, the UK will not tolerate the endless proliferation of disgusting and abusive material online. We must all come together to stamp it out.”

    Her comments came amid warnings that the Online Safety Act, which aims to tackle online harms and protect children, needs to be urgently toughened up despite pressure from the Trump administration to water it down.

    One expert criticised the “tennis game” between platforms such as X and UK regulators when problems arose and called the government response “worryingly slow”.

    Jessaline Caine, a survivor of child sexual abuse, called the government’s response “spineless” and told the Guardian that on Tuesday morning the chatbot was still obeying requests to manipulate an image of her as a three-year-old to dress her in a string bikini. Her identical requests made to ChatGPT and Gemini were rejected.

    “Other platforms have these safeguards so why does Grok allow the creation of these images?” she said. “The images I’ve seen are so vile and degrading. The government has been very reactive. These AI tools need better regulation.”

    On Monday, Ofcom said it was aware of serious concerns raised about Grok creating undressed images of people and sexualised images of children. It said it had contacted X and xAI “to understand what steps they have taken to comply with their legal duties to protect users in the UK” and would assess the need for an investigation based on the company’s response.

    The pressure is growing on ministers to take a tougher line. The crossbench peer and online child safety campaigner Beeban Kidron has urged the government to “show some backbone” and called for the Online Safety Act regime to be “reassessed so it is swifter and has more teeth”.

    Speaking about X, she said: “If any other consumer product caused this level of harm, it would already have been recalled.”

    She said Ofcom needed to act “in days not years” and called for users to walk “away from products that show no serious intent to prevent harm to children, women and democracy”.

    Ofcom has powers to fine tech platforms up to £18m or 10% of their qualifying global revenues, whichever is higher. The biggest penalty to date came last month when a porn provider that failed to carry out mandatory age checks was fined £1m.

    Last month, ministers promised new laws to ban “nudification” tools, which use generative AI to turn images of real people into fake nude pictures and videos without their permission. It remains unclear when that ban will be enforced.

    Sarah Smith, the innovation lead at the Lucy Faithfull Foundation, a charity that works to prevent child abuse, called for X to immediately disable Grok’s image-editing features “until robust safeguards are in place to stop this from happening again”.

    X did not respond to a request for comment on Kendall’s remarks. It said on Monday: “We take action against illegal content on X, including child sexual abuse material, by removing it, permanently suspending accounts and working with local governments and law enforcement as necessary.”

    Jake Moore, a global cybersecurity adviser at at the security software firm ESET, criticised the “tennis game” between platforms such as X and UK regulators and called the government response “worryingly slow”.

    He said that as AI increasingly allowed faked images to be rendered as longer videos, the consequences for people’s lives would only become worse.

    “It is unbelievable that this is able to occur in 2026,” he said. “We have to move forward with extreme regulation. Any grey area we offer will be abused. The government is not understanding the bigger picture here.”

    It is already illegal to create or share non-consensual intimate images or child sexual abuse material, including sexual deepfakes created with AI. Fake images of people in bikinis may qualify as intimate images, as the definition in law includes the person having naked breasts, buttocks or genitals or having those parts only covered by underwear. Indecent images include those depicting children in erotic poses without sexual activity.

    Lady Kidron said AI-generated pictures of children in bikinis may not be child sexual abuse material but they were contemptuous of children’s privacy and agency.

    “We cannot live in a world in which a kid can’t post a picture of winning a race unless they are willing to be sexualised and humiliated,” she said.

    Continue Reading

  • Neural coding of multiple motion speeds in visual cortical area MT

    Neural coding of multiple motion speeds in visual cortical area MT

    We aimed to quantify the relationship between the response elicited by the bi-speed stimuli and the corresponding component responses. We first assumed that the response R of a neuron elicited by two component speeds can be described as a weighted sum of the component responses Rs and Rf elicited by the slower (vs) and faster (vf) component speed, respectively Equation 1.

    (1)

    R(vs,vf)=ws(vs,vf)Rs+wf(vs,vf)Rf,

    in which, ws and wf are the response weights for the slower and faster speed component vsandvf, respectively.

    Our goal was to estimate the weights for each speed pair and determine whether the weights change with the stimulus speeds. In our main data set, the two speed components moved in the same direction. To determine the weights of ws and wf for each neuron at each speed pair, we have three data points R, Rs, and Rf, which are trial-averaged responses. Since it is not possible to solve for both variables, ws and wf, from a single equation Equation 1 with three data points, we introduced an additional constraint: ws + wf = 1. With this constraint, the weighted sum becomes a weighted average. While this constraint may not yield the exact weights that would be obtained with a fully determined system, it nevertheless allows us to characterize how the relative weights vary with stimulus speed. As long as RfRs, R can be expressed as:

    (2)

    R=RfRRfRsRs+RRsRfRsRf,

    The response weights are ws=RfRRfRs , wf=RRsRfRs. Intuitively, if R were closer to one component response, that stimulus component would have a higher weight. Note that Equation 2 is not intended for fitting the response R using Rs and Rf, but rather to use the relationship among R, Rs, and Rf to determine the weights for the faster and slower components.

    Using this approach to estimate response weights for individual neurons can be unreliable, particularly when Rf and Rs are similar. This situation often arises when the two speeds fall on opposite sides of the neuron’s preferred speed, resulting in a small denominator (Rf – Rs) and consequently an artificially inflated weight estimate. We, therefore, used the neuronal responses across the population to determine the response weights (Figure 5). For each pair of stimulus speeds, we plotted (R−Rs) in the ordinate versus (Rf − Rs) in the abscissa. Figure 5A1–E1 shows the results obtained at 4x speed separation. Across the neuronal population, the relationship between (R – Rs) and (Rf − Rs) can be described by a linear equation (Equation 3) (see R2 in Table 1). This linearity suggests that the response weights for each speed pair are roughly consistent across the neuronal population.

    (3)

    RRs=k(RfRs)+b

    Relationship between the responses to the bi-speed stimuli and the constituent stimulus components.

    (A–E) Each panel shows the responses from 100 neurons. Each dot represents the responses from one neuron. R, Rf,, and Rs were firing rates averaged across all recorded trials for each neuron. The ordinate shows the difference between the responses to a bi-speed stimulus and the slower component (R – Rs). The abscissa shows the difference between the responses to the faster and slower components (Rf – Rs). The regression line is shown in red. (F) Response weights for the faster stimulus component obtained from the slope of the linear regression based on the recorded responses of 100 neurons (black symbols), and based on simulated responses to the bi-speed stimuli (gray symbols). Error bars represent 95% confidence intervals. (A1–F1) 4x speed separation. (A2–F2) 2x speed separation.

    Response weight for faster component based on linear regression (N=100).
    Large speed difference (4x) Small speed difference (2x)
    Components
    speeds (°/s)
    1.25/5 2.5/10 5/20 10/40 20/80 1.25/2.5 2.5/5 5/10 10/20 20/40
    Intercept (b) –0.60 –0.13 2.34 1.79 –0.33 –0.65 –0.45 –0.32 1.23 –0.99
    Slope (wf) and 95% CI 0.92
    ±
    0.048
    0.83
    ±
    0.056
    0.58
    ±
    0.047
    0.45
    ±
    0.044
    0.46
    ±
    0.052
    0.70
    ±
    0.070
    0.74
    ±
    0.067
    0.64
    ±
    0.059
    0.47
    ±
    0.050
    0.52
    ±
    0.042
    Simulated slope (wf) and 95% CI 0.50
    ±
    0.079
    0.50
    ±
    0.078
    0.50
    ±
    0.063
    0.50
    ±
    0.059
    0.50
    ±
    0.089
    0.50
    ±
    0.075
    0.50
    ±
    0.078
    0.50
    ±
    0.072
    0.50
    ±
    0.058
    0.50
    ±
    0.071
    p-values (wf)
    (measured>simulated)
    <0.001
    (***)
    <0.001
    (***)
    0.09 0.86 0.686 0.005
    (**)
    0.002
    (**)
    0.017
    (*)
    0.742 0.432
    R2 0.94 0.90 0.86 0.80 0.76 0.80 0.83 0.82 0.78 0.86
    Simulated R2
    and 95% CI
    0.62
    ±
    0.162
    0.62
    ±
    0.165
    0.71
    ±
    0.111
    0.73
    ±
    0.095
    0.55
    ±
    0.176
    0.64
    ±
    0.159
    0.62
    ±
    0.158
    0.66
    ±
    0.137
    0.75
    ±
    0.098
    0.66
    ±
    0.154
    p-values (R2) (measured > simulated) <0.001
    (***)
    <0.001
    (***)
    <0.001
    (***)
    0.096 0.003
    (**)
    0.01
    (**)
    0.003
    (**)
    <0.001
    (***)
    0.311 0.002
    (**)
    Slope (wf)
    ± STD
    (Rs from
    splittrials)
    0.90
    ±
    0.021
    0.81
    ±
    0.020
    0.56
    ±
    0.015
    0.44
    ±
    0.015
    0.44
    ±
    0.024
    0.63
    ±
    0.075
    0.67
    ±
    0.078
    0.58
    ±
    0.072
    0.44
    ±
    0.058
    0.48
    ±
    0.071
    R2
    (Rs from
    splittrials)
    0.89 0.85 0.82 0.75 0.67 0.63 0.65 0.66 0.66 0.73

    Because all the regression lines in Figure 5 nearly go through the origin (i.e. intercept b ≈ 0, Table 1), the slope k obtained from the linear regression approximates RRsRfRs, which is the response weight wf for the faster component (Equation 2). Hence, for each pair of stimulus speeds, we can estimate the response weight for the faster component using the slope of the linear regression of the responses from the neuronal population.

    Our results showed that the bi-speed response showed a strong bias toward the faster component when the speeds were slow and changed progressively from a scheme of ‘faster-component-take-all’ to ‘response-averaging’ as the speeds of the two stimulus components increased (Figure 5F1). We found similar results when the speed separation between the stimulus components was small (2x), although the bias toward the faster component at low stimulus speeds was not as strong as 4x speed separation (Figure 5A2–F2 and Table 1).

    In the regression between (RRs) and (RfRs), Rs (i.e. the firing rate to the slow component averaged across all trials for each neuron) was a common term and, therefore, could artificially introduce correlations. We wanted to determine whether our estimates of the regression slope (wf) were confounded by this factor. We performed two additional analyses.

    First, at each speed pair and for each of the 100 neurons in the data sample shown in Figure 5, we simulated the response to the bi-speed stimuli (Re) as a randomly weighted average of Rf and Rs of the same neuron.

    (4)

    Re=aRf+(1a)Rs,

    in which a was a randomly generated weight (between 0 and 1) for Rf, and the weights for Rf and Rs summed to one. We then calculated the regression slope and the correlation coefficient between the simulated ReRs and RfRs across the 100 neurons. We repeated the process 1000 times and obtained the mean and 95% confidence interval (CI) of the regression slope and the R2. The mean slope based on the simulated responses was 0.5 across all speed pairs. The estimated slope (wf) from the data was significantly greater than the simulated slope at slow speeds of 1.25/5, 2.5/10 (Figure 5F1), and 1.25/2.5, 2.5/5, and 5/10°/s (Figure 5F2) (bootstrap test, see p-values in Table 1). The estimated R2 based on the data was also significantly higher than the simulated R2 for most of the speed pairs (Table 1).

    Second, we calculated Rs in the ordinate and abscissa of Figure 5A–E using responses averaged across different subsets of trials, such that Rs was no longer a common term in the ordinate and abscissa. For each neuron, we determined Rs1 by averaging the firing rates of Rs across half of the recorded trials, selected randomly. We also determined Rs2 by averaging the firing rates of Rs across the rest of the trials. We regressed (RRs1) on (RfRs2), as well as (RRs2) on (RfRs1), and repeated the procedure 50 times. The averaged slopes obtained with Rs from the split trials showed the same pattern as those using Rs from all trials (Table 1 and Appendix 1—figure 1), although the coefficient of determination was slightly reduced (Table 1). For 4x speed separation, the slopes were nearly identical to those shown in Figure 5F1. For 2x speed separation, the slopes were slightly smaller than those in Figure 5F2, but followed the same pattern (Appendix 1—figure 1). Together, these analysis results confirmed the faster-speed bias at the slow stimulus speeds and the change of the response weights as stimulus speeds increased.

    Continue Reading

  • City of Regina | Capital City Kitchen Now Open New Cafeteria at City Hall Offers a Fresh Take on Everyday Meals

    City of Regina | Capital City Kitchen Now Open New Cafeteria at City Hall Offers a Fresh Take on Everyday Meals

    Capital City Kitchen has officially opened at the City Hall cafeteria, offering homemade meals, local ingredients and a welcoming atmosphere.

    “Capital City Kitchen is a new meeting place for our employees, our neighbours and the thousands of people who work and visit downtown every day,” said Mayor Chad Bachynski. “Thanks to Tim and Shane, this corner of City Hall is being brought back to life with the kind of heart, hospitality and homegrown flavour that Regina is known for.”  

    Capital City Kitchen is operated by the teams behind Dad’s Diner and Hillside Smoke ’N Que. The new cafeteria will feature daily hot specials, fresh-made breakfast, grab-and-go items and a rotating menu inspired by Saskatchewan flavours.

    “We want Capital City Kitchen to feel like a place where everyone is welcome,” said co-owner Tim Philp. “Good food brings people together and we’re excited to serve the downtown community.”

    Customers can expect hearty comfort food, lighter options and new dishes popping up regularly based on customer feedback.  

    “This is more than just a cafeteria – it’s a community space,” said co-owner Shane Folk. “We’re proud to share food that’s local, simple and made with care.”

    Capital City Kitchen is located on the main floor of Regina City Hall and is open Monday to Friday from 7 a.m. to 4 p.m.


    Continue Reading

  • Department of Labor & Workforce Development

    January 6, 2026

    TRENTONThe most recent employment estimates for October and November, produced by the U.S. Bureau of Labor Statistics, show a net loss of 5,300 jobs over the two-month period. Specifically, total nonfarm employment decreased in November by 1,700 to a seasonally adjusted level of 4,396,000 jobs, while October’s estimates show a net loss of 3,600 jobs. Data collection and the release of these estimates were delayed because of the federal government shutdown. Both the October and November employment estimates will also undergo routine revisions. 

    The state’s unemployment rate for November increased to 5.4 percent, a 0.2 percentage point increase from September. Labor force data for October, including the unemployment rate, are not available due to the lack of household survey data collection during the federal government shutdown. 

    Revised estimates of total non-farm employment in September show a slight downward revision of 500, resulting in a revised August to September gain of 10,400 jobs. 

    In November, three out of nine private industry sectors recorded employment gains compared with October. Those sectors were private education and health services (+4,900), trade, transportation, and utilities (+1,800), and financial activities (+800). Sectors that recorded job losses include professional and business services (-3,600), leisure and hospitality (-2,800), construction (-2,000), manufacturing (-800), and information (-100). Other services recorded no change over the month. The public sector recorded a gain of 100 jobs for November. 

    Over the past 12 months, New Jersey has added 20,600 nonfarm jobs as private sector employment increased by 18,800 jobs. Four out of nine private industry sectors recorded a gain, including private education and health services (+28,200), professional and business services (+12,200), manufacturing (+700), and financial activities (+100). Losses were recorded year-over-year in construction (-12,500), trade, transportation, and utilities (-3,200), information (-3,000), other services (-2,100), and leisure and hospitality (-1,500). The public sector recorded a gain of 1,800 jobs over the past 12 months. 

    Preliminary BLS data for December 2025 will be released on January 22, 2026. 

    NJ Employment Situation Highlights: November 2025 

    PRESS TABLES 

    Technical Notes: Estimates of industry employment and unemployment levels are arrived at through the use of two different monthly surveys. 

    Industry employment data are derived through the Current Employment Statistics (CES) survey, a monthly survey of approximately 4,000 business establishments conducted by the U.S. Bureau of Labor Statistics (BLS) of the U.S. Department of Labor, which provides estimates of employment, hours, and earnings data broken down by industry for the nation as a whole, all states and most major metropolitan areas (often referred to as the “establishment” survey). 

    Resident employment and unemployment data are mainly derived from the New Jersey portion of the national Current Population Survey (CPS), a household survey conducted each month by the U.S. Census Bureau under contract with BLS, which provides input to the Local Area Unemployment Statistics (LAUS) program (often referred to as the “household” survey). 

    Both industry and household estimates are revised each month based on additional information from updated survey reports compiled by the BLS. In addition, these estimates are benchmarked (revised) annually based on actual counts from New Jersey’s Unemployment Compensation Law administrative records and more complete data from all New Jersey employers. 

    Effective with the release of January 2018 estimates, the Current Employment Statistics (CES) program has converted to concurrent seasonal adjustment, which uses all available estimates, including those for the current month, in developing seasonal factors. Previously, the CES program developed seasonal factors once a year during the annual benchmark process. For more information on concurrent seasonal adjustment in the CES State and Area program, see https://www.bls.gov/sae/seasonal-adjustment/.

    Go back to all press releases

    Continue Reading

  • Statistics Canada staffing 32,000 census jobs across Canada

    January 6, 2026

    Statistics Canada will conduct the next census in May 2026 and is hiring for approximately 32,000 census jobs across Canada. Census workers play a vital role in helping to collect high-quality demographic, social and economic data to help provide an accurate statistical portrait of the country. 

    These data inform decisions about child care and education services, health care, public transportation, housing, community planning, and a wide range of programs that support Canadians.

    A variety of supervisory and non-supervisory opportunities are available between March 2026 and July 2026, depending on the position and location.

    To be considered for a job, applicants must:

    • have reached the age of majority in their current province or territory of residence
    • be a Canadian citizen or permanent resident, or possess a valid work permit
    • reside in Canada and have a Canadian home address.

    Pay is $25.87 per hour for enumerators (non-supervisory positions) and $31.32 per hour for crew leaders (supervisory positions), plus authorized expenses.


    Roles and Responsibilities of Census Workers:

    ·         The primary responsibility of enumerators is to go door to door to collect census information.

    ·         The primary responsibilities of crew leaders are to lead and supervise an assistant and a team of enumerators. They are responsible for all activities related to the collection of census questionnaires in their assigned area.


    For more information and to apply, visit the Census jobs webpage.

    Associated link
    Census.gc.ca — Census jobs

    Contact
    Statistics Canada
    Media Relations
    statcan.mediahotline-ligneinfomedias.statcan@statcan.gc.ca

    Continue Reading

  • Government demands Musk’s X deals with ‘appalling’ Grok AI

    Government demands Musk’s X deals with ‘appalling’ Grok AI

    Laura CressTechnology reporter

    Bloomberg via Getty Images Elon Musk looking off camera in front of a blue backgroundBloomberg via Getty Images

    Technology Secretary Liz Kendall has called on Elon Musk’s X to urgently deal with its artificial intelligence chatbot Grok being used to create non-consensual sexualised images of women and girls.

    The BBC has seen multiple examples on X of people asking the bot to digitally undress people to make them appear in bikinis without their consent, as well as putting them in sexual situations.

    Kendall said the situation was “absolutely appalling”, adding “we cannot and will not allow the proliferation of these degrading images.”

    In a statement, X said: “We take action against illegal content on X, including Child Sexual Abuse Material (CSAM), by removing it, permanently suspending accounts, and working with local governments and law enforcement as necessary.

    “Anyone using or prompting Grok to make illegal content will suffer the same consequences as if they upload illegal content,” the statement continued.

    On Monday, the regulator Ofcom said it had made “urgent contact” with Elon Musk’s company xAI and said it was investigating concerns Grok has been producing “undressed images” of people.

    Kendall has endorsed the regulator’s actions.

    “It is absolutely right that Ofcom is looking into this as a matter of urgency and it has my full backing to take any enforcement action it deems necessary,” she said.

    ‘Dehumanising’ images

    Grok is a free AI assistant – with some paid-for premium features – which responds to X users’ prompts when they tag it in a post.

    It is often used to give reaction or more context to other posters’ remarks.

    But people on X are also able to use it to edit an uploaded image through its AI image editing feature without the consent of the person depicted.

    Women who have stumbled across sexualised images of themselves made by Grok have described it as dehumanising.

    Dr Daisy Dixon is one of the many female X users who recently started to see people take everyday pictures she had posted of herself on the platform and ask Grok to undress her or sexualise her.

    She told the BBC the pictures left her feeling “shocked”, “humiliated” and frightened for her safety.

    She added while she backed the call from the technology secretary for action and found it “heartening”, she still felt frustrated with X’s lack of accountability.

    Dr Daisy Dixon A headshot of Dr Daisy Dixon Dr Daisy Dixon

    Dr Daisy Dixon has seen people on X use her pictures and ask Grok to undress her

    “Myself and many other women on X continue to report the inappropriate AI images/videos we are being sent daily, but X continues to reply that there has been no violation of X rules,” she said.

    “I just hope Kendall’s words turn into concrete enforcement soon – I don’t want to open my X app anymore as I’m frightened about what I might see.”

    In her statement Kendall said: “Services and operators have a clear obligation to act appropriately. This is not about restricting freedom of speech but upholding the law.

    “We have made intimate image abuse and cyberflashing priority offences under the Online Safety Act – including where images are AI-generated. This means platforms must prevent such content from appearing online and act swiftly to remove it if it does.”

    The leader of the Liberal Democrats Sir Ed Davey urged the government to “act very quickly” to stop the generation of sexualised images by Grok, suggesting one course of action would be to “reduce access” to X.

    “If the reports turn out to be true the National Crime Agency need to launch a criminal investigation,” Sir Ed said.

    “People like Elon Musk have to be held to account.”

    Speaking to BBC Newshour, Thomas Regnier, spokesman for tech sovereignty at the European Commission, said they were taking the issue “very seriously”.

    “We don’t want this in the European Union… it’s appalling, it’s disgusting.

    “The Wild West is over in Europe,” he said.

    “All companies have the obligation to put their own house in order – and this starts by being responsible and removing illegal content that is being generated by your AI tool.”

    Continue Reading

  • Investor Alert: Smart Reserve Holdings and Tradock Are Not Registered | News and Media

    Released on January 6, 2026

    The Financial and Consumer Affairs Authority of Saskatchewan (FCAA) warns investors of the online entities known as Smart Reserve Holdings and Tradock.

    “Checking the registration status at aretheyregistered.ca should always be the first step for Saskatchewan residents looking to invest,” FCAA Securities Division Executive Director Dean Murrison said. “Registration status tells you that a business is legitimate. Keep your investments safe and only deal with a registered business.”

    Smart Reserve Holdings and Tradock claim to offer Saskatchewan residents trading opportunities including stocks, forex, cryptocurrences, indices and commodities. Additionally, Smart Reserve Holdings claims to offer bonds, mutual funds and contracts for difference (CFDs).

    This alert applies to the online entities using the websites “smartreserveholdings com”, “tradock io” and “tradock co” (these URLs have been manually altered so as not to be interactive).

    Smart Reserve Holdings and Tradock are not registered with the FCAA to trade or sell securities or derivatives in Saskatchewan. The FCAA cautions investors and consumers not to send money to companies that are not registered in Saskatchewan, as they may not be legitimate businesses. 

    If you have invested with Smart Reserve Holdings, Tradock or anyone claiming to be acting on their behalf, contact the FCAA’s Securities Division at 306-787-5936.

    In Saskatchewan, individuals or companies need to be registered with the FCAA to trade or sell securities or derivatives. The registration provisions of The Securities Act, 1988, and accompanying regulations are intended to ensure that only honest and knowledgeable people are allowed to sell securities and derivatives and that their businesses are financially stable.

    Tips to protect yourself:

    • Always verify that the person or company is registered in Saskatchewan to sell or advise about securities or derivatives. To check registration, visit The Canadian Securities Administrators’ National Registration Search at aretheyregistered.ca.
    • Know exactly what you are investing in. Make sure you understand how the investment, product, or service works.
    • Get a second opinion and seek professional advice about the investment.
    • Do not allow unknown or unverified individuals to remotely access your computer.

    -30-

    For more information, contact:

    Continue Reading

  • Remarks by Janet L. Yellen on the future of the Fed: Central bank independence and fiscal dominance

    Remarks by Janet L. Yellen on the future of the Fed: Central bank independence and fiscal dominance

    I’m pleased to serve on a panel on the future of the Fed. My focus will be on threats to the Fed’s independence and the risk of fiscal dominance. Unfortunately, these topics are now receiving increased attention.    

    According to the consensus among economists, independence in setting monetary policy is essential to the Fed’s effective stewardship of the economy. That is why Congress mandated the Fed’s goals of maximum employment and price stability but delegated to the Fed the responsibility for choosing the settings of its monetary policy instruments to achieve them.  Those decisions are intended to reflect data, analysis, and professional judgments, and to be free from political pressure. To ensure transparency and accountability, Congress requires Fed leaders to report regularly on their progress toward these goals. And to establish legitimacy and achieve public support, the Fed regularly explains its decisions to the American people. 

    This postwar policy framework is characterized by monetary policy dominance—that is, the Fed is not and must never become the fiscal authority’s financing arm. Fiscal policy’s job is to set taxes and spending, and to finance deficits through issuing debt to the market at prevailing interest rates. It is the responsibility of Congress and the President—not the Federal Reserve—to insure that the government’s intertemporal budget constraint is satisfied. It is their duty to ensure that the path of debt is sustainable.   

    Fiscal dominance refers to the opposite configuration—a situation where the government’s fiscal position—its deficits and debt—puts such pressure on its financing needs that monetary policy becomes subordinate to those needs.  As a result, the central bank is pressured, implicitly or explicitly, to keep interest rates lower than warranted by macroeconomic conditions; or to purchase large quantities of government debt, not primarily to stabilize inflation and employment but to ease the government’s financing burden. In a fiscally dominant world, the government’s intertemporal budget constraint drives the price level. If markets don’t expect future primary surpluses to cover the debt, the adjustment eventually comes via inflation or default. This is the “fiscal theory of the price level.”

    Fiscal dominance is dangerous because it typically results in higher and more volatile inflation or politically driven business cycles. When the central bank is constrained from raising rates or shrinking its balance sheet because that would increase debt service or trigger fiscal stress, inflation expectations may become unanchored. Households and firms may come to expect that inflation is the path of least resistance for managing high debts. Once such expectations take hold, stabilizing prices becomes significantly more costly. If inflation is firmly under control, the Fed has more flexibility to respond to labor market weakness. Fiscal dominance is also likely to raise term premia and borrowing costs as investors become concerned that the government will rely on inflation or financial repression to manage its debt. In addition, a central bank that is perceived as an arm of the Treasury may have less space to act forcefully in a crisis. For all of these reasons, avoiding fiscal dominance has been a central objective of modern central banking frameworks. 

    Should we be concerned about the potential for fiscal dominance? In my opinion, the answer is “yes.” In order to lower the costs of debt service, President Trump has vocally demanded that the Fed lower interest rates to levels well below most estimates of “neutral.” He’s threatened Fed independence by attempting to dismiss a Fed governor for alleged cause. And he has also asserted the right of the president to dismiss Senate-confirmed members of independent agency boards like the Fed for policy reasons. 

    But, by the standards of the fiscal-dominance literature, I would agree with Chair Powell that the United States is not in a fiscal-dominance regime today. The Fed raised rates sharply in response to the post-pandemic inflation, even when that worsened the fiscal arithmetic. Indeed, those interest rate increases caused the Fed’s own income to turn sharply negative in 2023. That followed many years of low rates and balance sheet expansion that generated large positive transfers from the Fed to the Treasury. A situation where the Fed is incurring losses has the potential to unleash political pressures that might compromise the Fed’s credibility and its budget autonomy. But the Fed’s decisions about asset purchases after the financial crisis and pandemic focused squarely on deploying them to achieve the Fed’s inflation and employment mandates and to address threats to financial stability. It ignored possible fiscal or political repercussions.   Now, in the face of unprecedented presidential pressure to lower interest rates to reduce the costs of servicing the public debt, the Fed is standing its ground. Its decisions have been squarely governed by its responsibilities to lower inflation and keep the economy operating at full employment. And long-term inflation expectations remain anchored, in line with the Fed’s 2% inflation target. Nor is there much indication that market participants are concerned by the prospect of fiscal dominance, although term premiums in longer-term Treasury yields have risen considerably over the last year. 

    But the preconditions for fiscal dominance are clearly strengthening. Based on the Congressional Budget Office’s most recent long-term forecast, debt is on a steep upward trajectory. As David Romer emphasized, CBO projects a rise from roughly 100% of GDP this year to more than 150% over the next three decades. That forecast excludes the impact of the One Big Beautiful Bill, nicknamed OBBBA, and the revenue from tariffs. Together, they worsen the outlook. CBO also projects that net interest costs will rise from their current level. They now amount to 19% of revenue and 3.2% of GDP. They’ll rise to 28% of revenue and 5.4% of GDP over the next three decades. 

    The overall federal deficit is roughly 6% of GDP. That level has never before been realized except during wars and recessions. And the primary deficit, which must be roughly in balance to stabilize the debt/GDP ratio, is now about 3% of GDP. The needed belt tightening is significant—larger than in most programs supported by the International Monetary Fund. I’d add, parenthetically, that, luckily, that 3% of GDP is still well short of what the IMF required for countries experiencing severe capital-account crises. In light of such projections, and in the absence of any bipartisan effort to address the fiscal path, the three major rating agencies have already downgraded U.S. sovereign credit. They explicitly cite persistent deficits, a rising interest burden, and political gridlock. If market participants lose confidence in the likelihood of serious future deficit reduction, rising risk premia could trigger a debt spiral and pressure the dollar.1 If Congress is unable—or if it is unwilling—to adjust primary deficits, the problems will compound. The temptation to rely on inflation or financial repression to reduce the debt burden will surely grow.

    It is possible that the fiscal outlook could improve significantly if AI results in a substantial and sustained productivity boost. In a recent paper, Elmendorf, Hubbard, and Liscow2 consider a scenario in which total factor productivity growth is 0.5 percentage points faster per year than in the CBO baseline for 10 years. They find that, at the end of a decade, debt held by the public will be lower by about 12% of GDP. We should not sneeze at such an improvement, but it is too small to be transformative. To prevent the ratio of debt-to-GDP from spiraling upward, the productivity boost would have to be sustained for 30 years. One reason the benefit is not larger is that higher productivity generally raises the return to capital and nudges up the equilibrium real rate of interest. But is a gain of about 0.5% for three decades realistic? 

    Of course, it is also possible that the budget could experience negative interest rate or growth shocks that would exacerbate the fiscal outlook. With a 100% debt/GDP ratio, a one percentage point increase in the average nominal interest rate on Treasury debt eventually raises net interest costs by roughly 1% of GDP. This could, for example, reflect a higher risk premium that investors demand for holding an ever-growing stock of U.S. debt. If higher debt crowds out private investment, and reduces GDP growth, the outcomes are worse. A decline in the pace of immigration would also worsen the fiscal outlook. Simulations show that the U.S. is currently on a trajectory where relatively modest adverse shocks (100–200 bp higher long-term interest rates and slightly weaker growth) would, over time, push the system into a zone where resisting fiscal dominance requires very strong institutional resilience and credible fiscal reform.

    Fiscal dominance is not just about debt ratios and paths. It is also about institutions and laws that protect the Fed’s independence. A key protection insulating the Fed from day-to-day political pressures is its clear statutory mandate to focus on the goals of maximum employment and stable prices—with the choice of specific operating procedures and targets left to the Fed. However, Rand Paul’s “Audit the Fed” bill would direct the Government Accountability Office to review the Fed’s monetary policy deliberations and FOMC communications in real time. This is exactly the terrain Congress has historically kept off-limits. Such political second-guessing would, at a minimum, chill internal debate.

    Congress can also change the Fed’s mandate. Historically Congress has not tied policy directly to debt-service costs, but President Trump has endorsed this objective. Recent proposed legislation would also limit the Fed’s ability to pay interest on reserves—currently the main tool for setting short-term rates. Another protection for Fed independence is the 14-year staggered terms for members of the Federal Reserve Board; according to the Federal Reserve Act, they are removable by the President only for cause. However, “cause” has never been clearly defined, and Trump is now testing the waters by attempting to remove Fed Governor Lisa Cook for alleged cause. It is still up to the courts to decide whether Governor Cook can remain in her job while litigation proceeds and the Courts opine on how high a barrier to dismissal “for cause” removal entails. If the bar is set very low, it could intimidate future Fed officials from speaking their minds. In addition, Trump, or a successor, could potentially remove Fed governors for policy differences. In recent cases, Trump has been testing the constitutionality of the Supreme Court ruling in 1935 called Humphrey’s Executor—which held that a president cannot remove a Senate-confirmed member of a multi-member independent agency board for policy reasons. The Supreme Court may be poised to overturn this protection, while suggesting that such a decision may not apply to the Fed. Fed governors, however, have responsibilities beyond monetary policy, including, for example, bank supervision. Would a decision to treat the Fed as “special” apply to governors in their exercise of these other, non-monetary roles? Another protection for Fed independence is that the Fed finances its operations from its own earnings, not through the appropriations process. That reduces the leverage that Congress or the president has via annual budget politics. But here, too, the rules could change, and the Fed’s income losses might provoke Congress to subject the Fed’s budget to greater congressional control.  

    What would keep the U.S. out of fiscal dominance? First and foremost, this requires credible medium-term fiscal adjustment—not abrupt austerity, but a believable path that stabilizes debt/GDP; for example, through gradual changes to taxes and entitlements or reforms that tilt growth and productivity higher. Unfortunately, however, the revealed preference of both parties has been toward deficit-increasing policy. Recently, the administration and Congress cut funding for the IRS which was targeted at reducing a huge tax gap—a shortfall of $7 trillion dollars over the next decade between taxes that are owed and those estimated to be paid. This was the “low hanging fruit” of deficit reduction. With Republicans opposing tax hikes, and both parties promising to protect Social Security and Medicare, it’s hard to see much room for serious deficit reduction. That said, bipartisan deals are sometimes feasible even amidst intense partisan conflict. It happened in 1997 when [President] Clinton and [Speaker of the House] Newt Gingrich agreed to balance the budget. There was also meaningful deficit reduction in 2023, when a potential debt ceiling standoff threatened default. A bipartisan agreement reduced deficits by about $1.5 trillion over the following decade. The projected depletion of the Social Security and Medicare HI [Hospital Insurance] trust funds in 2032 and market and ratings pressures could serve as similar pressure points. My hope is that such bipartisanship will emerge in the years ahead to place the United States on a sustainable fiscal course. I doubt that Americans will end up on the fiscal dominance course, but I definitely think the dangers are real.  

    Continue Reading