Category: 3. Business

  • CCP fines Mezan Beverages Rs150m for copying PepsiCo’s Sting

    CCP fines Mezan Beverages Rs150m for copying PepsiCo’s Sting

    Accused of mimicking Sting’s overall design, colour combination, bottle shape, branding

    A fine of Rs150 million has been imposed on Mezan Beverages (Pvt) Ltd on Friday for copying the packaging and trade dress of PepsiCo’s energy drink “Sting” by the Competition Commission of Pakistan (CCP).

    According to the Commission, Mezan’s energy drink ‘Storm’ mimicked Sting’s overall design, colour combination, bottle shape, and branding, creating a clear likelihood of consumer confusion. The Commission categorised this as parasitic copying, violating Section 10 of the Pakistan Competition Act 2010.

    Section 10 of the Pakistan Competition Act 2010 prohibits undertakings from engaging in “deceptive marketing practices.”

    The Act defines deceptive practices to include: the distribution of “false or misleading information that is capable of harming the business interests of others”; the distribution of false or misleading information to consumers; “false or misleading comparison of goods in the process of advertising”; or the “fraudulent use of another’s trademark, firm name, or product labelling or packaging.”

    The case had been pending since 2018. PepsiCo Inc. had lodged a complaint claiming that Mezan Beverages designed ‘Storm’ to closely resemble Sting and illegitimately benefit from PepsiCo’s brand reputation. Instead of addressing the merits, Mezan challenged the Commission’s authority in court, obtaining interim injunctions that repeatedly delayed the inquiry for several years.

    Last year, the Lahore High Court rejected Mezan Beverages’ petition, upholding the CCP’s authority to conduct the inquiry. The court noted that Mezan used legal injunctions to stall the Commission’s proceedings and directed CCP to complete its inquiry and issue a decision.

    The Competition Commission’s detailed ruling noted that Storm’s red color scheme, bold slanted white lettering, and bottle shape closely resembled Sting. These branding elements could mislead ordinary consumers. The Commission emphasised that having a registered trademark for ‘Storm’ does not exempt a company from competition law if it misleads consumers.

    CCP Chairman Dr. Kabir Sidhu stated that copying brands and using misleading packaging or marketing will not be tolerated, regardless of company size, and strict action will be taken.

    Continue Reading

  • Carotenoid biosynthesis drives root plasticity through aerenchyma and iron plaque formation in rice

    Carotenoid biosynthesis drives root plasticity through aerenchyma and iron plaque formation in rice

    Plant materials

    NaN3 mutant lines in the IR64 rice variety background were developed and self-pollinated for over 15 generations by the Taiwan Agricultural Research Institute (Wufeng, Taichung, Taiwan, ROC)40. Among the 1,888 mutant lines, the AZ1302 mutant was identified as exhibiting inhibited aerenchyma and iron plaque formation in adventitious roots. To map the gene responsible for these phenotypes, AZ1302 was crossed with Nipponbare, a polymorphic parent, to produce F1 progenies and an F2 mapping population. The early-flowering Kitaake cultivar41 was used for the generation of CRISPR–Cas9-induced mutants and promoter–GUS reporter lines. For the generation of overexpression lines, an AZ1302-like recombinant inbred line (Nipponbare × AZ1302 F6) predominantly exhibiting SNPs similar to Nipponbare was used.

    Growth conditions

    Seeds were disinfected with 50% sodium hypochlorite (J. T. Baker Inc.) for 15 min and subsequently cleaned three times with water. The disinfected seeds were kept on moistened filter paper and incubated in darkness at 30 °C for five days. Three days after germination, the seedlings were transferred to 1/2 Kimura B nutrient solution (pH 4.75)42. For the iron plaque induction assay, two-week-old seedlings were treated with 360 µM FeSO4·7H2O for one week, with the nutrient solution refreshed every alternate day. The formation of iron plaque was visualized as a reddish coloration after one week of excess Fe treatment.

    To assess tillering ability, the plant materials were cultivated in a paddy field at Agricultural Experimental Station, National Chung Hsing University, Wufeng Township, Taichung, Taiwan. The fertilization rate was 125 kg ha−1 N, 75 kg ha−1 P2O5 and 50 kg ha−1 K2O. Seedlings were individually transplanted at a density of 30 plants per plot with a spacing of 30 cm × 15 cm.

    Root tissue embedding, sectioning and imaging

    The tissues were fixed in 3% (w/v) agarose, and 80-µm sections were prepared using a vibratome microtome (VT1200S, Leica Microsystem GmbH). To assess the aerenchyma of SL mutants, root segments were fixed in 4% (w/v) paraformaldehyde prepared in 1× PBS (pH 6.9) under vacuum at room temperature for 1 h, and the fixed roots were embedded in 5% (w/v) agarose. The cut sections were visualized under a light microscope, and the proportion of aerenchyma was quantified using ImageJ software (v.1.43u, US National Institutes of Health)43. For representative imaging of cell wall structures, sections were stained overnight with 0.1% (v/v) SR2200 (ref. 44). Confocal imaging was performed using a Zeiss LSM 710 inverted confocal microscope equipped with a 405-nm laser line for excitation; emission signals were collected between 430 and 500 nm to detect the blue fluorescence emitted by SR2200. To determine the length and density of root hairs, root segments from the apical, middle and basal regions were imaged at ×10 and ×20 magnifications, respectively. Measurements of root hair density and length were also performed using ImageJ.

    Evaluation of ROL

    Qualitative evaluation of ROL in the whole roots was performed with methylene blue, which becomes bluish in the presence of oxygen45. A 0.1% (w/v) agar was prepared, and 13 mg l−1 methylene blue was added to the cooled solution. The blue solution was decolourized by 130 mg l−1 sodium dithionite (Na2S2O4) (Merck KGaA) to a colourless solution. The solution was transferred into a clear plastic case with compartments measuring 4.5 cm long, 1 cm wide and 15 cm high. The plants were held in such a way that the root–shoot junction was approximately 2 cm below the surface of the solution. The roots were immersed in the prepared solution for 60 min at ambient temperature.

    Gene mapping

    DNA was isolated from both parental lines and the F2 population (n = 126) by employing the DNeasy Plant Mini Kit (Qiagen). The Affymetrix rice 44K SNP array, which includes 44,100 SNPs evenly distributed throughout the rice genome, with approximately one SNP every 10 kb, was employed for genotyping46. Genotypes were analysed using Axiom Analysis Suite through the Best Practice Workflow (Thermo Fisher)47.

    QTL IciMapping v.4.2 with inclusive composite interval mapping was employed to identify the QTL associated with iron plaque formation48,49. Markers with over 10% missing data were omitted from further analysis. The remaining markers were categorized using a LOD score threshold of 3, ordered using the k-Optimality algorithm (LOD 2-OptMAP) and rippled with a window size of 5 Mb. Recombination frequencies were converted to centimorgans (cM) using the Kosambi function, and QTL were mapped with parameters set at a step size of 1.0 cM and a PIN value of 0.001. A 1,000-permutation test was performed to estimate the QTL LOD threshold at a 95% confidence level. The additive effects and phenotypic variance explained for each QTL were also calculated.

    RT-PCR analysis

    The extraction of total RNA from 21-day-old adventitious roots and third leaves was conducted using a Total RNA Mini Kit (Plant) (Geneaid Biotech Ltd). Complementary DNA was synthesized from the isolated RNA with iScript Reverse Transcription Supermix (Bio-Rad Laboratories, Inc.). RT-PCR was conducted to amplify full-length coding sequences, intron retention and exon skipping using specific primers. OsUBC2 served as the internal control for RT-PCR (Supplementary Data 1).

    Exogenous carotenoid biosynthesis inhibitor treatment

    Norflurazon and dichlormate were used to inhibit carotenoid biosynthesis through the inhibition of phytoene desaturase50 and ζ-carotene desaturase51, respectively. Stock solutions of 1 mM norflurazon (LGC Group) and 10 mM dichlormate (LGC Group) were prepared in DMSO. Two-week-old plants were treated with 0.1 µM norflurazon and 10 µM dichlormate, which were incorporated into 1/2 Kimura B solution. The visualization of aerenchyma and iron plaque was performed in three-week-old plants.

    Knockout and overexpression assays

    Four guide RNAs targeting the PSY2 gene were designed for generating CRISPR–Cas9 mutants. The oligonucleotide sequences for generating the single guide RNAs are provided in Supplementary Data 2. The CRISPR–Cas9 expression vector pYLCRISPR–Cas9Pubi-H was transformed into Agrobacterium tumefaciens EHA105 and subsequently transformed into calli derived from the japonica rice variety Kitaake (wild type). Three independent homozygous psy2 mutant lines free of the Cas9 transgene (T3 generation) were obtained, and the mutations were verified by sequencing using primer pairs flanking the target sites (Supplementary Data 1). Aerenchyma and iron plaque formation, ROL, root and shoot length, and root and shoot dry weight were assessed.

    For the overexpression of PSY2, the entire coding DNA sequence of the PSY2 gene was amplified from Kitaake using RT-PCR. The pZmUBI::PSY2 expression vector was constructed in the backbone of vector pMHb7Fm21GW-UBIL and introduced into Agrobacterium. This construct was transformed into calli of Kitaake, CRISPR–Cas9-induced psy2 mutants and the Nipponbare × AZ1302 F6 recombinant line (a Nipponbare-like line carrying the PSY2 gene from AZ1302). Two independent transgenic lines exhibiting higher OsPSY2 expression were obtained, and aerenchyma and iron plaque formation was assessed.

    Elemental analyses

    The elemental concentration in iron plaque, roots, shoots and brown rice was assessed via ICP optical emission spectrometry (PerkinElmer Inc.). A DCB solution was applied to extract iron plaque surrounding the roots52. Roots after DCB extraction, shoots and grains were cleaned sequentially with ddH2O, 10 mM CaCl2 and ddH2O again, each for 20 min. After cleaning, the tissues were dried at 70 °C for three days. Approximately 1 ml of HNO3 was added to the weighed tissues in Teflon tubes and allowed to stand at room temperature overnight. The following day, 0.5 ml of H2O2 was added and held at room temperature for 30 min before microwave digestion using a MARS 6 PFAS Extraction system (CEM Corporation). After digestion, the solution was transferred into a 15-ml tube, and 8.5 ml of 2% HNO3 was added. The solution was filtered using 0.45-µm filters into new 15-ml tubes and stored until elemental analysis was conducted.

    To visualize Fe in the roots, fresh roots from 28-day-old plants were carefully washed and dried using filter paper. Root segments taken at 3–4 cm from the tip were fixed in 2% agarose and cut into 200-μm transverse sections with a vibrating blade microtome (VT1200S, Leica Microsystem GmbH). These sections were mounted on double-sided tape affixed to microscope glass slides and set to dry at room temperature. The spatial scattering of 56Fe within the root sections was mapped using a quadrupole ICP mass spectrometer (Agilent 7800; Agilent Technologies), connected to a laser ablation system (NWR 266; ESI). Ablation was conducted with a Nd:YAG laser (266-nm wavelength), using a 5-µm spot size and a cycle frequency of 50 Hz. Argon carrier gas transported the ablated material to the ICP mass spectrometer. Data processing was performed using IOLITE v.3.65 software (Iolite Softwares Private Limited), and the 13C+ signal served as an internal normalization standard to mitigate signal variations caused by differences in tissue density.

    Expression pattern analysis

    The spatial distribution of PSY2 gene expression was assessed using a promoter–GUS reporter system. A 1,917-bp region upstream of the PSY2 start codon (ATG) was amplified via PCR using the Nipponbare cultivar’s genomic DNA (Supplementary Data 1). The amplified promoter region was cloned into the binary vector pGWB3 (ref. 53). A p35S::GUS construct served as a positive control. Both constructs were transformed into the Kitaake background.

    Roots and shoots of transgenic plants aged three weeks were subjected to GUS staining using buffer (2 mM X-Gluc, 2 mM K3Fe(CN)6, 2 mM K4Fe(CN)6·3H2O, 50 mM NaHPO4 buffer (pH 7.2), 0.2% (v/v) Triton X-100) at 37 °C. The pPSY2::GUS transgenic plants were stained for up to two days, while the p35S::GUS plants were stained overnight. Chlorophyll was decolourized using 95% ethanol, and stained tissues were photographed. Cross-sections of the tissues were visualized and imaged under a light microscope.

    Quantification of carotenoids in root tissues

    For carotenoid extraction, 19-day-old plants were treated with 10 µM dichlormate for 48 h to partially inhibit β-carotene biosynthesis to obtain the quantification of phytoene as well as β-carotene51. Freeze-dried samples (100 mg) were homogenized using liquid nitrogen and transferred into 2-ml Eppendorf tubes. The powdered samples were mixed with 1 ml of ethanol containing 1 mg ml−1 butylated hydroxy anisole (Sigma Aldrich) to prevent the oxidation of carotenoids. After vortexing, the samples were sonicated on an ice bath for 15 min using Branson 3510 ultrasonic cleaner (Marshall Scientific) and centrifuged at 4 °C at 1,800 g for 5 min. After 200 µl of supernatant was collected, the extraction was repeated twice more, and 1 ml and 800 µl of supernatants were collected in the subsequent extraction. The collected supernatants were kept in darkness at −20 °C before further processing.

    Carotenoids were identified and quantified using an Agilent 1290 Infinity II UPLC system (Agilent Technologies) coupled online to an atmospheric pressure chemical ionization source of an Agilent 6545 XT quadrupole time-of-flight mass spectrometer. The samples were separated using a YMC Carotenoid column (3 μm, 2.0 × 150 mm, YMC Co., Ltd). The column temperature was 30 °C. The mobile phases were methanol:water (9:1, v/v; eluent A) and isopropanol:methanol (7:3, v/v; eluent B). The flow rate was 0.3 ml min−1. The instrument was operated in positive full-scan mode (m/z of 100–1,500). Chromatogram acquisition, detection of mass spectral peaks and their waveform processing were performed using Agilent Qualitative Analysis v.10.0 and Agilent MassHunter Pro1finder v.B.10.00 software.

    Quantification of ABA in root tissues

    To determine ABA content, 100 mg of fresh root tissue was harvested in 2-ml Eppendorf tubes. Liquid nitrogen was employed to grind the samples into a fine powder, which was then mixed in 500 µl of extraction solution (2-propanol/H2O/HCl, 2:1:0.002) spiked with an internal standard (50 µl of methanol containing 2 ng of d6-ABA). The tubes were agitated for 30 min at 4 °C. Next, 1 ml of dichloromethane was added to each tube, followed by another round of agitation for 30 min at 4 °C. After mixing, the tubes were centrifuged at 13,000 g for 5 min at 4 °C, resulting in plant debris separating the two liquid phases. The lower phase (500 µl) was carefully collected and dried using Labconco CentriVap Benchtop Vacuum Concentrators (Fisher Scientific).

    The dried extracts were dissolved in 100 µl of 80% methanol and subjected to vortexing for 5 min and then centrifugation at 13,200 g at 4 °C for 10 min. The resuspended samples were subjected to analysis using UPLC (Waters) coupled online to the Waters Xevo TQ-XS triple quadrupole mass spectrometer (Waters). The sample (in duplicate with 5 μl per injection) was separated with a Waters ACQUITY UPLC HSS T3 column (1.8 µm particle size, 2.1 × 100 mm). The column was operated at 30 °C with a flow rate of 0.3 ml min−1. The mobile phase comprised a gradient elution system of aqueous solution with 0.1% acetic acid and methanol with 0.1% acetic acid. Multiple reaction monitoring in negative mode was employed to monitor the characteristic MS transitions for ABA (m/z, 263 → 153) and d6-ABA (m/z, 269 → 159). Data were acquired and processed using MassLynx v.4.2 and TargetLynx software (Waters).

    Quantification of SLs in root exudates and roots

    SLs present in root exudates were collected and quantified using an established protocol24. Briefly, phosphorous deficiency treatment was conducted on two-week-old plants for seven days, and the media containing exudates were collected. Root exudates enriched with 2 ng of GR24 were loaded onto a preconditioned C18-Fast Reversed-SPE column 500 mg/3 ml (Grace) with 3 ml of methanol and subsequently 3 ml of water. The column was washed with 3 ml of water, followed by elution of SLs twice with 2 ml and 3 ml of acetone. The SL-containing fractions were concentrated to approximately 500 μl of an aqueous solution and then extracted with 1 ml of ethyl acetate. For LC-MS/MS analysis, the enriched SL organic fraction (750 μl) was vacuum-dried, resuspended in 100 μl of acetonitrile:water (25:75, v:v) and filtered through a 0.22-μm filter.

    SLs from roots were extracted following the procedure described by Wang et al.14. Lyophilized and ground rice roots (25 mg) were spiked with 2 ng of GR24. Two separate extractions were performed with sonication using a Branson 3510 ultrasonic cleaner (Marshall Scientific), each using 2 ml of ethyl acetate for 15 min. Each extraction was followed by centrifugation at 1,800 g for 8 min at 4 °C. The obtained supernatants were pooled and vacuum-dried. The residual SLs were resuspended in 50 μl of ethyl acetate, mixed with 2 ml of hexane and loaded onto a 500 mg/3 ml silica SPE column (Grace). Then, 3 ml of hexane was passed through the column, and SLs were eluted with 3 ml of ethyl acetate. The eluates were vacuum-dried, resuspended in 150 μl of acetonitrile:water (25:75, v:v) and filtered through a 0.22-μm filter for LC-MS/MS analysis. Quantification of SLs was conducted on a UHPLC-Triple-Stage Quadrupole mass spectrometer (Thermo Scientific Altis) following established procedures54.

    Bioassay for Striga hermonthica seed germination

    Striga seed germination was assessed by following a published method55. Briefly, Striga seeds were preconditioned at 30 °C under moist conditions for ten days. 50 µl of root exudates collected from Kitaake and psy2 mutants were treated with Striga seeds. Subsequently, the seeds were incubated at 30 °C in the dark for another two days. The germinated and non-germinated seeds were counted with a binocular microscope, and the germination rate was determined.

    Exogenous ABA and GR24 treatment

    Stock solutions of 25 mM (rac)-GR24 (PhytoTech Labs, Inc.), 10 mM (+)-GR24 (US Biological) and 250 µM ABA (Merck KGaA) were prepared in DMSO. For treatment, 11-day-old hydroponically grown plants were transferred to 1/2 Kimura B solution containing 0.01 µM ABA or 5 µM GR24, with DMSO serving as the control. The treatments were continued for ten days. For iron plaque induction, excess iron treatment was done on 14-day-old plants as mentioned previously. Aerenchyma and iron plaque formation was observed in two-week-old and three-week-old plants. The DCB solution was applied to extract iron plaque surrounding the newly emerged adventitious roots. Root dry weight, root length, shoot length, root hair density and root hair length were also measured.

    Genetic and chemical disruption of the SL and ABA pathways

    The SL biosynthesis mutants d17 and d10, with disruption in the conversion from 9-cis-β-carotene to carlactone56, and the SL signalling mutant d14 (ref. 57) were used to assess the role of SLs in aerenchyma and iron plaque formation. The wild-type Shiokari and the mutants were grown for three weeks, and aerenchyma in the adventitious roots was visualized at 2–3 cm and 4–5 cm from the root tips. To determine the function of the ABA pathway in iron plaque formation, the specific ABA signalling inhibitor AA1 was applied15. Wild-type (Kitaake) plants were treated with 1 µM AAl at the ten-day-old stage, and excess Fe treatment was applied to two-week-old plants. The iron plaque phenotype was examined at the three-week-old stage.

    Data analysis and visualization

    If not otherwise stated, the data were analysed and visualized using R v.4.1.3 (ref. 58). The normality of the data and the homogeneity of their variance were determined via the Shapiro–Wilk test and Levene’s test, respectively. P values were calculated for two-tailed t-tests. For multiple comparisons between genotypes and treatments, two-way analysis of variance followed by Tukey’s post hoc test was conducted. For data not meeting the assumptions of normality and/or homogeneity of variance, Welch’s t-test and the Kruskal–Wallis test followed by the Dunn test were conducted.

    Reporting summary

    Further information on research design is available in the Nature Portfolio Reporting Summary linked to this article.

    Continue Reading

  • London congestion charge for EV drivers comes into effect

    London congestion charge for EV drivers comes into effect

    PA Media File photo of a Tesla car plugged into a Source London EV charging point in central London.PA Media

    Electric cars can get a 25% discount if registered to Auto Pay, meaning a daily charge of £13.50

    Electric vehicle (EV) drivers in central London are having to pay the capital’s congestion charge for the first time.

    The daily charge for non-electrified vehicles has also risen from £15 to £18, its first hike since 2020.

    Pure battery-powered EVs are eligible for a 25% discount if registered for Auto Pay, reducing the fee to £13.50 a day. Mayor Sir Sadiq Khan announced in November that the changes would come into effect on 2 January.

    The congestion charge, introduced in 2003, covers an area of central London between 07:00 and 18:00 on weekdays, and between 12:00 and 18:00 on weekends and bank holidays.

    ‘Little incentive’

    Joan Owen drives an electric vehicle into London for her volunteer shifts at the NSPCC.

    “There seems little incentive now to get an electric vehicle,” she told BBC London.

    “I usually drive at night, so I won’t be affected so much by this new charge. But I will be affected if I want to do additional shifts over bank holidays.

    “It affects the charity, and I think that’s what has upset me most. If they want to claim that money back, then they have that extra layer of administration in doing so, rather than being exempt in the first instance.”

    Transport for London had previously proposed scrapping the EV exemption entirely.

    It said without changes, about 2,200 more vehicles would use the congestion charging zone on an average weekday in 2026, increasing congestion and undermining the current scheme.

    A 50% discount is in place for electric vans, HGVs, light quadricycles and heavy quadricycles registered for Auto Pay – although this is due to be reduced in 2030 to 25%, when the discount for EVs will also fall, to 12.5%.

    From March 2027, for new applicants only, the 90% residents’ discount will also only be available for EVs.

    Continue Reading

  • GBD 2017 DALY & HALE Collaborators. Global, regional, and national disability-adjusted life-years (DALYs) for 359 diseases and injuries and healthy life expectancy (HALE) for 195 countries and territories, 1990–2017: a systematic analysis for the Global Burden of Disease Study 2017. Lancet 392, 1859–1922 (2018).

    Article 

    Google Scholar 

  • Murray, C. J. & Lopez, A. D. Global mortality, disability, and the contribution of risk factors: Global Burden of Disease Study. Lancet 349, 1436–1442 (1997).

    Article 
    PubMed 

    Google Scholar 

  • Murray, C. J. & Lopez, A. D. Alternative projections of mortality and disability by cause 1990–2020: Global Burden of Disease Study. Lancet 349, 1498–1504 (1997).

    Article 
    PubMed 

    Google Scholar 

  • Asaria, M., Doran, T. & Cookson, R. The costs of inequality: whole-population modelling study of lifetime inpatient hospital costs in the English National Health Service by level of neighbourhood deprivation. J. Epidemiol. Community Health 70, 990 (2016).

    Article 
    PubMed 

    Google Scholar 

  • Kadel, R. et al. Cost of health inequality to the NHS in Wales. Front. Public Health 10, 959283 (2022).

    Article 
    PubMed 
    PubMed Central 

    Google Scholar 

  • Welch, V. A. et al. Health equity: evidence synthesis and knowledge translation methods. Syst. Rev. 2, 43 (2013).

    Article 
    PubMed 
    PubMed Central 

    Google Scholar 

  • Kjellstrom, T. et al. Urban environmental health hazards and health equity. J. Urban Health 84, 86–97 (2007).

    Article 
    PubMed Central 

    Google Scholar 

  • Redshaw, C. H., Stahl-Timmins, W. M., Fleming, L. E., Davidson, I. & Depledge, M. H. Potential changes in disease patterns and pharmaceutical use in response to climate change. J. Toxicol. Environ. Health Part B 16, 285–320 (2013).

    Article 

    Google Scholar 

  • Thomas, F., Sabel, C. E., Morton, K., Hiscock, R. & Depledge, M. H. Extended impacts of climate change on health and wellbeing. Environ. Sci. Polic. 44, 271–278 (2014).

    Article 

    Google Scholar 

  • Kemp, A. & Edwards, D. J. Broadening the Scope of Wellbeing Science (Palgrave Macmillan, 2022); https://doi.org/10.1007/978-3-031-18329-4

  • Lomas, T., Pawelski, J. O. & VanderWeele, T. J. Flourishing as ‘sustainable well-being’: balance and harmony within and across people, ecosystems, and time. J. Posit. Psychol. 20, 203–218 (2025).

    Article 

    Google Scholar 

  • Steger, M. F. Regenerative positive psychology: a call to reorient wellbeing science to meet the realities of our world. J. Posit. Psychol. 20, 373–396 (2025).

    Article 

    Google Scholar 

  • Diener, E. & Chan, M. Y. Happy people live longer: subjective well-being contributes to health and longevity. Appl. Psychol. Health Well-Being 3, 1–43 (2011).

    Article 

    Google Scholar 

  • Diener, E., Pressman, S. D., Hunter, J. & Delgadillo-Chase, D. If, why, and when subjective well-being influences health, and future needed research. Appl.Psychol. Health Well-Being 9, 133–167 (2017).

    Article 
    PubMed 

    Google Scholar 

  • Cosco, T. D., Howse, K. & Brayne, C. Healthy ageing, resilience and wellbeing. Epidemiol. Psychiatr. Sci. 26, 579–583 (2017).

    Article 
    PubMed 
    PubMed Central 

    Google Scholar 

  • Keyes, C. L. M., Dhingra, S. S. & Simoes, E. J. Change in level of positive mental health as a predictor of future risk of mental illness. Am. J. Public Health 100, 2366–2371 (2011).

    Article 

    Google Scholar 

  • Mehl, M. R., Vazire, S., Holleran, S. E. & Clark, C. S. Eavesdropping on happiness. Psychol. Sci. 21, 539–541 (2009).

    Article 

    Google Scholar 

  • Zawadzki, S. J., Steg, L. & Bouman, T. Meta-analytic evidence for a robust and positive association between individuals pro-environmental behaviors and their subjective wellbeing. Environ. Res. Lett. 15, 123007 (2020).

    Article 

    Google Scholar 

  • Agteren, J. et al. A systematic review and meta-analysis of psychological interventions to improve mental wellbeing. Nat. Hum. Behav. 5, 631–652 (2021).

    Article 
    PubMed 

    Google Scholar 

  • Carr, A. et al. Effectiveness of positive psychology interventions: a systematic review and meta-analysis. J. Posit. Psychol. 16, 749–769 (2021).

    Article 

    Google Scholar 

  • Sin, N. L. & Lyubomirsky, S. Enhancing well-being and alleviating depressive symptoms with positive psychology interventions: a practice-friendly meta-analysis. J. Clin. Psychol. 65, 467–487 (2009).

    Article 
    PubMed 

    Google Scholar 

  • White, C. A., Uttl, B. & Holder, M. D. Meta-analyses of positive psychology interventions: the effects are much smaller than previously reported. PLoS ONE 14, e0216588 (2019).

    Article 
    PubMed 
    PubMed Central 

    Google Scholar 

  • Kaneita, Y. et al. Association between mental health status and sleep status among adolescents in japan: a nationwide cross-sectional survey. J. Clin. Psychiatry 68, 1426–1435 (2007).

    Article 
    PubMed 

    Google Scholar 

  • Moreno-Agostino, D. et al. Mediterranean diet and wellbeing: evidence from a nationwide survey. Psychol. Health 34, 321–335 (2019).

    Article 
    PubMed 

    Google Scholar 

  • Wiese, C. W., Kuykendall, L. & Tay, L. Get active? A meta-analysis of leisure-time physical activity and subjective well-being. J. Posit. Psychol. 13, 57–66 (2018).

    Article 

    Google Scholar 

  • Yakushko, O. & Blodgett, E. Negative reflections about positive psychology: on constraining the field to a focus on happiness and personal achievement. J. Humanist. Psychol. 61, 104–131 (2021).

    Article 

    Google Scholar 

  • Kemp, A. H., Arias, J. A. & Fisher, Z. in The Missing Link (eds Ibáñez, A. et al.) 397–427 (Springer, 2017); https://doi.org/10.1007/978-3-319-68421-5_17

  • Kemp, A. H. & Fisher, Z. Wellbeing, whole health and societal transformation: theoretical insights and practical applications. Glob. Adv. Health Med. 11, 21649561211073077 (2022).

    Article 
    PubMed 
    PubMed Central 

    Google Scholar 

  • Mead, J., Gibbs, K., Fisher, Z. & Kemp, A. H. What’s next for wellbeing science? Moving from the Anthropocene to the Symbiocene. Front. Psychol. 14, 1087078 (2023).

    Article 
    PubMed 
    PubMed Central 

    Google Scholar 

  • Mead, J., Fisher, Z. & Kemp, A. H. Moving beyond disciplinary silos towards a transdisciplinary model of wellbeing: an invited review. Front. Psychol. 12, 642093 (2021).

    Article 
    PubMed 
    PubMed Central 

    Google Scholar 

  • Wilkie, L., Fisher, Z. & Kemp, A. H. The complex construct of wellbeing and the role of vagal function. Front. Integr. Neurosci. 16, 925664 (2022).

    Article 
    PubMed 
    PubMed Central 

    Google Scholar 

  • Buecker, S., Simacek, T., Ingwersen, B., Terwiel, S. & Simonsmeier, B. A. Physical activity and subjective well-being in healthy individuals: a meta-analytic review. Health Psychol. Rev. 15, 574–592 (2021).

    Article 
    PubMed 

    Google Scholar 

  • Steffens, N. K. et al. Social identification-building interventions to improve health: a systematic review and meta-analysis. Health Psychol. Rev. 15, 85–112 (2021).

    Article 
    PubMed 

    Google Scholar 

  • Pritchard, A., Richardson, M., Sheffield, D. & McEwan, K. The relationship between nature connectedness and eudaimonic well-being: a meta-analysis. J. Happiness Stud. 21, 1145–1167 (2020).

    Article 

    Google Scholar 

  • Kern, M. L. et al. Systems informed positive psychology. J. Posit. Psychol. 15, 705–715 (2020).

    Article 

    Google Scholar 

  • Haslam, C., Jetten, J., Cruwys, T., Dingle, G. A. & Haslam, S. A. The New Psychology of Health, Unlocking the Social Cure (Routledge, 2018); https://doi.org/10.4324/9781315648569

  • Wilkie, L. et al. Improving wellbeing through local communities: a mixed methods study on the role of relationship building. J. Happiness Stud. 26, 47 (2025).

    Article 

    Google Scholar 

  • Berg, A. E., van den, Maas, J., Verheij, R. A. & Groenewegen, P. P. Green space as a buffer between stressful life events and health. Soc. Sci. Med. 70, 1203–1210 (2010).

    Article 
    PubMed 

    Google Scholar 

  • Gibbs, K., Fisher, Z., Denner, K. & Kemp, A. H. Constructing the conditions for wellbeing: a qualitative evaluation of group-based ecotherapy for adults living with acquired brain injury. Neuropsychol. Rehabilitation 1–35 (2025).

  • Kamioka, H. et al. Effectiveness of horticultural therapy: a systematic review of randomized controlled trials. Complement. Ther. Med. 22, 930–943 (2014).

    Article 
    PubMed 

    Google Scholar 

  • Wilkie, L., Fisher, Z. & Kemp, A. H. The ‘rippling’ waves of wellbeing: a mixed methods evaluation of a surf-therapy intervention on patients with acquired brain injury. Sustainability 14, 9605 (2022).

    Article 

    Google Scholar 

  • Bratman, G. N., Hamilton, J. P., Hahn, K. S., Daily, G. C. & Gross, J. J. Nature experience reduces rumination and subgenual prefrontal cortex activation. Proc. Natl Acad. Sci. USA 112, 8567–8572 (2015).

    Article 
    PubMed 
    PubMed Central 

    Google Scholar 

  • Gascon, M. et al. Mental health benefits of long-term exposure to residential green and blue spaces: a systematic review. Int. J. Environ. Res. Public Health 12, 4354–4379 (2015).

    Article 
    PubMed 
    PubMed Central 

    Google Scholar 

  • Hartig, T., Mitchell, R., de Vries, S. & Frumkin, H. Nature and health. Annu. Rev. Public Health 35, 207–228 (2014).

    Article 
    PubMed 

    Google Scholar 

  • Twohig-Bennett, C. & Jones, A. The health benefits of the great outdoors: a systematic review and meta-analysis of greenspace exposure and health outcomes. Environ. Res. 166, 628–637 (2018).

    Article 
    PubMed 
    PubMed Central 

    Google Scholar 

  • Richardson, M. et al. A measure of nature connectedness for children and adults: validation, performance, and insights. Sustainability 11, 3250 (2019).

    Article 

    Google Scholar 

  • Hughes, J., Richardson, M. & Lumber, R. Evaluating connection to nature and the relationship with conservation behaviour in children. J. Nat. Conserv. 45, 11–19 (2018).

    Article 

    Google Scholar 

  • Keyes, C. L. M. Promoting and protecting mental health as flourishing. Am. Psychol. 62, 95–108 (2007).

    Article 
    PubMed 

    Google Scholar 

  • Rose, G. Sick individuals and sick populations. Int. J. Epidemiol. 14, 32–38 (1985).

    Article 
    PubMed 

    Google Scholar 

  • Bolier, L. et al. Positive psychology interventions: a meta-analysis of randomized controlled studies. BMC Public Heal 13, 119 (2013).

    Article 

    Google Scholar 

  • Lim, W. L. & Tierney, S. The effectiveness of positive psychology interventions for promoting well-being of adults experiencing depression compared to other active psychological treatments: a systematic review and meta-analysis. J. Happiness Stud. 24, 249–273 (2023).

    Article 
    PubMed 

    Google Scholar 

  • Weiss, L. A., Westerhof, G. J. & Bohlmeijer, E. T. Can we increase psychological well-being? The effects of interventions on psychological well-being: a meta-analysis of randomized controlled trials. PLoS ONE 11, e0158092 (2016).

    Article 
    PubMed 
    PubMed Central 

    Google Scholar 

  • Sturm, V. E. et al. Big smile, small self: awe walks promote prosocial positive emotions in older adults. Emotion 22, 1044–1058 (2022).

    Article 
    PubMed 

    Google Scholar 

  • Edwards, M. K. & Loprinzi, P. D. Affective responses to acute bouts of aerobic exercise, mindfulness meditation, and combinations of exercise and meditation: a randomized controlled intervention. Psychol. Rep. 122, 465–484 (2019).

    Article 
    PubMed 

    Google Scholar 

  • Lee, T. S., Hung, C., Lin, C. & Chiang, H. Controlled randomized trial of walking exercise with positive education on cardiovascular fitness and happiness in retired older adults. Geriatr. Gerontol. Int. 19, 879–884 (2019).

    Article 
    PubMed 

    Google Scholar 

  • Pascoe, M. C. & Bauer, I. E. A systematic review of randomised control trials on the effects of yoga on stress measures and mood. J. Psychiatr. Res. 68, 270–282 (2015).

    Article 
    PubMed 

    Google Scholar 

  • Gilbert, P. Introducing compassion-focused therapy. Adv. Psychiatr. Treat. 15, 199–208 (2009).

    Article 

    Google Scholar 

  • Gilbert, P. The origins and nature of compassion focused therapy. Br. J. Clin. Psychol. 53, 6–41 (2014).

    Article 
    PubMed 

    Google Scholar 

  • Khoury, B., Sharma, M., Rush, S. E. & Fournier, C. Mindfulness-based stress reduction for healthy individuals: a meta-analysis. J. Psychosom. Res. 78, 519–528 (2015).

    Article 
    PubMed 

    Google Scholar 

  • Khoury, B. et al. Mindfulness-based therapy: a comprehensive meta-analysis. Clin. Psychol. Rev. 33, 763–771 (2013).

    Article 
    PubMed 

    Google Scholar 

  • Sedlmeier, P. et al. The psychological effects of meditation: a meta-analysis. Psychol. Bull. 138, 1139–1171 (2012).

    Article 
    PubMed 

    Google Scholar 

  • Danitz, S. B. & Orsillo, S. M. The mindful way through the semester. Behav. Modif. 38, 549–566 (2014).

    Article 
    PubMed 

    Google Scholar 

  • Viskovich, S. & Pakenham, K. I. Randomized controlled trial of a web-based acceptance and commitment therapy (ACT) program to promote mental health in university students. J. Clin. Psychol. 76, 929–951 (2020).

    Article 
    PubMed 

    Google Scholar 

  • Neumeier, L. M., Brook, L., Ditchburn, G. & Sckopke, P. Delivering your daily dose of well-being to the workplace: a randomized controlled trial of an online well-being programme for employees. Eur. J. Work Organ. Psychol. 26, 555–573 (2017).

    Article 

    Google Scholar 

  • Ciarrochi, J., Hayes, S. C., Oades, L. G. & Hofmann, S. G. Toward a unified framework for positive psychology interventions: evidence-based processes of change in coaching, prevention, and training. Front. Psychol. 12, 809362 (2022).

    Article 
    PubMed 
    PubMed Central 

    Google Scholar 

  • Capaldi, C. A., Dopko, R. L. & Zelenski, J. M. The relationship between nature connectedness and happiness: a meta-analysis. Front. Psychol. 5, 976 (2014).

    Article 
    PubMed 
    PubMed Central 

    Google Scholar 

  • Rattenbury, C. & Stones, M. J. A controlled evaluation of reminiscence and current topics discussion groups in a nursing home context. Gerontol 29, 768–771 (1989).

    Article 

    Google Scholar 

  • Yousefi, Z., Sharifi, K., Tagharrobi, Z. & Akbari, H. The effect of narrative reminiscence on happiness of elderly women. Iran. Red. Crescent Méd. J. 17, e19612 (2015).

    PubMed 
    PubMed Central 

    Google Scholar 

  • Chesak, S. S. et al. Authentic connections groups: a pilot test of an intervention aimed at enhancing resilience among nurse leader mothers. Worldviews Evid. Based Nurs. 17, 39–48 (2020).

    Article 
    PubMed 

    Google Scholar 

  • Hirani, S. S. et al. Social support intervention to promote resilience and quality of life in women living in Karachi, Pakistan: a randomized controlled trial. Int. J. Public Health 63, 693–702 (2018).

    Article 
    PubMed 

    Google Scholar 

  • Rücker, G., Petropoulou, M. & Schwarzer, G. Network meta-analysis of multicomponent interventions. Biom. J. 62, 808–821 (2020).

    Article 
    PubMed 

    Google Scholar 

  • Tsokani, S., Seitidis, G. & Mavridis, D. Component network meta-analysis in a nutshell. BMJ Evid. Based Med. 28, 183–186 (2023).

    Article 
    PubMed 

    Google Scholar 

  • Higgins, J. P. T. et al. Consistency and inconsistency in network meta-analysis: concepts and models for multi-arm studies. Res. Synth. Methods 3, 98–110 (2012).

    Article 
    PubMed 

    Google Scholar 

  • Rücker, G. & Schwarzer, G. Ranking treatments in frequentist network meta-analysis works without resampling methods. BMC Méd. Res. Methodol. 15, 58 (2015).

    Article 
    PubMed 
    PubMed Central 

    Google Scholar 

  • Papakonstantinou, T., Nikolakopoulou, A., Higgins, J. P. T., Egger, M. & Salanti, G. CINeMA: software for semiautomated assessment of the confidence in the results of network meta-analysis. Campbell Syst. Rev. 16, e1080 (2020).

    Article 
    PubMed 
    PubMed Central 

    Google Scholar 

Continue Reading

  • A breakage–replication/fusion process explains complex rearrangements and segmental DNA amplification

    A breakage–replication/fusion process explains complex rearrangements and segmental DNA amplification

    We first show how breakage–replication/fusion converts free DNA ends into breakpoints on rearranged sequences and then show how breakage–replication/fusion of chromosome fragments produces segmental copy-number gains and amplifications. We place particular emphasis on distinguishing the genomic feature of a rearranged DNA sequence (for example, breakpoints) from the molecular feature of the ancestral chromosome (for example, DNA ends). See Supplementary Note, Section 1 for the complete list of definitions.

    Rearrangements from breakage–replication/fusion of DNA ends

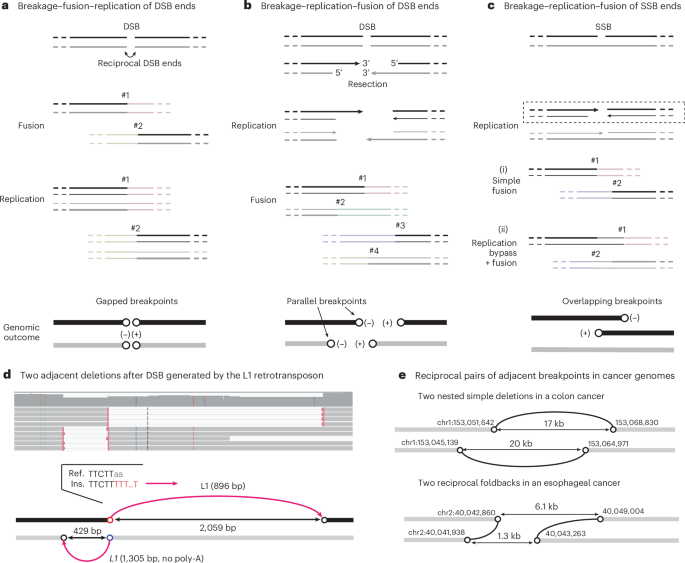
    A DNA double-strand break (DSB) generates two reciprocal DNA ends (Fig. 1a). In the G1 phase, these ends can undergo classical non-homologous end-joining (c-NHEJ): they can be ligated together, creating a rearranged sequence with small deletions (or less frequently, duplications), or ligated to DNA ends from distal sites, creating translocations29,30. In either scenario, the ancestral DNA ends are converted to two breakpoints (open circles in Fig. 1a) separated by a small gap, which we term adjacent gapped breakpoints. As the ligation(s) occur before replication, the rearranged DNA sequences are preserved in both sister chromatids after replication. This cascade of events defines the breakage–fusion–replication sequence (Supplementary Video 2).

    Fig. 1: Breakage–replication/fusion of DNA DSB and single-strand break ends.

    In ac, the two strands of the ancestral DNA are shown in black and gray: thick lines represent template DNA strands, thin lines represent newly synthesized DNA strands and arrows represent 3′ ends. Light-colored lines represent distal DNA sequences that are ligated to DSB ends derived from the original DNA. In the genomic outcomes, rearranged DNA is colored (black or gray) according to the ancestral DNA strand, and (−) and (+) denote the orientation of breakpoints defined by the directionality of copy-number transitions from left to right. Examples shown in d and e demonstrate the breakage–replication–fusion mechanism as shown in b. a, Breakage–fusion–replication of DSB ends. A single DSB generates two reciprocal DSB ends; each end is fused to a distal DNA end before replication (#1, #2), creating two reciprocal breakpoints separated by a small gap (open circles), termed adjacent gapped breakpoints. Note that after replication, both sister chromatids (black and gray) have the same breakpoints. b, Breakage–replication–fusion of DSB ends. Two DSB ends created by a single DSB undergo resection and replication, creating two pairs of replicated (sister) DNA ends that may undergo further end processing (not shown). Fusions of these DNA ends to distal DNA ends create four breakpoints in the rearranged sequences, one from each ancestral ssDNA end (5′ or 3′). Breakpoints derived from the 5′ end and 3′ end of a single ancestral DSB end (for example, #1 and #2) are adjacent and have the same orientation, termed adjacent parallel breakpoints. c, Breakage–replication–fusion of single-strand break (SSB) ends. Two ssDNA ends on the black strand are converted to two DSB ends by replication (dashed box). (i), The two DSB ends undergo simple fusions to create two gapped breakpoints, as in a. (ii), The DSB ends initiate homologous recombination using the intact sister chromatid (gray), creating two breakpoints with a small overlap by over-replication (replication bypass); we refer to these as adjacent overlapping breakpoints. The example here also shows a sister-chromatid exchange (breakpoint #2 is now on the gray chromatid). See Extended Data Fig. 8c for additional information. d, Two adjacent deletions resulting from a single DSB owing to L1 retrotransposition in an experimentally generated clone of RPE-1 cells. These are the only L1 insertions identified on this chromosome (chr14) in this clone. The deletions are supported by long reads (top) and define two pairs of adjacent breakpoints (bottom). Each deletion junction contains a truncated L1 insertion and joins two DNA ends derived from a single ancestral strand (black or gray); the polarity of each ancestral strand is determined from the directionality of the reverse-transcribed L1 (complementary to the L1 messenger RNA, magenta arrows). The red circle (chr14:50,762,606) marks the ancestral 3′ end that underwent target-primed reverse transcription: this is established by the poly-T sequence (in red in the insertion sequence junction (Ins.)) that marks the initiation of reverse transcription and by the ORF2p EN target sequence at the breakpoint (TTcTT|aa in the reference sequence (Ref.)). The blue circle below the red (chr14:50,762,603) is derived from the 3′ end on the opposite strand that also underwent reverse transcription initiated from an internal position of the L1 mRNA, showing no poly-A/T. The two distal breakpoints (black circles) are inferred to be derived from the resected 5′ ends. e, Two examples of reciprocal breakpoint pairs in cancer genomes identified from the rearrangement junctions from a previous publication16. Top: two nested simple deletions in a colon cancer that are similar to d but without insertions. Bottom: two reciprocal foldbacks (direct joining of parallel breakpoints from each side) in an esophageal cancer. Note that the ancestral strand of each rearranged DNA segment cannot be definitively determined solely based on the breakpoints, as some DSB ends may have 5′ overhangs. Therefore, the rearranged DNA segments are all shown in gray.

    If the DSB ends have substantial overhangs that prevent c-NHEJ31,32 (for example, because of 5′-resection33,34,35 or 3′-exonuclease degradation24), they can remain unligated during G1 and persist into S phase. During S phase, these ends, like broken chromosome ends36, are replicated to generate two ‘sister’ DNA ends. Ligations of these replicated DNA ends can generate up to four rearrangement junctions (Fig. 1b). This cascade of events defines the breakage–replication–fusion sequence (Supplementary Video 3). In breakage–replication–fusion, a staggered DNA end is converted into two adjacent but non-identical breakpoints with the same orientation, which we term adjacent parallel breakpoints. When the sister DNA ends are directly ligated to each other, it produces a ‘foldback’ junction, joining two adjacent parallel breakpoints. Foldback junctions are often assumed to indicate fusions between the ends of broken sister chromatids in BFB cycles37,38; later, we will show that such fusions also occur between sister DNA fragments.

    In a variation of breakage–replication–fusion, two single-strand DNA (ssDNA) ends with a small gap are converted into two reciprocal DSB ends by replication39,40 (Fig. 1c). These two DSB ends can generate two rearrangement breakpoints with either a small gap (i) or a small overlap (ii) by a replication bypass mechanism18,41,42. We refer to the latter as adjacent overlapping breakpoints.

    A single DSB end undergoes either breakage–fusion–replication or breakage–replication–fusion. However, when a catastrophic event creates many DNA breaks, some will undergo breakage–replication–fusion while others will undergo breakage–fusion–replication; we refer to the latter as the breakage–replication/fusion cycle.

    Adjacent parallel breakpoints from DNA end replication

    We first sought experimental evidence that a single DNA end can generate two adjacent parallel breakpoints. We exploited L1 retrotransposition to simultaneously generate and mark DSB ends. As described in a separate paper43, transient L1 expression in p53-null RPE-1 cells generated both L1 insertions and translocation junctions containing reverse-transcribed L1 sequences. Both outcomes originate from DSB ends generated by the L1 open reading frame 2 protein (ORF2p), and are identified by the insertion of reverse-transcribed sequences (the ‘primary’ end of retrotransposition) and/or the presence of ORF2p endonuclease target sequences near the break site.

    We identified multiple instances of adjacent parallel breakpoints in clones generated after L1 induction that had features indicating an origin from ORF2p-induced DSBs (Supplementary Note, Section 6). In the example shown in Fig. 1d, two nested deletions, each containing a truncated L1 insertion, indicate two pairs of adjacent parallel breakpoints (Fig. 1b). The sequence features at the two closest breakpoints (red and blue circles) directly relate them to L1 ORF2p, and the distances between each pair of parallel breakpoints (429 bp and 2,059 bp) are consistent with DSB resection33,34,35. Together, these observations demonstrate that breakage–replication–fusion can generate two parallel breakpoints from a single DSB end.

    Footprints of DNA end replication in human disease genomes

    We next sought evidence of DSB end replication in human disease genomes. Although we cannot directly relate a rearrangement breakpoint to an ancestral DNA end, we can identify an ancestral DSB from breakpoints derived from reciprocal DSB ends: in particular, a reciprocal pair of parallel breakpoints directly identifies reciprocal DSB ends that undergo breakage–replication–fusion (Fig. 1b,d).

    Based on the observations from the L1 clones (Fig. 1d and Supplementary Note, Section 6), we selected a heuristic threshold distance of 20 kb for the identification of adjacent parallel breakpoints (Methods). From 592,176 breakpoints detected in 2,588 cancers by the Pan-Cancer Analyses of Whole Genomes (PCAWG) study16, we identified 20,795 pairs of adjacent parallel breakpoints from 1,793 samples. These breakpoints were identified at 35,422 rearrangement junctions (12% of all junctions), including 7,393 foldback junctions. Thus, adjacent parallel breakpoints are a widespread feature in cancer genomes.

    For 3,138 pairs of adjacent parallel breakpoints, we identified one or multiple reciprocal breakpoints that demonstrate their origin from ancestral DSBs. There were 417 instances of reciprocal parallel breakpoints as shown in Fig. 1b. Among these were 53 instances of nested deletions (Supplementary Table 1) and 23 instances of reciprocal foldbacks (Supplementary Table 2), with examples shown in Fig. 1e. In the remaining instances, one or multiple breakpoints formed long-range translocations. Examples of reciprocal foldbacks were previously noted in ovarian cancers (supplementary fig. 8f of a previous publication44) but were assumed to result from BFB cycles. We suggest that these events arise from reciprocal DSB ends undergoing breakage–replication–fusion.

    We further assessed the probability that adjacent parallel breakpoints were generated independently based on the distance between these breakpoints and their distance to the nearest breakpoint on the opposite side (Methods). This analysis showed that for 16,132 of 20,795 pairs of adjacent parallel breakpoints, the probability that they were generated independently was less than 5%.

    In summary, adjacent parallel breakpoints are common in cancer genomes, and our analysis suggests that many of them are derived from sister DNA ends generated by breakage–replication–fusion.

    DNA duplication and amplification from breakage–replication/fusion

    When the sister DNA ends are joined together in a single rearranged chromosome, this rearranged chromosome will contain a duplication (Fig. 2a). Moreover, the duplicated segments will be bounded by adjacent parallel breakpoints derived from sister DNA ends. Consistent with this prediction, we identified examples of copy-number gains flanked by adjacent parallel breakpoints in both human cancers and congenital diseases14,15,45,46 (Extended Data Fig. 1 and Supplementary Note, Section 7).

    Fig. 2: Segmental DNA duplication and amplification from breakage–replication/fusion.
    figure 2

    a, A single breakage–replication–fusion cycle can lead to DNA duplications when two sister DNA fragments are retained in a single rearranged chromosome and segregated into one cell. See Extended Data Fig. 1 for examples from human disease genomes. b, Three processes of amplification from an acentric DNA fragment. (i), A head (H)-to-tail (T) junction (black vertical line) joining opposite ends of the DNA fragment creates a type I episome. (ii), Fusions between sister DNA ends on opposite sides of replicated DNA create a type II episome. In both scenarios, the ‘episome’ (acentric extra-chromosomal circles) can be amplified by uneven segregation. (iii), If sister-end fusion occurs on one side (head-to-head, black vertical line) of replicated DNA, and sister ends on the opposite side remain unligated (red arrows), the outcome is a double-sized linear DNA fragment. Iterations of the same process can create a large array of amplified DNA with only head-to-head and tail-to-tail junctions (later fusion junctions shown as red vertical lines). The amplified DNA can be either circular or linear and consists of only inverted duplications. In the schematic diagrams of amplified DNA on the right, the original DNA sequence is shown as a gray arrow to highlight the relative orientation of duplicated DNA. c, Amplification of the ERBB2 oncogene in the HCC1954 genome that is consistent with linear DNA amplification as shown in b. The copy-number plot shows total sequence coverage in 10 kb bins. Breakpoints forming long-range rearrangement junctions are shown as vertical lines (three breakpoints joining chr12 are shown in orange); curved arrows represent foldback junctions between adjacent parallel breakpoints (positions labeled next to the curved arrows). See Supplementary Note, Section 7 for the copy-number data and rearrangement junctions of the entire chr17. Consider the three foldback junctions near 39.5 Mb within the 0.5 Mb amplicon: if they were generated by BFB cycles, the location of each foldback junction would correspond to the break site of a different dicentric chromosome bridge; the probability of generating two additional breaks within 10 kb from the first break is (10 kb / 0.5 Mb)2 = 0.0004. Also note the proximity between the breakpoint at chr17:39,713,478 and the foldback junction between chr17:39,713,480 and 39,714,939.

    Foldback junctions are the simplest outcome when sister DNA ends are joined together. We envision two processes by which a double-stranded DNA (dsDNA) fragment can generate amplification with only foldback junctions (Fig. 2b). If both ends of a dsDNA fragment undergo breakage–replication–fusion to form foldback junctions (Fig. 2b (ii)), the outcome is a dimeric circular DNA (previously termed type II episomes47). Like simple monomeric DNA circles (type I episomes47; Fig. 2b (i)), dimeric DNA circles can fuel DNA amplification by asymmetric segregation over successive generations. This model explains the amplification at the AR locus flanked by foldback junctions in a castration-resistant prostate cancer46 (Extended Data Fig. 1a, right). Amplification can also occur on a linear acentric DNA fragment when the DNA ends on opposite sides fuse asynchronously (Fig. 2b (iii)). If sister DNA ends on one side are fused together, but sister DNA ends on the opposite side remain unligated (red arrows), the product is a linear inverted dimer. In the next cell cycle, another round of replication–fusion can create a circular or linear tetramer without any new breakage. Iterations of this process will produce a large tandem array of amplified DNA with ‘nested’ foldbacks that form homogeneously staining regions of inverted duplications48,49.

    One such example is the amplification spanning the ERBB2 oncogene in the HCC1954 breast cancer genome (Fig. 2c). Similar patterns were also found in chr8p, chr12p and chr20q in this genome (Extended Data Fig. 2a–c and Supplementary Tables 3 and 4). Here, amplified ERBB2 is contained in homogeneously staining regions37,50 and is bounded by multiple foldback junctions previously attributed to BFB cycles37. However, the probability of generating foldback junctions in such close proximity by successive BFB cycles is very small (see Fig. 2c caption). Under the breakage–replication/fusion model, the close proximity between foldback junctions near 39.5 Mb is a natural consequence of the close proximity between the 3′ and 5′ ends of an ancestral DSB end (Fig. 2b (iii)). Moreover, if amplification takes place on a linear, extra-chromosomal DNA fragment, secondary breakpoints (both foldbacks and long-range breakpoints) can only arise within the amplicon, thus explaining the concentration of breakpoints within the amplified region (39.5–40 Mb). Importantly, in linear DNA amplification, amplified DNA is automatically doubled and linked in one chromosome that is segregated into one daughter cell, thus providing a more rapid route to higher DNA copy number than amplification by random segregation of episomal circles. The amplification of DNA copy number also does not require selection during the intermediate steps of amplification; therefore, focal amplifications lacking oncogenes (Extended Data Fig. 2a–c) may be passengers that undergo clonal fixation.

    In summary, the presence of duplicated or amplified DNA segments flanked by adjacent parallel breakpoints suggests an origin from breakage–replication/fusion. From a single acentric DNA fragment, breakage–replication/fusion can generate dimeric DNA circles or a linear array of inverted duplications with closely spaced foldbacks, explaining the long-standing observation of inverted duplications in amplified DNA47,48,49 that are unlikely to arise by multi-generational BFB cycles37,38,44.

    Segmental copy-number gains after chromosome fragmentation

    Above, we described the rearrangement and copy-number outcomes of breakage–replication/fusion occurring at a single dsDNA end and a single dsDNA fragment with two ends. Below, we describe the copy-number and rearrangement outcomes of breakage–replication/fusion after chromosome fragmentation.

    We focused the analysis on an experimental model of chromothripsis (Fig. 3a, left) because this system enabled us to determine the structure of rearranged chromosomes with near-complete resolution (Methods). In a previous study21, we used CRISPR–Cas9 to generate chromosome bridges containing dicentric chr4 and derived single cells with a broken chr4 (Supplementary Note, Section 8). In one generation, bridge breakage produced daughter cells with reciprocal DNA retention and deletion21 similar to what was observed immediately after micronucleation20. However, over many generations, clones derived from single cells frequently had subclonal copy-number gains without reciprocal loss in the sibling clone21. The presence of copy-number gains in clones expanded after chromosome fragmentation was also observed in clones expanded after telomere crisis24 (Supplementary Note, Section 9) or micronucleation25 (Extended Data Fig. 3 and Supplementary Table 5).

    One bridge clone (primary clone 1a from a previous publication21, hereafter referred to as clone a) is interesting because the bulk DNA copy number oscillates between variable non-integer states that indicate subclonal copy-number variation (Fig. 3a, middle). Moreover, some subclones showed two-state copy number oscillation while others showed segmental copy-number gains (Fig. 3a, right, and Fig. 3b; also see fig. S22 from previous work21). The presence of subclonal copy-number variation enabled us to first determine the breakpoints of duplicated segments and then infer the evolutionary history of the rearrangements that produced the duplications (Methods and Supplementary Note, Sections 10 and 11). Based on a joint analysis of segmental DNA copy number (Supplementary Table 8) and rearrangement junctions (Supplementary Table 9), we determined both the structure (Extended Data Fig. 4) and the joining pattern (Extended Data Fig. 5) of nearly all duplicated segments in the subclones of clone a. In total, we identified 86 rearranged segments with sizes above 10 kb (Supplementary Tables 10–12) and 126 short insertions (<10 kb) between these segments (Supplementary Tables 13–16). We next show that the genomic features of the large segments, the short insertions and their arrangement in the rearranged chromosomes indicate that they all originate from breakage–replication/fusion of a single chromatid.

    Fig. 3: Segmental copy-number gains in a clone expanded after chromosome fragmentation.
    figure 3

    a, Left: experimental workflow; middle: bulk average DNA copy number of the 4A homolog (90 kb bins) in two clones, each derived from a daughter cell after breakage of a dicentric chr4 bridge. Note the non-integer copy-number states that indicate subclonal copy-number heterogeneity in both clones. Right: copy-number states in eight representative single-cell subclones derived from the top clone (clone a). Subclones a1 and a2 show mostly two-state copy-number oscillation (only one segment at three copies, indicated by ); a4 shows mostly three-state copy-number oscillation (only one segment at four copies, indicated by *); a5 shows four-state copy-number oscillation; a3 and a6 contain additional amplifications inferred to have been generated by secondary events. See Supplementary Table 8 for the complete segmental copy-number data of all the subclones. b, The copy number (25 kb bins, 4A haplotype) and rearranged segments of chr4p in subclone a5. There is an intact 4p copy in addition to the rearranged segments. Single-copy segments are shown as open bars, duplicated segments inferred to have been derived from sister DNA fragments by breakage–replication/fusion are shown as dark and light gray bars, and triplicated segments are shown as red bars. See Extended Data Fig. 5 for the order of rearranged segments in the rearranged chromosome.

    Large duplications from breakage–replication/fusion

    The origin of large duplications in clone a from ancestral chromosome fragments that underwent breakage–replication/fusion is established by two orthogonal lines of evidence that relate the boundaries of the duplications to ancestral DNA ends.

    First, we identified 18 pairs of duplicated segments that are flanked by identical (‘flush’) or adjacent parallel (‘staggered’) breakpoints within 20 kb (Fig. 4). Knowing the exact size of each duplicated segment, we could assess the probability that the staggered breakpoints were generated independently using the ratio of breakpoint distance to the segmental size (Extended Data Fig. 6). Based on this metric, we determined that for 15 out of 20 pairs of staggered breakpoints, the probability of independent breakpoint generation was less than 0.05 (Supplementary Table 11). For the remaining five pairs, the breakpoint distances were within a similar range but the segments were shorter; therefore, all staggered breakpoints are consistent with an origin from the replication of (hyper)resected DSB ends. For three pairs of segments (Bb1/Bb2, Cb1/Cb2, Cc1/Cc2), the presence of reciprocal breakpoints directly established their origin from chromosome fragmentation (Extended Data Fig. 7a). These data provide statistical evidence that the staggered boundaries of duplicated segments arose from breakage–replication–fusion.

    Fig. 4: Sister duplications in clone a defined by adjacent parallel breakpoints.
    figure 4

    Each bar represents a rearranged segment (also see Extended Data Fig. 4); the coordinates of segmental breakpoints are listed in Supplementary Table 10. Arcs connecting adjacent breakpoints represent foldback junctions. Segmental sizes are labeled, but segments are not shown true to scale. Top: two pairs of duplications with staggered breakpoints on both sides. Dark and lighter ends correspond to boundaries inferred to be derived from ancestral 3′-ssDNA and 5′-ssDNA ends. Bottom: 16 pairs of duplications with flush breakpoints on one side and staggered breakpoints on the other side. Fusions between these segments create compound sister segments as shown in Extended Data Fig. 7c. Segments in darker gray are inferred to be derived from the ancestral DNA strands with a 3′ overhang. Red arrows point to regions with clustered substitutions (kataegis) indicating strand-specific cytosine deamination: downward arrows indicate deamination of cytosines on forward strand DNA (TpC>TpT, TpG or TpA); upward arrows indicate deamination of cytosines on reverse strand DNA (GpA>ApA and so on). Except for the kataegis cluster on the right end of segment Bb2 (explained in Extended Data Fig. 7b), all the other clusters are restricted to the offset region inferred to be the 3′ overhang of the ancestral DNA (dark gray) and show deamination signatures consistent with the DNA strands predicted by the breakpoints. Diamonds indicate regions corresponding to origins of multiple insertions (see Fig. 5).

    Second, we observed strand-coordinated base substitutions near the staggered breakpoints that directly established their origin from staggered DSB ends. Based on the breakage–replication/fusion model, the shorter breakpoint derives from an ancestral 5′ end and the longer breakpoint derives from an ancestral 3′ end. Thus, the offset region between the two breakpoints originates from the ancestral ssDNA overhang. We identified seven clusters of substitutions near the staggered breakpoints (Fig. 4, downward or upward arrows), six of which were restricted to the offset region (the only exception near the right side of the shorter Bb2 segment is explained in Extended Data Fig. 7b.) All the substitutions reflect deamination in the TpC context that is consistent with the outcome of ssDNA deamination by APOBEC enzymes51. Importantly, the signature of substitutions (C > X on the right side of each segment, downward arrows; G > X on the left side of each segment, upward arrows) directly established the deaminated ssDNA to be a 3′ overhang. Thus, the pattern of deamination between staggered breakpoints provides molecular evidence for their origin from staggered DSB ends. Additional evidence linking staggered breakpoints to staggered DSB ends comes from the coordination between breakpoints on opposite sides of duplicated segments (Extended Data Fig. 7c and caption).

    Based on adjacent parallel breakpoints, we determined that 40 duplicated segments in clone a were derived from ancestral sister DNA fragments generated by breakage–replication/fusion (Supplementary Table 10).

    DNA over-replication from breakage–replication/fusion

    In addition to nearly identical duplications generated by normal, semi-conservative replication of ancestral chromosome fragments, we also identified rare examples reflecting two mechanisms of DNA over-replication. The replication bypass mechanism41,42 (Fig. 1c) explains two instances of overlapping duplications18,52 (Extended Data Fig. 8a–c and caption); the second mechanism, leading to re-replication of a previously replicated DNA fragment, occurs when the previously replicated segment is fused to an unreplicated segment with unfired origins (Extended Data Fig. 8d and caption).

    Short insertions from breakage–replication/fusion

    We identified 126 short insertions (median size, 184 bp) at the junctions between large duplications in clone a (Supplementary Tables 13–16). Three pieces of evidence indicate that both the insertions and the insertion rearrangement junctions are generated by chromosome breakage–replication/fusion.

    First, when mapped to their origin sites, the insertions displayed several features indicating DNA fragmentation. Nearly all insertions (113 out of 126) were mapped to sites in close proximity (<10 kb) to breakpoints inferred to have been derived from ancestral DNA ends. Moreover, at several sites, the insertions lined up one after another in a tiling pattern, with little gap or overlap (Fig. 5a,b). The tiling pattern of insertions at the origin sites is incompatible with random polymerase template-switching events in MMBIR that are expected to generate duplicated sequences with either large gaps or large overlaps at their original sites (Supplementary Video 4). Finally, seven tiles of insertions were mapped right next to breakpoints derived from the 5′ ends of ancestral DSBs (Figs. 4 and 5b and Supplementary Table 13). Similar patterns were also observed in other experimentally generated clones with chromothripsis (Supplementary Note, Sections 6, 9 and 14), in cancer genomes (Extended Data Fig. 9 and Supplementary Note, Section 7) and in congenital disorders53. Based on these observations, we suggest that many insertions originate as ssDNA fragments complementary to the 3′ overhang of resected DSBs. Two potential models for the generation of these insertions are discussed in Supplementary Note, Section 3.

    Fig. 5: Origin and arrangement of short insertions between large duplications in clone a.
    figure 5

    a, An example of nine short insertions mapped to a region adjacent to the left breakpoint of the G2 segment shown in Fig. 4. The sizes and locations of the insertions (black arrows) are shown true to scale. We infer these insertions to have originated as ssDNA fragments of forward strand DNA based on the signature of deamination (C > T) on the opposite (right) end of the G2 segment. b, Tiling pattern of insertions at nine loci, including the example shown in a (36.13 Mb). Each tile consists of four or more short sequences that originate from adjacent locations but are identified at different destination junctions (shown in c). Insertions from each tile have the same color; the same color scheme is used in c to reflect the origin sites of each insertion. For example, the nine insertions mapped to 36.13 Mb are identified in junctions c1, c2, c6, c7, c11 and c13. See Supplementary Tables 13 and 15 for the mapping between the origins and destinations of all insertions. Both the size of each insertion (arrow) and the distance between neighbor insertions (open rectangles for gaps; filled rectangles for overlaps) are log transformed (same as in c). Except for the tile at 46.17 Mb, all the other tiles are adjacent to segmental breakpoints inferred to have been derived from ssDNA ends: the tile at 47.09 Mb is next to a breakpoint derived from an ancestral 3′ end; all the remaining tiles are next to breakpoints derived from ancestral 5′ ends. The original strands of insertions (left-facing arrows indicate ssDNA from the reverse strand; right-facing arrows indicate ssDNA from the forward strand) are inferred based on the strands of the ancestral DNA ends. c, Arrangement of insertions at 13 destination junctions (c1–c13) with two or more insertions (‘chains’ of insertions; see Extended Data Fig. 9a and Supplementary Table 15). Except for c13, which is assembled from short reads, all the remaining are resolved by both short and long reads. The color of each insertion reflects its origin, as shown in b; open arrows represent insertions from other regions. The directionality of each arrow indicates the strand of the inserted sequence in the rearrangement junction. Open bars without arrowheads (at junctions c1, c8 and c9) represent insertions whose original strands could not be determined. If a chain of insertions is generated by conservative DNA synthesis as in MMBIR, then all the inserted sequences have to be added to one strand; that is, the arrows need to point in the same direction. Clear violation of such strand coordination is seen in all chains except c11 and c12.

    Second, the joining pattern of insertions in rearranged DNA suggested DNA end-joining repair. A total of 111 out of 126 insertions were assembled into 17 chains (c1–c17) of two or more tandem insertions at rearrangement junctions (Supplementary Table 15), 13 of which are shown in Fig. 5c. These chains were only identified at junctions inferred to be breakage–replication–fusion junctions formed in S/G2, but not breakage–fusion–replication junctions formed in G1. Moreover, the junctions between the neighbor insertions within each chain often showed either >2 bp microhomology or additions of non-templated nucleotides. By contrast, breakage–fusion–replication junctions had few insertions and little microhomology, consistent with c-NHEJ in G1. Therefore, the insertion junctions probably arise from microhomology-mediated end-joining of sister DNA ends in breakage–replication–fusion.

    Finally, and most definitively, the strand orientation of insertions at their destination junctions suggests that they were incorporated into both DNA strands and could not have arisen from a conservative replicative process14,16 such as MMBIR. Under the MMBIR model11,14, insertions at each junction are continuously added to the 3′ end of the nascent leading strand that jumps from one template to the next; therefore, all the insertions would be added to a single strand in the rearranged DNA. As the original DNA strands of the insertions could be inferred from the adjacency between the insertions and nearby breakpoints (left-facing or right-facing arrows Fig. 5b), we were able to directly test whether the insertions were added to the same strand in the rearranged DNA. If we consider every pair of insertions that are next to each other in every insertion chain (Supplementary Table 15), 38 pairs are added to the same strand (arrows pointing to the same direction in Fig. 5c) but 41 pairs are added to opposite strands (arrows pointing to opposite directions). This observation therefore excludes MMBIR as the mechanism for generating the insertion junctions.

    In summary, the genomic features of short insertions in clone a indicate that both the inserted sequences and the insertion junctions were generated in the same breakage–replication/fusion cycle that produced large duplications.

    Genomic complexity from one breakage–replication/fusion cycle

    Based on the general assumption that breakpoints in close proximity arise at approximately the same time16, we inferred that all the breakpoints and junctions in the ancestral rearranged chr4 of clone a (Extended Data Fig. 5c) were generated in a single breakage–replication/fusion cycle. Moreover, except for the rare instances of over-replication (Extended Data Fig. 8), all the ancestral segments, including short insertions, could be traced to non-overlapping ssDNA fragments. Therefore, the ancestral rearranged chr4 of clone a was most likely derived from a single ancestral chromatid over one breakage–replication/fusion cycle.

    Breakage–replication/fusion explains genomic complexity

    A single breakage–replication/fusion cycle can generate both segmental duplications flanked by adjacent parallel breakpoints and rearrangement junctions containing insertions originating from DSB ends (Fig. 6). To assess the contribution of breakage–replication/fusion to insertion rearrangements in cancer genomes, we analyzed insertions in the PCAWG data. We identified 85,684 potential insertions with a median size of ~2 kb (Methods and Extended Data Fig. 10a). These insertions accounted for 29% of all rearrangement breakpoints; 48% of insertions (41,445 out of 85,684) were mapped to regions within 10 kb from another breakpoint, but overlapping breakpoints were rare (<5% of insertions show 10 bp or larger overlap). These observations were consistent with the features of insertions generated by the breakage–replication/fusion mechanism (Fig. 5). Moreover, the two signatures of breakage–replication/fusion—adjacent parallel breakpoints and short insertions from a single DSB end—provide intuitive explanations for many complex rearrangement footprints that were identified in the PCAWG study16 but to date had no mechanistic interpretation (Fig. 6b and Extended Data Fig. 10).

    Fig. 6: Segmental copy-number alterations and rearrangement breakpoints generated by breakage–replication/fusion.
    figure 6

    a, Segmental copy-number gain and loss generated by a breakage–replication/fusion cycle, including both breakage–fusion–replication and breakage–replication–fusion. The ancestral broken chromosome consists of six segments (shown in different colors) bounded by ten DSB ends; the rightmost segment also contains a single-strand gap with two ssDNA ends. Six DSB ends undergo ligation (fusion) in G1 (thin dotted lines), creating three chromosome fragments. After replication, there are seven new fragments (sister fragments are shown in dark and light colors) with ten new DSB ends: four pairs of sister DNA ends (outlined) plus two reciprocal DNA ends generated from the ssDNA gap. Fusions between the DSB ends in G2 (thick dotted lines) create reciprocal copy-number gains and losses on both sister chromatids. b, Footprints of rearrangement breakpoints generated by breakage–replication/fusion. Shown is one possible outcome when the left DNA end undergoes breakage–replication–fusion and the right DNA end undergoes breakage–fusion–replication. Top: ancestral DNA ends; middle: rearrangement breakpoints. Breakage–fusion–replication generates two flush breakpoints; breakage–replication–fusion generates two staggered breakpoints and a short insertion. Bottom: four complex structural variant (SV) footprints identified in cancer genomes16 that can be explained by breakpoints generated in one breakage–replication/fusion cycle. Each footprint is represented by a collection of breakpoints on either the left (−) or the right (+) of adjacent segments (A, B, …). Note that the breakpoint orientation (+/−) in the original study16 is opposite to our convention. The first three footprints (all having three breakpoints) were discussed in the supplementary information of the original study (pages 76–81); the last footprint with five breakpoints was shown in supplementary fig. 48 (page 82) of the same study. Numbers in parentheses represent the total counts of instances of each footprint reported in the original study, regardless of the joining pattern between breakpoints.

    Continue Reading

  • Building material stock drives embodied carbon emissions and risks future climate goals in China

    Building material stock drives embodied carbon emissions and risks future climate goals in China

  • Yang, X. J. China’s rapid urbanization. Science 342, 310–310 (2013).

    Article 
    CAS 

    Google Scholar 

  • Chen, M. & Graedel, T. E. A half-century of global phosphorus flows, stocks, production, consumption, recycling, and environmental impacts. Glob. Environ. Change 36, 139–152 (2016).

    Article 

    Google Scholar 

  • Zhong, X., Deetman, S., Tukker, A. & Behrens, P. Increasing material efficiencies of buildings to address the global sand crisis. Nat. Sustain. 5, 389–392 (2022).

    Article 

    Google Scholar 

  • Liu, G., Bangs, C. E. & Müller, D. B. Stock dynamics and emission pathways of the global aluminium cycle. Nat. Clim. Change 3, 338–342 (2013).

    Article 
    CAS 

    Google Scholar 

  • Müller, D. B. et al. Carbon emissions of infrastructure development. Environ. Sci. Technol. 47, 11739–11746 (2013).

    Article 

    Google Scholar 

  • Krausmann, F., Wiedenhofer, D. & Haberl, H. Growing stocks of buildings, infrastructures and machinery as key challenge for compliance with climate targets. Glob. Environ. Change 61, 102034 (2020).

    Article 

    Google Scholar 

  • Building Materials and the Climate: Constructing a New Future (United Nations Environment Programme, 2023).

  • Pandey, B., Brelsford, C. & Seto, K. C. Rising infrastructure inequalities accompany urbanization and economic development. Nat. Commun. 16, 1193 (2025).

    Article 
    CAS 

    Google Scholar 

  • Pandey, B., Brelsford, C. & Seto, K. C. Infrastructure inequality is a characteristic of urbanization. Proc. Natl Acad. Sci. USA 119, e2119890119 (2022).

    Article 
    CAS 

    Google Scholar 

  • Song, L. et al. China’s bulk material loops can be closed but deep decarbonization requires demand reduction. Nat. Clim. Change 13, 1136–1143 (2023).

    Article 

    Google Scholar 

  • Röck, M. et al. Embodied GHG emissions of buildings—the hidden challenge for effective climate change mitigation. Appl. Energy 258, 114107 (2020).

    Article 

    Google Scholar 

  • De Coninck, H. et al. in Global Warming of 1.5 °C: Summary for Policy Makers 313-443 (IPCC, 2018).

  • Watari, T., Cabrera Serrenho, A., Gast, L., Cullen, J. & Allwood, J. Feasible supply of steel and cement within a carbon budget is likely to fall short of expected global demand. Nat. Commun. 14, 7895 (2023).

    Article 
    CAS 

    Google Scholar 

  • Xia, X. et al. The carbon budget of China: 1980–2021. Sci. Bull. 69, 114–124 (2024).

    Article 

    Google Scholar 

  • Lu, H. et al. Reducing China’s building material embodied emissions: opportunities and challenges to achieve carbon neutrality in building materials. iScience https://doi.org/10.1016/j.isci.2024.109028 (2024).

  • Frantz, D. et al. Unveiling patterns in human dominated landscapes through mapping the mass of US built structures. Nat. Commun. 14, 8014 (2023).

    Article 
    CAS 

    Google Scholar 

  • Wiedenhofer, D. et al. Mapping material stocks of buildings and mobility infrastructure in the United Kingdom and the Republic of Ireland. Resour. Conserv. Recycl. 206, 107630 (2024).

    Article 

    Google Scholar 

  • Haberl, H. et al. High-resolution maps of material stocks in buildings and infrastructures in Austria and Germany. Environ. Sci. Technol. 55, 3368–3379 (2021).

    Article 
    CAS 

    Google Scholar 

  • Haberl, H. et al. Weighing the global built environment: high-resolution mapping and quantification of material stocks in buildings. J. Ind. Ecol. 29, 159–172 (2024).

    Article 

    Google Scholar 

  • Bao, Y. et al. High-resolution mapping of material stocks in the built environment across 50 Chinese cities. Resour. Conserv. Recycl. 199, 107232 (2023).

    Article 

    Google Scholar 

  • Sun, J., Wang, T., Jiang, N., Liu, Z. & Gao, X. Gridded material stocks in China based on geographical and geometric configurations of the built-environment. Sci. Data 10, 915 (2023).

    Article 

    Google Scholar 

  • Cai, B. et al. Mapping material stocks in buildings and infrastructures across the Beijing–Tianjin–Hebei urban agglomeration at high-resolution using multi-source geographical data. Resour. Conserv. Recycl. 205, 107561 (2024).

    Article 

    Google Scholar 

  • Elhacham, E., Ben-Uri, L., Grozovski, J., Bar-On, Y. M. & Milo, R. Global human-made mass exceeds all living biomass. Nature 588, 442–444 (2020).

    Article 
    CAS 

    Google Scholar 

  • Deng, Y., Qi, W., Fu, B. & Wang, K. Geographical transformations of urban sprawl: exploring the spatial heterogeneity across cities in China 1992–2015. Cities 105, 102415 (2020).

    Article 

    Google Scholar 

  • Wang, J., Lin, Y., Glendinning, A. & Xu, Y. Land-use changes and land policies evolution in China’s urbanization processes. Land Use Policy 75, 375–387 (2018).

    Article 

    Google Scholar 

  • Cai, Z., Liu, Q. & Cao, S. Real estate supports rapid development of China’s urbanization. Land Use Policy 95, 104582 (2020).

    Article 

    Google Scholar 

  • Zhao, S. et al. Spatial and temporal dimensions of urban expansion in China. Environ. Sci. Technol. 49, 9600–9609 (2015).

    Article 
    CAS 

    Google Scholar 

  • Lin, W. et al. Regional differences of urbanization in China and its driving factors. Sci. China Earth Sci. 61, 778–791 (2018).

    Article 

    Google Scholar 

  • Guo, J., Yu, Z., Ma, Z., Xu, D. & Cao, S. What factors have driven urbanization in China. Environ., Dev. Sustain. 24, 6508–6526 (2022).

    Article 

    Google Scholar 

  • Zhang, C., Zhou, B. & Wang, Q. Effect of China’s western development strategy on carbon intensity. J. Clean. Prod. 215, 1170–1179 (2019).

    Article 

    Google Scholar 

  • Pauliuk, S., Carrer, F., Heeren, N. & Hertwich, E. G. Scenario analysis of supply- and demand-side solutions for circular economy and climate change mitigation in the global building sector. J. Ind. Ecol. 28, 1699–1715 (2024).

    Article 

    Google Scholar 

  • Tanikawa, H. et al. A framework of indicators for associating material stocks and flows to service provisioning: application for Japan 1990–2015. J. Clean. Prod. 285, 125450 (2021).

    Article 

    Google Scholar 

  • Lanau, M. et al. Taking stock of built environment stock studies: progress and prospects. Environ. Sci. Technol. 53, 8499–8515 (2019).

    Article 
    CAS 

    Google Scholar 

  • Streeck, J., Dammerer, Q., Wiedenhofer, D. & Krausmann, F. The role of socio-economic material stocks for natural resource use in the United States of America from 1870 to 2100. J. Ind. Ecol. 25, 1486–1502 (2021).

    Article 

    Google Scholar 

  • Xie, J., Wei, N. & Gao, Q. Assessing spatiotemporal population density dynamics from 2000 to 2020 in megacities using urban and rural morphologies. Sci. Rep. 14, 14166 (2024).

    Article 
    CAS 

    Google Scholar 

  • Zhang, P. et al. Remote sensing modeling of urban density dynamics across 36 major cities in China: fresh insights from hierarchical urbanized space. Landsc. Urban Plan. 203, 103896 (2020).

    Article 

    Google Scholar 

  • Lenzen, M. et al. Implementing the material footprint to measure progress towards Sustainable Development Goals 8 and 12. Nat. Sustain. 5, 157–166 (2022).

    Article 

    Google Scholar 

  • Hu, M. et al. Iron and steel in Chinese residential buildings: a dynamic analysis. Resour. Conserv. Recycl. 54, 591–600 (2010).

    Article 

    Google Scholar 

  • Zhong, X. et al. Global greenhouse gas emissions from residential and commercial building materials and mitigation strategies to 2060. Nat. Commun. 12, 6126 (2021).

    Article 
    CAS 

    Google Scholar 

  • Huang, T., Shi, F., Tanikawa, H., Fei, J. & Han, J. Materials demand and environmental impact of buildings construction and demolition in China based on dynamic material flow analysis. Resour. Conserv. Recycl. 72, 91–101 (2013).

    Article 

    Google Scholar 

  • Fernando, Y. & Hor, W. L. Impacts of energy management practices on energy efficiency and carbon emissions reduction: a survey of Malaysian manufacturing firms. Resour. Conserv. Recycl. 126, 62–73 (2017).

    Article 

    Google Scholar 

  • Pan, W. & Pan, M. Opportunities and risks of implementing zero-carbon building policy for cities: Hong Kong case. Appl. Energy 256, 113835 (2019).

    Article 

    Google Scholar 

  • Hossain, M. U., Poon, C. S., Dong, Y. H. & Xuan, D. Evaluation of environmental impact distribution methods for supplementary cementitious materials. Renew. Sustain. Energy Rev. 82, 597–608 (2018).

    Article 
    CAS 

    Google Scholar 

  • Singh, A. P. Assessment of India’s Green Hydrogen Mission and environmental impact. Renew. Sustain. Energy Rev. 203, 114758 (2024).

    Article 
    CAS 

    Google Scholar 

  • Fan, J.-L. et al. A net-zero emissions strategy for China’s power sector using carbon-capture utilization and storage. Nat. Commun. 14, 5972 (2023).

    Article 
    CAS 

    Google Scholar 

  • Chen, S., Liu, J., Zhang, Q., Teng, F. & McLellan, B. C. A critical review on deployment planning and risk analysis of carbon capture, utilization, and storage (CCUS) toward carbon neutrality. Renew. Sustain. Energy Rev. 167, 112537 (2022).

    Article 
    CAS 

    Google Scholar 

  • Wang, N. et al. Optimal CCUS supply chain toward carbon neutrality: novel framework for thermal power, iron-steel, and cement sectors. Ind. Eng. Chem. Res. 63, 4460–4477 (2024).

    Article 
    CAS 

    Google Scholar 

  • Che, Y. et al. 3D-GloBFP: the first global three-dimensional building footprint dataset. Earth Syst. Sci. Data 16, 5357–5374 (2024).

    Article 

    Google Scholar 

  • Zhang, Z. et al. Vectorized rooftop area data for 90 cities in China. Sci. Data 9, 66 (2022).

    Article 
    CAS 

    Google Scholar 

  • Zhang, Z. et al. Carbon mitigation potential afforded by rooftop photovoltaic in China. Nat. Commun. 14, 2347 (2023).

    Article 
    CAS 

    Google Scholar 

  • Li, X. et al. Mapping global urban boundaries from the global artificial impervious area (GAIA) data. Environ. Res. Lett. 15, 094044 (2020).

    Article 

    Google Scholar 

  • Wu, W.-B. et al. A first Chinese building height estimate at 10 m resolution (CNBH-10 m) using multi-source Earth observations and machine learning. Remote Sens. Environ. 291, 113578 (2023).

    Article 

    Google Scholar 

  • Ma, X. et al. Mapping fine-scale building heights in urban agglomeration with spaceborne lidar. Remote Sens. Environ. 285, 113392 (2023).

    Article 

    Google Scholar 

  • Che, Y. et al. Mapping of individual building heights reveals the large gap of urban-rural living spaces in the contiguous US. Innov. Geosci. 2, 100069 (2024).

    Article 
    CAS 

    Google Scholar 

  • Herfort, B., Lautenbach, S., Porto de Albuquerque, J., Anderson, J. & Zipf, A. A spatio-temporal analysis investigating completeness and inequalities of global urban building data in OpenStreetMap. Nat. Commun. 14, 3985 (2023).

    Article 
    CAS 

    Google Scholar 

  • P, G. et al. Mapping essential urban land use categories in China (EULUC-China): preliminary. Sci. Bull. 65, 182–187 (2020).

    Article 

    Google Scholar 

  • Zhou, Z.-H. & Feng, J. Deep forest. Natl Sci. Rev. 6, 74–86 (2018).

    Article 

    Google Scholar 

  • Feng, Q. et al. Long-term gridded land evapotranspiration reconstruction using Deep Forest with high generalizability. Sci. Data 10, 908 (2023).

    Article 

    Google Scholar 

  • Kennedy, R. E. et al. Implementation of the LandTrendr Algorithm on Google Earth Engine. Remote Sens. 10, 691 (2018).

    Article 

    Google Scholar 

  • Wang, Y. et al. High-resolution maps show that rubber causes substantial deforestation. Nature 623, 340–346 (2023).

    Article 
    CAS 

    Google Scholar 

  • Ni, H., Yu, L., Gong, P., Li, X. & Zhao, J. Urban renewal mapping: a case study in Beijing from 2000 to 2020. J. Remote Sens. 3, 0072 (2023).

  • Gong, P. et al. Annual maps of global artificial impervious area (GAIA) between 1985 and 2018. Remote Sens. Environ. 236, 111510 (2020).

    Article 

    Google Scholar 

  • Tatem, A. J. WorldPop, open data for spatial demography. Sci. Data 4, 170004 (2017).

    Article 

    Google Scholar 

  • Chen, B. et al. Contrasting inequality in human exposure to greenspace between cities of Global North and Global South. Nat. Commun. 13, 4636 (2022).

    Article 
    CAS 

    Google Scholar 

  • Röck, M., Balouktsi, M. & Ruschi Mendes Saade, M. Embodied carbon emissions of buildings and how to tame them. One Earth 6, 1458–1464 (2023).

    Article 

    Google Scholar 

  • IPCC. Climate Change 2022: Mitigation of Climate Change. Contribution of Working Group III to the Sixth Assessment Report of the Intergovernmental Panel on Climate Change (eds Shukla, P. R. et al.) (Cambridge Univ. Press, 2023).

  • Grant, D., Hansen, T., Jorgenson, A. & Longhofer, W. A worldwide analysis of stranded fossil fuel assets’ impact on power plants’ CO2 emissions. Nat. Commun. 15, 7517 (2024).

    Article 
    CAS 

    Google Scholar 

  • Zhang, C. & Chen, Z. Building material stock drives embodied carbon emissions and risks future climate goals in China. Zenodo https://doi.org/10.5281/zenodo.17174497 (2025).

  • Continue Reading

  • Effective combinatorial antifungal therapy using a host defense peptide mimic that self-assembles into delivery micelles

    Effective combinatorial antifungal therapy using a host defense peptide mimic that self-assembles into delivery micelles

  • GBD 2021 Antimicrobial Resistance Collaborators Global burden of bacterial antimicrobial resistance 1990–2021: a systematic analysis with forecasts to 2050. Lancet 404, 1199–1226 (2024).

    Article 

    Google Scholar 

  • Denning, D. W. Global incidence and mortality of severe fungal disease. Lancet Infect. Dis. 24, e428–e438 (2024).

    Article 
    PubMed 

    Google Scholar 

  • Zhang, F. et al. A marine microbiome antifungal targets urgent-threat drug-resistant fungi. Science 370, 974–978 (2020).

    Article 
    CAS 
    PubMed 
    PubMed Central 

    Google Scholar 

  • Fisher, M. C. et al. Tackling the emerging threat of antifungal resistance to human health. Nat. Rev. Microbiol. 20, 557–571 (2022).

    Article 
    CAS 
    PubMed 
    PubMed Central 

    Google Scholar 

  • Hancock, R. E. W. & Sahl, H.-G. Antimicrobial and host-defense peptides as new anti-infective therapeutic strategies. Nat. Biotechnol. 24, 1551–1557 (2006).

    Article 
    CAS 
    PubMed 

    Google Scholar 

  • Homer, J. A., Johnson, R. M., Koelln, R. A., Moorhouse, A. D. & Moses, J. E. Strategic re-engineering of antibiotics. Nat. Rev. Bioeng. 3, 213–229 (2025).

    Article 
    CAS 
    PubMed 

    Google Scholar 

  • Fisher, M. C., Hawkins, N. J., Sanglard, D. & Gurr, S. J. Worldwide emergence of resistance to antifungal drugs challenges human health and food security. Science 360, 739–742 (2018).

    Article 
    CAS 
    PubMed 

    Google Scholar 

  • Ho, C. S. et al. Antimicrobial resistance: a concise update. Lancet Microbe 6, 100947 (2025).

    Article 
    PubMed 

    Google Scholar 

  • Xiong, M. et al. Helical antimicrobial polypeptides with radial amphiphilicity. Proc. Natl Acad. Sci. USA 112, 13155–13160 (2015).

    Article 
    CAS 
    PubMed 
    PubMed Central 

    Google Scholar 

  • Li, X. et al. Supramolecular antibacterial materials for combatting antibiotic resistance. Adv. Mater. 31, e1805092 (2019).

    Article 
    PubMed 

    Google Scholar 

  • Kong, H. et al. Development of aromatic-linked diamino acid antimicrobial peptide mimics with low hemolytic toxicity and excellent activity against methicillin-resistant Staphylococcus aureus (MRSA). J. Med. Chem. 66, 7756–7771 (2023).

    Article 
    CAS 
    PubMed 

    Google Scholar 

  • Ghosh, C., Sarkar, P., Issa, R. & Haldar, J. Alternatives to conventional antibiotics in the era of antimicrobial resistance. Trends Microbiol. 27, 323–338 (2019).

    Article 
    CAS 
    PubMed 

    Google Scholar 

  • Lehar, J. et al. Synergistic drug combinations tend to improve therapeutically relevant selectivity. Nat. Biotechnol. 27, 659–666 (2009).

    Article 
    CAS 
    PubMed 
    PubMed Central 

    Google Scholar 

  • Brochado, A. R. et al. Species-specific activity of antibacterial drug combinations. Nature 559, 259–263 (2018).

    Article 
    CAS 
    PubMed 
    PubMed Central 

    Google Scholar 

  • Si, Z., Pethe, K. & Chan-Park, M. B. Chemical basis of combination therapy to combat antibiotic resistance. JACS Au 3, 276–292 (2023).

    Article 
    CAS 
    PubMed 
    PubMed Central 

    Google Scholar 

  • Ding, X. et al. A macromolecule reversing antibiotic resistance phenotype and repurposing drugs as potent antibiotics. Adv. Sci. 7, 2001374 (2020).

    Article 
    CAS 

    Google Scholar 

  • Si, Z. et al. A glycosylated cationic block poly(β-peptide) reverses intrinsic antibiotic resistance in all ESKAPE Gram-negative bacteria. Angew. Chem. Int. Ed. 59, 6819–6826 (2020).

    Article 
    CAS 

    Google Scholar 

  • Gong, Y., Wang, H. & Sun, J. AMP-mimetic antimicrobial polymer-involved synergic therapy with various coagents for improved efficiency. Biomacromolecules 25, 4619–4638 (2024).

    Article 
    CAS 
    PubMed 

    Google Scholar 

  • Schmidt, N. W. et al. Engineering persister-specific antibiotics with synergistic antimicrobial functions. ACS Nano 8, 8786–8793 (2014).

    Article 
    CAS 
    PubMed 
    PubMed Central 

    Google Scholar 

  • Bai, H. et al. A supramolecular antibiotic switch for antibacterial regulation. Angew. Chem. Int. Ed. 54, 13208–13213 (2015).

    Article 
    CAS 

    Google Scholar 

  • Liu, L. et al. Self-assembled cationic peptide nanoparticles as an efficient antimicrobial agent. Nat. Nanotechnol. 4, 457–463 (2009).

    Article 
    CAS 
    PubMed 

    Google Scholar 

  • Jiang, W. et al. Peptide-mimicking poly(2-oxazoline)s possessing potent antifungal activity and BBB penetrating property to treat invasive infections and meningitis. J. Am. Chem. Soc. 145, 25753–25765 (2023).

    Article 
    CAS 
    PubMed 

    Google Scholar 

  • Zhou, M. et al. A dual-targeting antifungal is effective against multidrug-resistant human fungal pathogens. Nat. Microbiol 9, 1325–1339 (2024).

    Article 
    CAS 
    PubMed 

    Google Scholar 

  • Zhang, X. et al. Development of lipo-γ-AA peptides as potent antifungal agents. J. Med. Chem. 65, 8029–8039 (2022).

    Article 
    CAS 
    PubMed 

    Google Scholar 

  • Liu, F. et al. Synergistic wall digestion and cuproptosis against fungal infections using lywallzyme-induced self-assembly of metal-phenolic nanoflowers. Nat. Commun. 15, 9004 (2024).

    Article 
    CAS 
    PubMed 
    PubMed Central 

    Google Scholar 

  • Chen, L. et al. Brain glucose induces tolerance of Cryptococcus neoformans to amphotericin B during meningitis. Nat. Microbiol 9, 346–358 (2024).

    Article 
    PubMed 

    Google Scholar 

  • Maji, A. et al. Tuning sterol extraction kinetics yields a renal-sparing polyene antifungal. Nature 623, 1079–1085 (2023).

    Article 
    CAS 
    PubMed 
    PubMed Central 

    Google Scholar 

  • Bennett, J. E. et al. A comparison of amphotericin B alone and combined with flucytosine in the treatment of cryptoccal meningitis. N. Engl. J. Med. 301, 126–131 (1979).

    Article 
    CAS 
    PubMed 

    Google Scholar 

  • Beck, A., Goetsch, L., Dumontet, C. & Corvaia, N. Strategies and challenges for the next generation of antibody–drug conjugates. Nat. Rev. Drug Discov. 16, 315–337 (2017).

    Article 
    CAS 
    PubMed 

    Google Scholar 

  • Li, X., et al. Multifunctional nanoparticle-mediated combining therapy for human diseases. Signal Transduct. Target. Ther. 9, 1 (2024).

    Article 
    PubMed 
    PubMed Central 

    Google Scholar 

  • Detappe, A. et al. Molecular bottlebrush prodrugs as mono- and triplex combination therapies for multiple myeloma. Nat. Nanotechnol. 18, 184–192 (2023).

    Article 
    CAS 
    PubMed 
    PubMed Central 

    Google Scholar 

  • Sofias, A. M. & Lammers, T. Multidrug nanomedicine. Nat. Nanotechnol. 18, 104–106 (2023).

    Article 
    CAS 
    PubMed 

    Google Scholar 

  • Cheng, T. et al. Green tea catechin-based complex micelles combined with doxorubicin to overcome cardiotoxicity and multidrug resistance. Theranostics 6, 1277–1292 (2016).

    Article 
    CAS 
    PubMed 
    PubMed Central 

    Google Scholar 

  • Lancet, J. E. et al. CPX-351 versus 7+3 cytarabine and daunorubicin chemotherapy in older adults with newly diagnosed high-risk or secondary acute myeloid leukaemia: 5-year results of a randomised, open-label, multicentre, phase 3 trial. Lancet Haematol. 8, e481–e491 (2021).

    Article 
    CAS 
    PubMed 

    Google Scholar 

  • Lancet, J. E. et al. CPX-351 (cytarabine and daunorubicin) liposome for injection versus conventional cytarabine plus daunorubicin in older patients with newly diagnosed secondary acute myeloid leukemia. J. Clin. Oncol. 36, 2684–2692 (2018).

    Article 
    CAS 
    PubMed 
    PubMed Central 

    Google Scholar 

  • Li, Y. et al. Co-delivery of precisely prescribed multi-prodrug combination by an engineered nanocarrier enables efficient individualized cancer chemotherapy. Adv. Mater. 34, e2110490 (2022).

    Article 
    PubMed 

    Google Scholar 

  • Zhang, R. X., Wong, H. L., Xue, H. Y., Eoh, J. Y. & Wu, X. Y. Nanomedicine of synergistic drug combinations for cancer therapy—strategies and perspectives. J. Control. Release 240, 489–503 (2016).

    Article 
    CAS 
    PubMed 
    PubMed Central 

    Google Scholar 

  • Zhou, M. et al. Poly(2-oxazoline)-based functional peptide mimics: eradicating MRSA infections and persisters while alleviating antimicrobial resistance. Angew. Chem. Int. Ed. 59, 6412–6419 (2020).

    Article 
    CAS 

    Google Scholar 

  • Tauhardt, L., Kempe, K., Gottschaldt, M. & Schubert, U. S. Poly(2-oxazoline) functionalized surfaces: from modification to application. Chem. Soc. Rev. 42, 7998–8011 (2013).

    Article 
    CAS 
    PubMed 

    Google Scholar 

  • Lorson, T. et al. Poly(2-oxazoline)s based biomaterials: a comprehensive and critical update. Biomaterials 178, 204–280 (2018).

    Article 
    CAS 
    PubMed 

    Google Scholar 

  • Zhu, Y., Yang, B., Chen, S. & Du, J. Polymer vesicles: mechanism, preparation, application, and responsive behavior. Prog. Polym. Sci. 64, 1–22 (2017).

    Article 
    CAS 

    Google Scholar 

  • Cui, H., Webber, M. J. & Stupp, S. I. Self-assembly of peptide amphiphiles: from molecules to nanostructures to biomaterials. Biopolymers 94, 1–18 (2010).

    Article 
    CAS 
    PubMed 
    PubMed Central 

    Google Scholar 

  • Zhang, Z., Ai, S., Yang, Z. & Li, X. Peptide-based supramolecular hydrogels for local drug delivery. Adv. Drug Deliv. Rev. 174, 482–503 (2021).

    Article 
    CAS 
    PubMed 

    Google Scholar 

  • Walker, L. et al. The viscoelastic properties of the fungal cell wall allow traffic of AmBisome as intact liposome vesicles. mBio 9, e02383-17 (2018).

    Article 
    PubMed 
    PubMed Central 

    Google Scholar 

  • Colombo, R. & Rich, J. R. The therapeutic window of antibody drug conjugates: a dogma in need of revision. Cancer Cell 40, 1255–1263 (2022).

    Article 
    CAS 
    PubMed 

    Google Scholar 

  • Yongvongsoontorn, N. et al. Carrier-enhanced anticancer efficacy of sunitinib-loaded green tea-based micellar nanocomplex beyond tumor-targeted delivery. ACS Nano 13, 7591–7602 (2019).

    Article 
    CAS 
    PubMed 

    Google Scholar 

  • Wang, C. H., Wang, W. T. & Hsiue, G. H. Development of polyion complex micelles for encapsulating and delivering amphotericin B. Biomaterials 30, 3352–3358 (2009).

    Article 
    CAS 
    PubMed 

    Google Scholar 

  • Laconde, G., Amblard, M. & Martinez, J. Synthesis of α-amino acid N-carboxyanhydrides. Org. Lett. 23, 6412–6416 (2021).

    Article 
    CAS 
    PubMed 

    Google Scholar 

  • Dos Reis, T. F., et al. A host defense peptide mimetic, brilacidin, potentiates caspofungin antifungal activity against human pathogenic fungi. Nat. Commun. 14, 2052 (2023).

    Article 
    CAS 
    PubMed 
    PubMed Central 

    Google Scholar 

  • Davis, S. A. et al. Nontoxic antimicrobials that evade drug resistance. Nat. Chem. Biol. 11, 481–487 (2015).

    Article 
    CAS 
    PubMed 
    PubMed Central 

    Google Scholar 

  • Wilcock, B. C., Endo, M. M., Uno, B. E. & Burke, M. D. C2′-OH of amphotericin B plays an important role in binding the primary sterol of human cells but not yeast cells. J. Am. Chem. Soc. 135, 8488–8491 (2013).

    Article 
    CAS 
    PubMed 
    PubMed Central 

    Google Scholar 

  • Liu, Y. -g, et al. NLRP3 inflammasome activation mediates radiation-induced pyroptosis in bone marrow-derived macrophages. Cell Death Dis. 8, e2579 (2017).

    Article 
    CAS 
    PubMed 
    PubMed Central 

    Google Scholar 

  • Wiradharma, N., Tong, Y. W. & Yang, Y. Y. Self-assembled oligopeptide nanostructures for co-delivery of drug and gene with synergistic therapeutic effect. Biomaterials 30, 3100–3109 (2009).

    Article 
    CAS 
    PubMed 

    Google Scholar 

  • Jiang, W. et al. Short guanidinium-functionalized poly(2-oxazoline)s displaying potent therapeutic efficacy on drug-resistant fungal infections. Angew. Chem. Int. Ed. 61, e202200778 (2022).

    Article 
    CAS 

    Google Scholar 

  • Mukherjee, J., Pirofski, L. A., Scharff, M. D. & Casadevall, A. Antibody-mediated protection in mice with lethal intracerebral Cryptococcus neoformans infection. Proc. Natl Acad. Sci. USA 90, 3636–3640 (1993).

    Article 
    CAS 
    PubMed 
    PubMed Central 

    Google Scholar 

  • Jafari, H. S. et al. Effects of antifungal therapy on inflammation, sterilization, and histology in experimental Candida albicans meningitis. Antimicrob. Agents Chemother. 38, 83–89 (1994).

    Article 
    CAS 
    PubMed 
    PubMed Central 

    Google Scholar 

  • Continue Reading

  • Behringer MOTOR FADER MF60T Set of 5 High-Performance 60 mm Motor Faders for MOTÖR Keyboards Series

    Product Details

    • Motorized 60 mm Fader for MOTÖR keyboards series
    • High-endurance up to 300,000 cycle lifetime
    • Premium quality wiper fingers made from phosphor bronze with silver-coating
    • High-quality belt and gear for fast and smooth operation
    • High-precision 10 kΩ linear resistive track

    Product Description

    Set of 5 High-Performance 60 mm Motor Faders for MOTÖR Keyboards Series

    Continue Reading

  • MajesTEC results with teclistamab in relapsed and/or refractory multiple myeloma

    The BCMA × CD3 bispecific T cell engager teclistamab has potent antitumour activity in patients with heavily pretreated relapsed and/or refractory multiple myeloma (RRMM), resulting in EMA and FDA approval in the fourth and fifth lines, respectively. Now, the phase III MajesTEC-3 trial shows that earlier use of teclistamab, combined with the anti-CD38 antibody daratumumab, improves outcomes.

    In MajesTEC-3, 587 patients with RRMM after 1–3 prior lines of therapy  were randomly assigned (1:1) to receive teclistamab–daratumumab versus daratumumab plus dexamethasone and either pomalidomide (DPd) or bortezomib (DVd). Patients with only 1 prior line of treatment were required to have lenalidomide-refractory disease, and prior BCMA-directed therapy or disease refractory to anti-CD38 antibodies was an exclusion criterion. The primary end point was progression-free survival (PFS).

    Continue Reading

  • AI data centres step up as flexible grid assets

    Artificial intelligence (AI) is driving a rapid increase in electricity demand, adding strain to power systems that are already constrained. Large AI data centres, in particular, require fast and reliable grid connections, yet grid planners typically treat them as inflexible, always-on loads. In many regions, this mismatch has led to multi-year delays for new data centre projects, slowing the deployment of AI while grid operators struggle to manage peak demand without costly infrastructure upgrades.

    Writing in Nature Energy, Ayse K. Coskun and colleagues show that data centres do not have to operate in this rigid way. The team demonstrates that AI data centres can function as flexible, grid-aware loads, easing pressure on constrained power systems. Rather than relying on new hardware or on-site batteries, the researchers developed a software-based control system that adjusts computing workloads in real time in response to grid conditions. By accounting for the trade-off between power use and performance, their approach enables certain AI jobs to slow down during periods of grid stress while maintaining service-level agreements (SLAs).

    Continue Reading