Category: 3. Business

  • Therapeutic benefits of maintaining CDK4/6 inhibitors and incorporating CDK2 inhibitors beyond progression in breast cancer

    Therapeutic benefits of maintaining CDK4/6 inhibitors and incorporating CDK2 inhibitors beyond progression in breast cancer

    The combination of CDK4/6i and ET has reshaped treatment for HR+/HER2– breast cancer (Johnston et al., 2019; Finn et al., 2015; Finn et al., 2016; Turner et al., 2018; Dickler et al., 2017; Hortobagyi et al., 2022; Slamon et al., 2020; Im et al., 2019). However, resistance commonly emerges, and no consensus second-line standard is established. Our data show that continued CDK4/6i treatment in drug-resistant cells engages a noncanonical, proteolysis-driven route of Rb inactivation, yielding attenuated E2F output and a pronounced delay in G1 progression (Figure 7G). Concurrent ET further deepens this blockade by suppressing c-Myc-mediated E2F amplification, thereby prolonging G1 and slowing population growth. Importantly, CDK2 inhibition alone was insufficient to control resistant cells. Robust suppression of both CDK2 activity and resistant-cell growth required CDK2i in combination with CDK4/6i, consistent with prior reports supporting dual CDK targeting (Pandey et al., 2020; Freeman-Cook et al., 2021; Dietrich et al., 2024; Al-Qasem et al., 2022; Kudo et al., 2024; Arora et al., 2023; Kumarasamy et al., 2025; Dommer et al., 2025). Moreover, cyclin E blunted the efficacy of the CDK4/6i+CDK2i combination by reactivating CDK2. Together, these findings provide a mechanistic rationale for maintaining CDK4/6i beyond progression and support testing the combination of CDK4/6i and CDK2i, as evidenced by concordant in vitro and in vivo results.

    Our data indicate that maintaining both CDK4/6i and ET synergistically decelerates cell-cycle progression in drug-resistant cells by further delaying CDK2 activation kinetics and the G1/S transition without affecting the S and G2 phases. This dual effect stems from CDK4/6i causing suboptimal Rb inactivation, while ET suppresses the global transcription amplifier c-Myc, collectively leading to diminished E2F transcriptional activity. As a result, this reduced E2F activity lowers the expression of critical cell-cycle genes, such as cyclin E and A, extending the time needed for CDK2 activation. Given that CDK2 plays an essential role in initiating and advancing DNA replication (Tanaka et al., 2007; Krude et al., 1997), its delayed activation significantly prolongs the G1/S transition. Moreover, CDK2 activation also contributes to Rb phosphorylation and inactivation. High CDK2 activity is required to phosphorylate Rb, and CDK2-mediated Rb phosphorylation is tightly coupled with DNA replication timing (Kim et al., 2022; Chung et al., 2019). Thus, upon Rb phosphorylation by CDK2 at the G1/S transition, drug-resistant cells may effectively proceed through the cell cycle even under continued CDK4/6i treatment.

    Clinical trials evaluating the efficacy of sustained CDK4/6i therapy predominantly use PFS as the primary endpoint (Llombart-Cussac et al., 2025; Mayer et al., 2024; Kalinsky et al., 2025; Jhaveri et al., 2025; Kalinsky et al., 2023). However, our findings suggest that drug-resistant tumors continue to proliferate despite CDK4/6i maintenance. Consequently, maintaining CDK4/6i appears to slow tumor growth rather than completely arrest it. This underscores the need for clinical trials to consider overall survival and tumor progression rates as more appropriate endpoints for assessing the true benefits of sustained CDK4/6i therapy. Furthermore, the distinct polypharmacology profiles among CDK4/6i (Hafner et al., 2019), with ribociclib being the most specific and abemaciclib the least, may explain the varying therapeutic outcomes observed among these inhibitors (Kalinsky et al., 2023; Navarro-Yepes et al., 2023).

    Maintaining CDK4/6i treatment beyond progression may be particularly beneficial for about 70% of patients who do not acquire new genetic mutations (O’Leary et al., 2018). However, it is important to recognize that resistance to CDK4/6i often arises from mutations in genes associated with mitogenic or hormone-signaling pathways (O’Leary et al., 2018; Mao et al., 2020; Wander et al., 2020; Formisano et al., 2017; Costa et al., 2020). These include mutations in PIK3CA, ESR1, FGFR1–3, and HER2, which have been linked to increased c-Myc expression (Shang et al., 2000; Zhu et al., 2008; Tsai et al., 2012). Additionally, previous studies have identified FAT1 mutations as a driver of CDK4/6i resistance (Li et al., 2022; Li et al., 2018). These resistance mutations may reduce the efficacy of maintaining CDK4/6i and ET therapy. Moreover, about 4.7% of HR+/HER2 breast cancer patients exhibit Rb mutations (O’Leary et al., 2018; Wander et al., 2020), making CDK4/6i treatment unlikely to be effective, thus making its continuation inadvisable in these cases.

    In conclusion, our study provides mechanistic rationale for maintaining CDK4/6i together with ET after disease progression in HR+/HER2 breast cancers that retain an intact Rb/E2F pathway. The combination of CDK4/6i and CDK2i can further provide durable growth suppression, consistent with prior studies (Pandey et al., 2020; Freeman-Cook et al., 2021; Dietrich et al., 2024; Al-Qasem et al., 2022; Kudo et al., 2024; Arora et al., 2023; Kumarasamy et al., 2025; Dommer et al., 2025). However, it is essential to acknowledge that CDK2/4/6 inhibition may promote whole-genome duplication (Kim et al., 2025a), potentially fueling more aggressive tumor evolution. Finally, we identify cyclin E overexpression as a key driver of resistance to dual CDK4/6i and CDK2i therapy, providing a basis for biomarker-guided patient selection and the development of strategies to overcome therapeutic resistance.

    Continue Reading

  • Access Denied


    Access Denied

    You don’t have permission to access “http://www.spglobal.com/energy/en/news-research/latest-news/metals/122925-indonesia-navigates-nickel-market-with-output-cuts-policy-shifts” on this server.

    Reference #18.c8a0d517.1767010620.2c7dfcb

    https://errors.edgesuite.net/18.c8a0d517.1767010620.2c7dfcb

    Continue Reading

  • Access Denied


    Access Denied

    You don’t have permission to access “http://www.spglobal.com/energy/en/news-research/latest-news/agriculture/122925-interview-indias-broiler-production-continues-to-expand-6-7-annually-says-poultry-india-head” on this server.

    Reference #18.c8a0d517.1767011277.2f28cd3

    https://errors.edgesuite.net/18.c8a0d517.1767011277.2f28cd3

    Continue Reading

  • Virgin Media launches winter sale across broadband and TV packages

    Virgin Media launches winter sale across broadband and TV packages

    • Sale Savings: From 29th December until 4th February, new broadband customers can take advantage of a range of exciting deals in Virgin Media’s winter sale.
    • Award-Winning Reliability: Those switching to Virgin Media, recognised by Uswitch as the UK’s Most Reliable Broadband Provider, can benefit from the company’s market leading WiFi guarantee of 30Mbps in every room or £100 credit*.
    • Netflix Included: All Virgin Media TV bundles now include Netflix Standard at no extra cost.
    • Priority from O2: Customers with Virgin Media broadband can unlock access to a range of exclusive rewards and experiences via the Priority app (with rewards worth £339 on average each year, according to Uswitch).

    From 29th December until midnight on 4th February, new customers looking to boost their connectivity and entertainment line-up can benefit from new offers in Virgin Media’s Winter Sale.

    Those who switch to Virgin Media – recognised by Uswitch as the UK’s ‘Most Reliable Broadband Provider’ (Opensignal Awards – UK: Fixed Broadband Experience Report, Dec 2025), can enjoy ultrafast (500mbps) speeds from £29.99 per month, including Netflix Standard available with all TV bundles at no extra cost – saving £5.99 a month.

    Broadband package What is included Cost per month (18-month contract)
    M250 Broadband: Average download speeds of 264Mbps £23.99 for per month
    M500 Broadband: Average download speeds of 516Mbps £27.99 for per month
    M500 + Netflix Broadband: Average download speeds of 516MbpsTV: Netflix Standard (with Ads) £29.99 for per month
    Gig1 Broadband: Average download speeds of 1,130Mbps £30.99 for per month
    M350 Entertainment + Netflix Broadband: Average download speeds of 362MbpsTV: 200+ TV channels & Netflix Standard (with Ads) £34.99 for per month
    M350 Cinema + Netflix Broadband: Average download speeds of 362MbpsTV: 200+ TV channels including Sky Cinema & Netflix Standard (with Ads) £44.99 for per month
    M350 Sport (HD) + Cinema (HD) + Netflix Broadband: Average download speeds of 362MbpsTV: 200+ TV channels including Sky Sports HD, Sky Cinema HD & Netflix Standard (with Ads) £64.99 for per month
    Gig1 Max Volt: Sports (HD) + Cinema (HD) + Netflix + Unlimited O2 SIM Broadband: Average download speeds of 1,130MbpsTV: 200+ TV channels including Sky Sports HD, Sky Cinema HD & Netflix Standard (with Ads)
    SIM-Only: O2 Travel Inclusive Zone (75 destinations)WiFi Guarantee: Up to 30Mbps in every room of £100 back, usually £8 per month
    £79.99 for per month

    Customers with an O2 mobile account who add Virgin Media broadband to their household services can also enjoy Volt rewards worth up to £692 (according to Choose Broadband). These rewards include:

    • Double mobile data on all eligible O2 mobile Plans in the household i.e. if a customer has 10GB as part of their mobile Plan, they’ll get a boost to 20GB data for no extra cost.
    • A broadband speed boost to the next available tier (up to 1Gbps) e.g. boosted from 100Mpbs to 200Mpbs at no extra cost.
    • The UK’s market-leading WiFi guarantee which offers minimum download speeds of 30Mbps in every room or £100 credit back.

    In addition to Virgin Media’s award-winning broadband, customers also get:

    • Priority from O2: Virgin Media broadband and O2 customers can enjoy access to Priority, which according to price comparison website, Uswitch, offers members a range of rewards worth over £339 each year**. Through Priority, members can enjoy exclusive rewards, unique experiences and daily treats, as well as 48-hour early access to thousands of nationwide gigs and events, through Priority Tickets.
    • Essential Security: Included in all Virgin Media broadband packages at no extra cost, Essential Security is cyber security software designed to block potentially harmful content, provide adjustable parental controls and offer built in protection to help keep users safe a from attempted cyber threats.
    • Refer a friend: Customers who refer a friend can also receive a £50 bonus per recommendation. When the referred friend has had their services installed for 60 days, they will then both be eligible for the reward. will be eligible for a reward providing they’ve not cancelled their new contract within this time.
    • Fast, reliable service: According to Uswitch**, Virgin Media customers can enjoy the highest average download speeds of all internet providers, so whether they’re gaming, working or streaming a new show, the whole household can enjoy a fast and reliable service simultaneously.
    • One Touch Switch: Switching to Virgin Media has never been easier under the industry’s new One Touch Switch process, with customers simply needing to go online or call direct, choose the package they would like and let Virgin Media do the rest – they don’t even have to contact their existing provider about the switch.

    ENDS

    Notes to Editor

    For more info please see: Broadband and TV Deals | Winter Sale | Offer Ends Soon

    *Virgin Media’s market leading WiFi guarantee WiFi Max: What is it and how to get it? | Virgin Media Help

    ** UK Broadband Speed Statistics 2024 – Facts and Stats Report – Uswitch

    Refer a friend: £50 bonus eligible once referred customer has had their services installed for 60 day, and providing they haven’t cancelled their services during that time.

    Continue Reading

  • World shares are mostly lower in quiet holiday trading as China stages war drills near Taiwan

    World shares are mostly lower in quiet holiday trading as China stages war drills near Taiwan

    BANGKOK — Shares in Europe and Asia were mostly lower in thin holiday trading as China staged military exercises near the island of Taiwan.

    The prices of gold and silver fell back after recent gains, while oil prices jumped more than $1. U.S. futures were little changed.

    Shares in Taiwan were higher even after China’s military said it was conducting the drills around the self-governed island that Beijing claims as its territory.

    In early European trading, Germany’s DAX slipped 0.2% to 24,296.81, while the CAC 40 in Paris was nearly unchanged at 8,100.83. Britain’s FTSE 100 likewise barely budged, at 9,874.80.

    The future for the S&P 500 fell 0.2% while that for the Dow Jones Industrial Average was flat.

    China said its combined forces drills were intended to warn against what it called separatist and “external interference” forces. Taiwan placed its military on alert and called the Beijing government “the biggest destroyer of peace.”

    The drills came after Beijing expressed anger at U.S. arms sales to the territory. That followed a comment by Japanese Prime Minister Sanae Takaichi that Japan’s defense forces could get involved if China were to take action against Taiwan. The Chinese statement did not mention the United States and Japan.

    Taiwan’s benchmark Taiex gained 0.9%, but the Hang Seng in Hong Kong gave up early gains, falling 0.7% to 25,635.23. The Shanghai Composite index was virtually unchanged at 3,965.28.

    Tokyo’s Nikkei 225 slipped 0.4% to 50,526.92.

    In South Korea, the Kospi jumped 2.2% to 4,220.56, less than 2 points off its all-time record reached in early November. A 6.8% jump for SK Hynix due to a regulatory change that lifted an investment warning for its stock helped boost the benchmark. Samsung Electronics advanced 2.1%.

    Australia’s S&P/ASX 200 gave up 0.4% to 8,725.70.

    The price of gold fell 1.3% to $4,494 per troy ounce, while silver slipped 2.3% to $75.40. It has jumped to record levels on supply constraints, as both precious metals have been favored by investors seeking safe havens outside of stocks and bonds.

    Earlier surges in gold prices also partly reflected worries during the U.S. government shutdown. Expectations that the U.S. Federal Reserve will cut interest rates further in the new year, weakening the dollar against other currencies, have further fueled buying of gold.

    Silver, which like gold is used in many industries, has been influenced by other factors, too. China, which refines about two-thirds of global supplies, has scrapped an export quota system, replacing it with an export licensing system effective Jan. 1.

    “Scarcity is no longer theoretical,” Stephen Innes of SPI Asset Management said in a report. “China sits at the center of global silver refining, and when the world’s top refiner starts tightening the valve, downstream users feel it immediately.”

    Reopening Friday from the Christmas holiday, the S&P 500 index fell less than 0.1% and the Dow Jones Industrial Average also fell less than 0.1%. The Nasdaq composite fell 0.1%.

    With three trading days left in 2025, the S&P 500 has climbed nearly 18% this year, helped by the deregulatory policies of the Trump administration and investor optimism about the future of artificial intelligence.

    Trading has been light, with institutional investors largely closed out for the year.

    In other dealings early Monday, U.S. benchmark crude oil gained $1.13 to $57.87 per barrel, while Brent crude, the international standard, advanced $1.13 to $61.37 per barrel. On Friday, U.S. crude oil fell 2.8% and Brent crude fell 2.6%.

    The U.S. dollar fell to 156.30 Japanese yen from 156.56 yen. The euro rose to $1.1779 from $1.1770.

    Continue Reading

  • Valens Semiconductor Releases its Environmental, Social and Governance (ESG) 2024 Report

    HOD HASHARON, Israel, Dec. 29, 2025 /PRNewswire/ — Valens Semiconductor (NYSE: VLN), a leader in high-performance connectivity, today released its fourth annual Environmental, Social and Governance (ESG) Report. The 2024 Report details the Company’s progress, commitment, and approach as it looks to advancing a sustainable future.

    Valens Semiconductor’s mission is to develop leading-edge products that enable robust, ultra-high-performance wired connectivity over simple, cost-effective infrastructure for a variety of markets, including professional audio-video, automotive, industrial machine vision, and medical.

    “We are pleased to share Valens Semiconductor’s fourth annual ESG Report, which provides an update on our ongoing commitment to our key ESG initiatives and the progress we achieved in 2024,” said Yoram Salinger, CEO of Valens Semiconductor. “We are dedicated to advancing core ESG principles that guide our operations and support stakeholder expectations. Significant progress has been made in improving energy efficiency, reducing electricity consumption and combined Scope 1 and Scope 2 GHG emissions, and expanding electronic waste recycling efforts”.

    “Our 2024 ESG Report highlights our commitment to ethical and transparent governance while supporting continued business growth. Through active engagement with shareholders, customers, and partners, we communicate our progress and outlook as we advance connectivity solutions while promoting a healthier environment, employee well-being, and community engagement” said Igal Rotem, Chairman of Valens Semiconductor’s Nominating, Governance, and Sustainability Committee.

    The report can be found via the investor relations section of Valens Semiconductor’s website at Valens – ESG-ESG Reports, or by clicking here.

    About Valens Semiconductor

    Valens Semiconductor (NYSE: VLN) is a leader in high-performance connectivity, enabling customers to transform the digital experiences of people worldwide. Valens’ chipsets are integrated into countless devices from leading customers, powering state-of-the-art audio-video installations, next-generation videoconferencing, and enabling the evolution of ADAS and autonomous driving. Pushing the boundaries of connectivity, Valens sets the standard everywhere it operates, and its technology forms the basis for the leading industry standards such as HDBaseT® and MIPI A-PHY. For more information, visit https://www.valens.com/.

    Investor Contacts:

    Michal Ben Ari
    Investor Relations Manager
    Valens Semiconductor Ltd.
    [email protected]

    Miri Segal
    MS-IR IR for Valens Semiconductor Ltd.
    [email protected]

    PDF:  https://mma.prnewswire.com/media/2852276/Valens_Semiconductor.pdf
    Logo: https://mma.prnewswire.com/media/2309625/Valens_Semiconductor_Logo.jpg

    SOURCE Valens Semiconductor

    Continue Reading

  • Circling the drain: Sask. cities face the problem of aging outdoor pools

    Circling the drain: Sask. cities face the problem of aging outdoor pools

    If you want an outdoor public pool in your community, you and your neighbours should demand one.

    That’s the lesson learned from Saskatoon’s history, according to information supplied by the city’s archivist, Jeff O’Brien.

    Three of Saskatoon’s existing outdoors pools were built in response to public campaigns, and pressure from residents helped save two of the pools from closure.

    “I’m glad they’re keeping the pool,” Diane Deptuck told the Saskatoon StarPhoenix in July 2009 as Mayfair Pool turned 50 years old. “There are too many children around here who have nothing to do all day.”

    Deptuck, who had taken her six-year-old grandson to the pool as its shelf life was ending, recalled teaching her daughter to swim in Mayfair Pool. But it was leaking and Deptuck described the state of the change rooms as “horrid” for the last 15 years, specifically decrying the “stench.”

    The pool reopened in 2012 after a $4.8-million refresh. That was the second time it had been slated for closure and then resurrected. In the early 1990s, it was identified as a candidate for closure, but public pressure kept it open — even the “horrid” change rooms.

    Like Saskatoon’s Lathey and George Ward pools, Mayfair was built in direct response to community pressure. A petition with 10,000 names was presented to city council in 1958 and Mayfair Pool opened on July 4, 1959. It cost $166,514, a sliver of the price of its rehabilitation 50 years later.

    Now it’s George Ward’s turn to go through the same debate. The Holliston neighbourhood pool marked 60 years of operation on July 1, but it’s actually the newest in terms of its debut.

    George Ward was built for $225,000 after a petition with 8,000 signatures was presented to council in 1963. That petition included the suggestion the pool be named for Ward, the city’s recreation director.

    Last month, the closure of George Ward was presented to council among 108 options to reduce the property tax increase. Council never even voted on the proposal, which would have saved $152,000 in annual operational costs.

    Likewise, council punted options to reduce the outdoor pool season and the hours the pools are open. A motion to increase the cost of admission was defeated 9-2.

    City manager Jeff Jorgenson acknowledged that some of the proposals to reduce the tax hike were “unpalatable.”

    But a city report says George Ward will need to be replaced in five years, and no funding or plan exists to accomplish that.

    Sixty years ago, when the youngest of the city’s pools first opened, Saskatoon had grown to about 115,000 people. The population has nearly tripled since then, but no new outdoor pools have been built. The city now boasts 67 neighbourhoods, but just four outdoor pools.

    People enjoy Riversdale Pool in Saskatoon, Sask. in an archive photo (1048-0402) taken in 1963. (City of Saskatoon)

    A century of splashes

    Riversdale Pool, which cost $16,283.31 to build originally, marked a century since its debut in July. But it has been almost completely replaced over that period, including adding a waterslide in 1986 for $150,000 and replacement of the basin in 1995 for $1.4 million.

    Lathey Pool closed for four years starting in 1985 after the city decided it needed to be replaced. Saskatoon’s second outdoor pool, the first to be built on the east side of the South Saskatchewan River, cost $155,000 to build and opened in 1955.

    The cost of replacing it was just shy of $1 million.

    Michael Roma, a managing partner with RC Strategies, an Edmonton-based consulting company that focuses on community services, said building an outdoor pool today can cost $20 million or more.

    Combine that with the short season — Saskatoon pools open in June and close by September — and it’s difficult to justify, Roma said in a recent interview.

    “You’re not making money off of any pool, for sure,” he said. “There’s an investment or subsidy that has to go into it.”

    Changing weather patterns and new hazards like heavy smoke from wildfires linked to climate change can further reduce the “social return” from such an investment, which already has limited availability, he said.

    Indoor pools can cost three times as much, but it can be easier to justify the cost because they’re available far more often, Roma said.

    “Even though [outdoor pools are] cheaper [to build,] even though they are popular. Like, you can’t argue with the nostalgia of walking through a neighbourhood and hearing kids splash around in an outdoor pool.”

    Saskatoon has added other, cheaper summer amenities like spray pads, which number 23, and 30 paddling pools.

    Roma stopped short of saying outdoor pools could one day disappear from the Prairies, but he said the availability per capita will continue to shrink.

    “I can’t speak to why there are any outdoor pools in the Prairies, but if you made a case against an outdoor pool, it would probably be stronger in the Prairie provinces than most places in the world.”

    An outdoor pool in summer with a woman sitting on the diving board.
    An archive photo of George Ward Pool (1048-0458) taken when it first opened in 1965 in Saskatoon, Sask. (City of Saskatoon)

    That sinking feeling

    Part of the problem is that population growth does not generally pay for major facilities through development levies, which is why new venues do not appear when a city experiences a major influx of people like Saskatoon, he said. 

    Cities struggle just to pay for maintenance and operation of existing amenities.

    “There’s an affordability train that is going to hit a wall.”

    Roma’s company has crafted strategic plans for recreation facilities for both Saskatoon and Regina. The Regina plan identified two outdoor pools in need of replacing, the same dilemma looming for George Ward in Saskatoon.

    Regina city hall announced in late 2018 a plan to rebuild the then-71-year-old Wascana Pool for $16.5 million and permanently close the 72-year-old Maple Leaf Pool in the city’s Heritage neighbourhood.

    But people showed up at Regina budget talks in 2018 to voice their opposition to closing Maple Leaf Pool. Eventually, it was demolished and rebuilt for $6.2 million in response to passionate residents determined to keep their beloved outdoor amenity.

    Regina still boasts five outdoor public pools compared to just four in Saskatoon, which has more than 50,000 additional residents. Edmonton, with more than three times the population of Saskatoon, only has five outdoor pools.

    Reisha Peters, president of the Holliston Community Association, told Saskatoon Morning last month that she was “a little heartbroken” to hear George Ward Pool might close. She takes her own children there for swimming lessons.

    She said the loss of one of Saskatoon’s pools would place enormous pressure on the other three.

    “Lathey Pool, in particular,” Peters said. “If it’s a hot day, you might be waiting an hour in line just to get in, and especially with little kids, that’s a big ask.”

    An agonizing decision on either closing or spending millions to revitalize George Ward Pool awaits Saskatoon city council in the coming years.

    In Moose Jaw, a plan to replace an outdoor pool of the same vintage as George Ward is estimated to cost about $13 million with no funding plan in place.

    But how pools are built has changed since the original was built, including much better mechanical systems and tunnels around the basin to make repairs easier. Those advances can reduce the cost of maintenance and operations.

    Roma said expectations for an outdoor pool have also grown beyond a rectangular tank, however. People now want waterslides, hot tubs and other amenities.

    “People expect something different now than they would have in the ‘60s.”

    Continue Reading

  • China’s rocket startup LandSpace set to challenge Elon Musk’s SpaceX

    China’s rocket startup LandSpace set to challenge Elon Musk’s SpaceX

    China’s rocket startup LandSpace set to challenge Elon Musk’s SpaceX

    While tech billionaire Elon Musk seems to be reigning supreme in the realm of aerospace technology, China’s rocket startup LandSpace is establishing itself as a competitor against Musk’s SpaceX.

    It is widely believed that the Chinese space tech firm draws inspiration from SpaceX’s innovative approach. It became the first Chinese company to conduct a reusable rocket test earlier this month.

    The contender is challenging the Musk-owned aerospace and space transportation company with remarkable strides reflecting its ambitions.

    Although the Zhuque-3 rocket test ended in failure, LandSpace’s objective to become a leader in reusable rockets is energising China’s space industry, which was mostly dominated by risk-averse state-owned entities.

    Zhuque-3 chief designer Dai Zheng noted that his decision to join LandSpace was influenced by SpaceX’s focus on reusability and rapid iteration.

    LandSpace aims to provide China with a low-cost launch option like SpaceX’s Falcon 9 rocket, which is critical for Beijing’s plans to establish 10,000 satellite constellations in the coming decades.

    LandSpace’s startup culture signifies a huge shift in China’s space programme, which has historically shied away from failures.

    As per reports churned out by China’s state media outlets, failed attempts by both LandSpace and state-owned firms indicate a changing attitude towards risk in the industry.

    As LandSpace is gearing up for another launch after the December failure of Zhuque-3, it seems relieved through SpaceX’s experience.

    How LandSpace’s scenario draws comparison with SpaceX is that SpaceX’s first successful Falcon booster landing came after two unsuccessful attempts, illustrating the value of persistence in the pursuit of innovation.

    To go public and attract investment, LandSpace seems adamant about carving out its niche in the landscape of commercial spaceflight and transforming the future of China’s space endeavours.


    Continue Reading

  • Influx of cheap Chinese imports could drive down UK inflation, economists say | Inflation

    Influx of cheap Chinese imports could drive down UK inflation, economists say | Inflation

    The UK is poised for an influx of cheap Chinese imports that could bring down inflation amid the fallout from Donald Trump’s global trade war, leading economists have said.

    After figures showed China’s trade surplus surpassed $1tn (£750bn) despite Washington’s tariff policies hitting exports to the US, the Bank of England said the UK was among the nations emerging as alternative destinations for the goods.

    Stephen Millard, a deputy director at the National Institute of Economic and Social Research, said: “There is an expectation that given the high tariffs the US are imposing on China, that China will divert its trade elsewhere and one of those places will be the UK.”

    This month Catherine Mann, an external member of the Bank’s rate setting monetary policy committee, told MPs on the Treasury committee there were early signs of trade diversion affecting UK inflation.

    “Import prices have started to moderate on the back of sterling appreciation and some of the spillover of the diversion of Chinese products from the US tariff burdens to other places, including to our docks. Not a lot. Actually less than I would’ve thought. But it’s there.”

    Official figures released by Beijing this month show China’s trade surplus reached more than $1tn in the year to November for the first time, as manufacturers shipped more to non-US markets to sidestep Trump’s tariffs.

    While exports to the US plummeted by 29% year-on-year, sales to markets elsewhere ballooned, including a 15% rise in exports to the EU and 9% jump to the UK compared with the same period a year earlier.

    In its November monetary policy report, the Bank said Chinese exports to the UK and euro area had increased, while those to the US had declined. “Early evidence suggests [tariffs] are having a relatively limited effect on global growth and a slightly disinflationary impact on the UK, driven mainly by trade diversion,” the report said.

    Headline inflation in the UK is running at 3.2% and is forecast to drop close to the 2% target set by the government by the middle of 2026. Measures in Rachel Reeves’s autumn budget – including relief on energy bills and fuel duty – are expected to cut the headline rate by as much as 0.5 percentage points.

    This month the Bank cut its base rate by a quarter-point to 3.75% amid cooling inflationary pressures. Financial markets predict Threadneedle Street will probably reduce borrowing costs by at least another quarter-point in 2026 amid weaker levels of economic growth and rising unemployment.

    China ranks as the UK’s largest market for imports behind Germany, with £70bn shipped to Britain in the year to June, an increase of 4.1% from a year earlier. Cars, telecoms and sound equipment were the main imports.

    Millard said the impact on UK inflation from an increase in Chinese imports was unlikely to be large, but could still add to a slowdown in the headline inflation rate in 2026.

    “There is potential for a fall in the price of Chinese imports as they attempt to sell more into the UK, which could have a reasonable effect on our import price index,” he added.

    Diversion of Chinese exports has rung alarm bells for European manufacturers worried about being undercut by a cheap influx of goods, leading to pressure on EU leaders and the UK government to respond.

    The French president, Emmanuel Macron, said after a visit to Beijing in December that the EU could be forced to take “strong measures” to curb a ballooning imbalance between Chinese imports and exports with the 27-nation bloc.

    In the UK, ministers have pledged to protect domestic steel producers from a mounting glut of the metal on global markets, much of which comes from subsidised Chinese producers.

    However, buyers could benefit from lower prices, with the potential to alleviate concerns over inflationary pressures re-emerging next year.

    Jack Meaning, the UK chief economist at Barclays, said there was limited evidence of trade diversion from China so far, but suggested import prices in the UK were on track to moderate in 2026 amid weaker growth in the world economy.

    “Our forecast is for core goods inflation to decelerate as we move through 2026, from about 1.5% in 2025 to below 1%,” he said. “Part of that story is a more global slowdown; a reorganising of excess demand in the global economy, coming into the UK as a small open economy.”

    Continue Reading

  • The global macroeconomic burden of diabetes mellitus

    The global macroeconomic burden of diabetes mellitus

    This study complies with all relevant ethical regulations. The analyses were conducted using aggregated, publicly available data from international repositories and previously published sources. No individual-level human or animal data were collected, and therefore, ethical approval from an institutional review board or ethics committee was not required.

    Model description

    We estimated the macroeconomic burden of diabetes mellitus for 204 countries. The definition of diabetes mellitus followed the GBD study’s diabetes mellitus category39. Of the 204 studied countries, data from 144 were completed for our projections. We directly calculated the macroeconomic burden of diabetes mellitus for these 144 countries using the health macroeconomic model described in detail in the previous studies15,16,17,18,19,20. In this model, diabetes mellitus affects the economy through three main pathways. First, it reduces effective labor supply through mortality and morbidity. Diabetes mellitus deaths shrink the population, including working-age individuals, while diabetes mellitus morbidity reduces productivity and increases absenteeism. We adjust labor loss using age-specific and sex-specific labor force participation rates, reducing the potential for overestimation. Second, diabetes-related treatment costs reduce aggregate savings and investment by reallocating resources from capital accumulation to healthcare consumption. While reductions in such costs may boost investment, some resources may be redirected to other diseases, slightly overstating the net economic gains. Third, we estimate only the excess informal caregiving time caused by diabetes mellitus, excluding care related to coexisting conditions. This avoids overstating the informal care burden.

    We estimated the additional cost associated with the rise in diabetes mellitus cases and increased mortality among patients with diabetes mellitus attributable to COVID-19. The number of COVID-19 cases was based on daily counts of individuals infected with COVID-19, as estimated by the Institute for Health Metrics and Evaluation40. We analyzed the long-term (2020–2050) impact of infections during the first 3 years of the pandemic—1 January 2020 to 1 September 2022—according to updated COVID-19 infection projections from the Institute for Health Metrics and Evaluation. To do so, we first derived the number of additional cases of diabetes based on the increased risk of incident diabetes in COVID-19 patients; a cohort study of 181,280 participants between 1 March 2020 and 30 September 2021 found an HR of 1.40 (95% CI = 1.36–1.44) for incident diabetes in people who survived the first 30 days of severe acute respiratory syndrome coronavirus 2 (SARS‑CoV‑2) infection relative to those who had not contracted SARS-CoV-2 (ref. 8). Then, we calculated the increased mortality rate among diabetic patients due to the increased risk of death from COVID-19 infection; a cohort study of 6,014 inpatients with diabetes—either COVID-19 positive (n = 698) or negative (n = 5,316)—revealed that diabetic patients hospitalized with COVID-19 were 3.6 times more likely to die than those not infected7. Finally, we estimated the macroeconomic cost associated with the increased mortality and morbidity of diabetes due to COVID-19. The projected long-term burden (2020–2050) reflects the elevated diabetes risk among individuals with prior COVID-19 infection from 2020 to 2022, who had a 40% higher incidence (HR = 1.40, 95% CI = 1.36–1.44) compared to controls.

    Providing informal or unpaid care—which constitutes a substantial proportion of diabetes mellitus care—reduces the formal labor hours of caregivers. We considered the labor impact of informal care related to diabetes mellitus by subtracting the following estimate of effective labor from the labor supply for each diabetes mellitus patient. Specifically, we assumed informal care time as 4.0 h for each diabetes patient for each week, based on the estimation provided in ref. 29, and assumed that full-time employees work an average of 35.9 h per week, as reported by the International Labour Organization41. Consequently, for each patient with diabetes mellitus, the labor supply is reduced by 0.11 (4.0 divided by 35.9) units of labor due to informal caregiving. We also considered the detailed age distribution of informal caregivers to estimate the impact of informal labor loss on the macroeconomic burden. For sensitivity analyses, we revised our estimates of weekly informal caregiving hours. We set the lower bound at 0.285 h per week, calculated by multiplying the lowest reported disability prevalence among diabetic adults (15%42) by the conservative weekly caregiving time (1.9 h per week29) for individuals with mild diabetes. The upper bound remained at 8.3 h per week29, reflecting the higher caregiving needs observed among older populations with more severe diabetes. Formal caregiving is not considered an economic loss, as it involves paid labor and generates economic value. It is treated as part of the overall economy in our accounting framework.

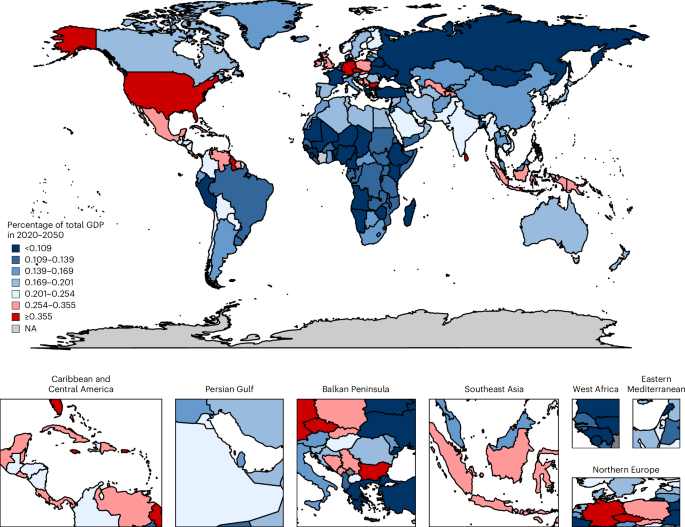
    To quantify the macroeconomic burden of diabetes mellitus, we compared aggregate output (using GDP) across three scenarios over the period 2020–2050: (1) the status quo scenario, in which no interventions are implemented that could reduce the mortality, morbidity, or prevalence of diabetes mellitus relative to current and projected rates; (2) a counterfactual scenario, in which we assumed the complete elimination of diabetes mellitus at zero cost; and (3) a COVID-19 scenario, in which we estimated the increased mortality and morbidity of diabetes mellitus due to COVID-19 between 1 January 2020 and 1 September 2022. The macroeconomic burden of diabetes mellitus was calculated as the cumulative difference in projected GDP between scenarios (1) and (2), which served as the baseline. Furthermore, because COVID-19 increases the incidence of, and mortality from, diabetes mellitus, we calculated the additional macroeconomic burden attributable to COVID-19 as the cumulative difference due to the increased diabetes mellitus cases between scenarios (2) and (3) during this period. We describe our counterfactual assumptions in detail below.

    In the counterfactual scenario, we assume the complete elimination of diabetes mellitus starting in 2020, consistent with the comparative risk assessment framework adopted by the GBD study. In this scenario, all diabetes-related mortality and morbidity are fully averted, while risks from other causes remain unchanged. This approach facilitates consistent cause-specific attribution of economic burden but may overestimate benefits, especially among older adults with substantial competing mortality risks. In translating this health shock into economic outcomes, our health macroeconomic model assumes that eliminating diabetes would increase the effective labor supply by reducing disease-related absenteeism, presenteeism and premature mortality. It would also reduce healthcare expenditures for diabetes treatment, thereby boosting aggregate savings and physical capital accumulation through increased investment. These health-induced changes then generate downstream effects on GDP growth over time. We do not model general equilibrium feedbacks such as changes in wages, labor force participation preferences or government budget reallocation across sectors. Instead, we apply a partial equilibrium framework with fixed labor participation rates and savings behaviors, where changes stem only from shifts in the disease burden. As such, we provide a structured yet conservative estimate of the macroeconomic burden of diabetes mellitus. These estimates are based on a simulation model and should not be interpreted as precise causal effects; rather, they are indicative projections based on clearly defined and transparent assumptions.

    Data

    We considered data for 204 countries and a set of World Bank regions. GDP projections for the status quo scenario, saving rates and health expenditures were taken from the World Bank’s database43,44,45. The mortality and morbidity data (years of life lost due to premature mortality and years lost due to disability) were obtained from the recently updated GBD 2021 (refs. 39,46). We relied on the International Labour Organization for age–sex-specific labor force projections47 and the Barro–Lee education database for age–sex-specific data on average years of schooling48. We obtained the age–sex-specific population from the Department of Economic and Social Affairs population dynamics database49. Using these data sources, we calculated human capital according to the Mincer equation50 and inferred the experience-related human capital component by relying on the corresponding estimates discussed in ref. 51. The physical capital data were taken from the Penn World Table projections52, and we followed standard economic estimates for the value of the output elasticity of physical capital (that is, the percentage change in output for a 1% change in the physical capital stock)53.

    We used data to calculate treatment costs (ref. 38); these data include both inpatient and outpatient medical costs of diabetes mellitus. Supplementary Table 1 shows country-specific treatment data and Supplementary Table 2 shows other parameter values and data sources used in the macroeconomic model. To make country estimates comparable, all costs were converted to 2017 international dollars (2017 INT$). For 60 countries, some data—mostly on education, physical capital and the saving rate—were incomplete (see Supplementary Table 3 for details); reliable data on GDP and the prevalence rate of diabetes mellitus were available for these countries. Similar to the previous research18, we used a linear projection to approximate the economic burden of diabetes mellitus for these countries, which is shown in detail in Supplementary Table 4.

    Modeling details

    The goal was to calculate the economic effect of diabetes mellitus due to healthcare expenses and productivity losses from death, morbidity and informal care. For each country, we performed the following analysis:

    In step 1, we identified the disease burden of diabetes mellitus (in terms of mortality, morbidity and treatment costs).

    In step 2, we constructed economic projections for the following two scenarios: a status quo scenario, in which GDP is projected to grow based on current estimates and projections of disease prevalence, and a counterfactual scenario, in which diabetes mellitus prevalence is eliminated from the beginning of the time frame. The economic projections use a macroeconomic production function and can be further decomposed into the following two parts:

    1. 1.

      Projections of effective labor supply; and

    2. 2.

      Projections of physical capital accumulation.

    In step 3, we calculated the economic loss as the cumulative difference in projected annual GDP between these two scenarios for various discount rates.

    In the counterfactual scenario where diabetes mellitus is eliminated, we assume that diabetes-related morbidity and mortality are fully averted, while the risks of morbidity and mortality from other causes remain unchanged. This assumption follows the GBD comparative risk assessment framework, allowing for consistent estimation across causes. However, it may overestimate the benefits of eliminating diabetes, particularly in older populations, due to unmodeled competing risks. This detailed model description follows our previous contributions, in which we applied the framework to estimate the economic burden of noncommunicable diseases in China, Japan and South Korea15, as well as in the United States and European countries17,54, and the economic burden of noncommunicable diseases and other risk factors18.

    Production function

    Consider an economy in which time (t=mathrm{1,2},ldots ,infty) evolves discretely. Building upon the details in ref. 55, we considered the following production function for this economy:

    $${Y}_{t}={A}_{t}{K}_{t}^{alpha }{H}_{t}^{1-alpha },$$

    where ({Y}_{t}) is aggregate output; ({A}_{t}) is the technological level at time (t), which we assumed evolves exogenously; ({K}_{t}) is the physical capital stock (that is, machines, factory buildings, and so on); and ({H}_{t}) represents aggregate human capital. The parameter (alpha) is the elasticity of final output with respect to physical capital. The aggregate production function recognizes that output is not only produced with physical capital and ‘raw labor’ as in the framework discussed in ref. 56, on which the original EPIC model is based57, but with ‘effective labor’, of which health is a crucial determinant.

    Physical capital evolves according to

    $${K}_{t+1}=left(1-delta right){K}_{t}+{Y}_{t}-{C}_{t}-{rm{TC}}_{t}=left(1-delta right){K}_{t}+{s}_{t}{Y}_{t},$$

    where (delta) refers to the depreciation rate, ({s}_{t}) refers to the saving rate, ({rm{TC}}_{t}) refers to the costs of the ongoing treatment of diabetes mellitus and ({C}_{t}) refers to the amount of consumption. From the above Equation, it follows that the saving rate is defined as

    $${s}_{t}=1-frac{{C}_{t}+{rm{TC}}_{t}}{{Y}_{t}}.$$

    Of note, aggregate output ({Y}_{t}) is used for the following three purposes: (1) to pay treatment costs ({rm{TC}}_{t}) (hospitalization, medication, and so on), (2) to consume the amount ({C}_{t}) and (3) to save.

    Individuals of age group (a) are endowed with ({h}_{t}^{(a)}) units of human capital and supply ({{mathcal{l}}}_{t}^{(a)}) units of labor from the age of 15 up to their retirement at age (R), that is, for (ain [15,R]). Children younger than 15 years of age and retirees older than (R) do not work. R varies by country and could correspond to a high age (for example, some people aged above 80 years could also be working). In the theoretical derivations, R indicates the upper bound of the summation. In our simulations, we used labor projections data from the International Labour Organization, and positive values for the labor force exist for cohorts above the age of 65 years. Aggregate human capital in the production function (1) is then defined as the sum over the age-specific effective labor supply of each age group:

    $${H}_{t}=mathop{sum }limits_{a=15}^{R}{h}_{t}^{left(aright)}{{mathcal{l}}}_{t}^{left(aright)}{n}_{t}^{left(aright)},$$

    where ({n}_{t}^{a}) denotes the number of individuals in age group (a). Of note, aggregate human capital increases with the number of working-age individuals who live in the economy (that is, with a higher ({n}_{t}={sum }_{a=15}^{R}{n}_{t}^{(a)})), with individual human capital endowment (that is, with a higher ({h}_{t}^{(a)}) for at least one (a)), and with labor supply (that is, with a higher ({{mathcal{l}}}_{t}^{(a)}) for at least one (a)).

    We followed ref. 50 and constructed the average human capital of the cohort aged (a) according to an exponential function of education and work experience:

    $${h}_{t}^{left(aright)}=exp left[{eta }_{1}left(y{s}_{t}^{left(aright)}right)+{eta }_{2}left(a-y{s}_{t}^{left(aright)}-5right)+{eta }_{3}{left(a-y{s}_{t}^{left(aright)}-5right)}^{2}right],$$

    where ({eta }_{1}) is the semi-elasticity of human capital with respect to average years of education as given by (y{s}_{t}^{left(aright)}), and ({eta }_{2}) and ({eta }_{3}) are the semi-elasticities of human capital with respect to the experience of the workforce (left(a-y{s}_{t}^{left(aright)}-5right)) and the experience of the workforce squared ({left(a-y{s}_{t}^{left(aright)}-5right)}^{2}), respectively. Here we assumed a school entry age of 5 years throughout.

    Impact of diabetes mellitus on labor supply

    Following refs. 15,17,18, the evolution of labor supply in the status quo scenario is given by

    $${L}_{t}^{left(aright)}={{mathcal{l}}}_{t}^{left(aright)}{n}_{t}^{left(aright)},mathrm{with},{n}_{t}^{left(aright)}=left[1-{sigma }_{t-1}^{left(a-1right)}right]{n}_{t-1}^{left(a-1right)},$$

    where ({sigma }_{t}^{left(aright)}) is the overall mortality rate of age group (a) in time (t). Mortality and morbidity reduce effective labor supply.

    Let ({sigma }_{r,t}^{left(aright)}) denote the mortality rate of people in age group (a) due to diabetes mellitus, and let ({sigma }_{-r,t}^{left(aright)}) be the overall mortality rate due to the causes other than diabetes mellitus. Then we have

    $$left(1-{sigma }_{t}^{left(aright)}right)=(1-{sigma }_{r,t}^{left(aright)})(1-{sigma }_{-r,t}^{left(aright)}).$$

    Mortality from diabetes mellitus reduces the labor supply by reducing the population ({n}_{t}^{left(aright)}) (through ({sigma }_{r,t}^{left(aright)})). In the counterfactual case, in which diabetes mellitus is eliminated from time (t=0) onward, the evolution of labor supply is defined similarly to the evolution of labor supply equation, but with a different overall mortality rate (({sigma }_{-r,t}^{left(aright)}) instead of ({sigma }_{t}^{left(aright)})). For simplicity, we assumed that the number of births is the same in both cases at each point in time (t).

    In the counterfactual scenario, the size of the cohort aged (a) at time (t({bar{n}}_{t}^{(a)})) evolves according to

    $${bar{n}}_{t}^{(a)}=left[1-{sigma }_{-r,t-1}^{left(a-1right)}right]{bar{n}}_{t-1}^{(a-1)},,{bar{n}}_{0}^{(a)}={n}_{0}^{left(aright)},,{bar{n}}_{t}^{(0)}={n}_{t}^{left(0right)},$$

    Following ref. 15, the loss of labor due to mortality accumulates over the years according to

    $${bar{n}}_{t}^{(a)}={n}_{t}^{left(aright)}/mathop{prod }limits_{tau =0}^{min left{t,aright}-1}left[1-{sigma }_{r,t-1-tau }^{left(a-1-tau right)}right].$$

    The morbidity effect is captured by a reduction in the labor participation rate ({{mathcal{l}}}_{t}^{left(aright)}) because people with an illness typically reduce their labor supply, either by reducing their working hours or by leaving the workforce. Following ref. 15, the labor participation rate in the counterfactual scenario ({bar{{mathcal{l}}}}_{t}^{(a)}) can be calculated as

    $${bar{{mathcal{l}}}}_{t}^{(a)}approx {{mathcal{l}}}_{t}^{left(aright)}/mathop{prod }limits_{tau =0}^{min left{t,aright}-1}left[1-{p}^{tau }{sigma }_{r,t-1-tau }^{left(a-1-tau right)}{xi }^{,left(a-1-tau right)}right],$$

    where ({xi }^{,left(aright)}) measures the size of the morbidity effect relative to the relevant mortality rate, and where ({p}^{tau }) is the probability that a patient died from diabetes mellitus before time (t).

    Because the impact of morbidity is hard to estimate directly, we first defined

    $${xi }^{,left(aright)}=frac{mathrm{loss},mathrm{of},mathrm{labor},mathrm{due},mathrm{to},mathrm{morbidity},mathrm{in},mathrm{age},mathrm{group},a}{mathrm{loss},mathrm{of},mathrm{labor},mathrm{due},mathrm{to},mathrm{mortality},mathrm{in},mathrm{age},mathrm{group},a}.$$

    Next, we assumed that the following holds in any given year for each age group (a):

    $${xi }^{,left(aright)}=frac{{mathrm{YLD}}^{left(aright)}}{{mathrm{YLL}}^{left(aright)}},$$

    where ({mathrm{YLD}}^{left(aright)}) represents the years lived with diabetes mellitus and ({mathrm{YLL}}^{left(aright)}) represents the years of life lost due to diabetes mellitus. Of note, ({xi }^{,left(aright)}) can be calculated from the corresponding DALY data reported by the GBD study58.

    In sum, as a result of the elimination of diabetes mellitus, the ‘counterfactual scenario’ is associated with an increase in labor supply as compared with the status quo scenario. We approximated the change in labor supply (at time (t) for age group (a)) by

    $$Delta {L}_{t}^{left(aright)}approx {{mathcal{l}}}_{t}^{left(aright)}{n}_{t}^{left(aright)}mathop{sum }limits_{tau =0}^{min left{t,aright}-1}{sigma }_{r,t-1-tau }^{left(a-1-tau right)}left[1+{p}^{tau }{xi }^{,left(a-1-tau right)}right].$$

    For the more general case of a partial reduction in the prevalence of diabetes mellitus by a factor (rho), we obtained the loss of labor for age group (a) at time (t) as

    $$Delta {L}_{t}^{left(aright)}left(rho right)approx {{mathcal{l}}}_{t}^{left(aright)}{n}_{t}^{left(aright)}mathop{sum }limits_{tau =0}^{min left{t,aright}-1}{rho sigma }_{r,t-1-tau }^{left(a-1-tau right)}left[1+{p}^{tau }{xi }^{,left(a-1-tau right)}right].$$

    The details in ref. 15 showed the mathematical proof.

    For the modeling of informal care labor, we simply subtract the labor loss associated with informal care (defined as a fraction of diabetes mellitus prevalence) from the effective labor supply.

    Impact of diabetes mellitus on physical capital accumulation

    Diabetes mellitus also impedes the accumulation of physical capital because savings finance part of the treatment costs. Following refs. 15,17, physical capital accumulation in the counterfactual scenario can be written as

    $${bar{K}}_{t+1}={bar{s}}_{t}{bar{Y}}_{t}+left(1-delta right){bar{K}}_{t},$$

    $${bar{s}}_{t}{bar{Y}}_{t}={bar{I}}_{t}={bar{Y}}_{t}-{bar{C}}_{t}={{rm{s}}}_{t}{bar{Y}}_{t}+chi{rm{TC}}_{t},$$

    where an overbar indicates the counterfactual scenario and where (chi) is the fraction of the treatment cost that is diverted to savings. The counterfactual saving rate is thus defined by

    $${bar{s}}_{t}=frac{{s}_{t}{bar{Y}}_{t}+chi{rm{TC}}_{t}}{{bar{Y}}_{t}}.$$

    For more details, see refs. 15,17.

    Because diabetes mellitus is assumed to be eliminated in the counterfactual scenario, the resources that were devoted to its treatment can now be used for savings or consumption. Of note, this creates an income effect that, in reality, could affect the division of households’ income between savings and consumption. For tractability, we assumed that aggregate investment consists of two parts in the counterfactual scenario, which are as follows: a fixed share ({{rm{s}}}_{t}) of total output and an additional part from ({rm{TC}}_{t}) that would otherwise have been used to pay to treat diabetes mellitus:

    $${bar{I}}_{t}={{rm{s}}}_{t}{bar{Y}}_{t}+chi{rm{TC}}_{t},$$

    Similarly, for the case of a partial reduction in diabetes mellitus prevalence by (rho), we have

    $${bar{I}}_{t}={{rm{s}}}_{t}{bar{Y}}_{t}+rho chi{rm{TC}}_{t}.$$

    The intuition is that if diabetes mellitus were partially eliminated, the treatment cost that is diverted to savings should be added back proportionally.

    Sensitivity analyses

    We conducted several sensitivity analyses. First, we varied the mortality and morbidity rates. The baseline estimates were calculated with the mean mortality and morbidity data from GBD. In the sensitivity analyses, best-case and worst-case estimates were calculated based on the lower and upper bounds of GBD mortality and morbidity data. Table 1 presents the results of this sensitivity analysis in parentheses next to the baseline estimates. Second, we varied the discount rate. In the main analysis, we generated our estimates using a discount rate of 2%. We present estimates for each country by World Bank region and World Bank income group using discount rates of 0% in Supplementary Table 6 and 3% in Supplementary Table 7. Finally, we conducted sensitivity analyses by varying the weekly informal care hours from 0.285 to 8.3, with 4.0 as the median value (Supplementary Table 8).

    Reporting summary

    Further information on research design is available in the Nature Portfolio Reporting Summary linked to this article.

    Continue Reading