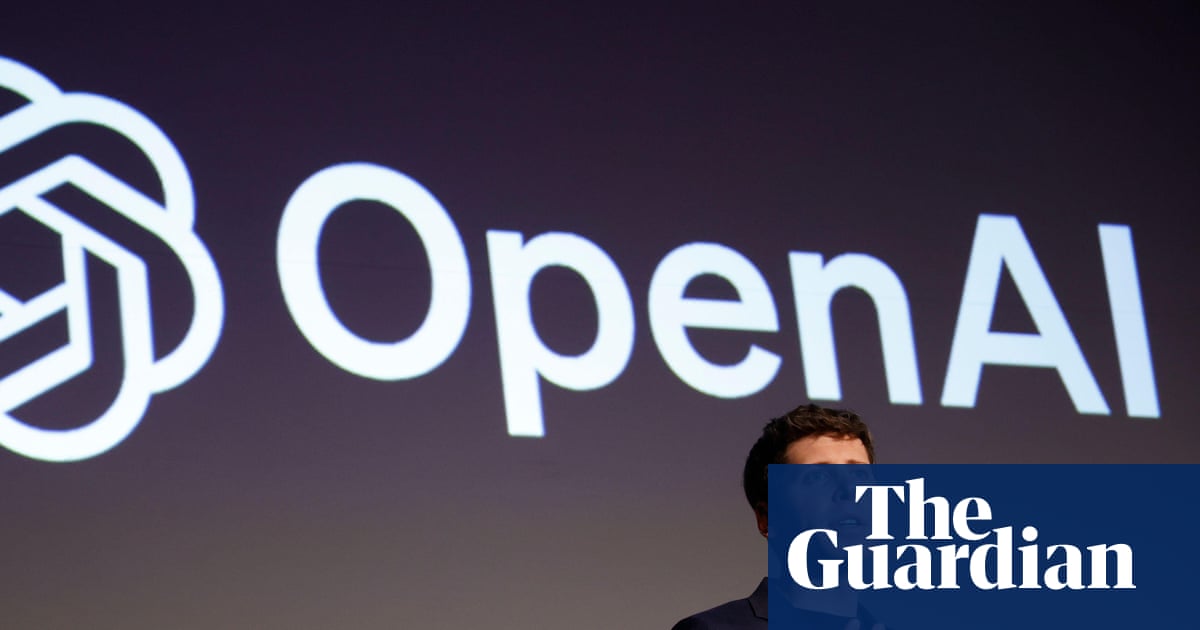
OpenAI announced plans on Tuesday to relax restrictions on its ChatGPT chatbot, including allowing erotic content for verified adult users as part of what the company calls a “treat adult users like adults” principle.
OpenAI’s plan includes the release of an updated version of ChatGPT that will allow users to customize their AI assistant’s personality, including options for more human-like responses, heavy emoji use, or friend-like behavior. The most significant change will come in December, when OpenAI plans to roll out more comprehensive age-gating that would permit erotic content for adults who have verified their ages. OpenAI did not immediately provide details on its age verification methods or additional safeguards planned for adult content.
The company launched a dedicated ChatGPT experience for under-18 users in September, with automatic redirection to age-appropriate content that blocks graphic and sexual material.
It also said it was developing behavior-based age prediction technology that estimates whether a user is over or under 18 based on how they interact with ChatGPT.
In a post on X, Sam Altman, the CEO of OpenAI, said that stricter guardrails on conversational AI to address mental health concerns had made its chatbot “less useful/enjoyable to many users who had no mental health problems”.
The stricter safety controls came after Adam Raine, a California teenager, died by suicide earlier this year, with his parents filing a lawsuit in August claiming ChatGPT provided him with specific advice on how to kill himself. Just two months later, Altman said the company has “been able to mitigate the serious mental health issues”.
The US Federal Trade Commission had also launched an inquiry into several tech companies, including OpenAI, over how AI chatbots potentially negatively affect children and teenagers.
skip past newsletter promotion
after newsletter promotion
“Given the seriousness of the issue we wanted to get this right,” Altman said Tuesday, arguing that OpenAI’s new safety tools now allow the company to ease restrictions while still addressing serious mental health risks.
Your guide to what Trump’s second term means for Washington, business and the world
Glass Lewis said it would stop issuing single voting positions on proxy issues and instead offer multiple perspectives to clients, after facing criticism from Republicans over diversity and environmental criteria.
Starting in 2027, Glass Lewis will offer recommendations based on views that are oriented towards management, governance, activism or sustainability.
“We recognise that a single perspective is no longer sufficient,” Glass Lewis said in a position paper seen by the Financial Times on Tuesday. “Transitioning to a fully client-driven policy model will ultimately put all proxy voting control in the hands of shareholders, empowering them to vote in accordance with their specific beliefs and priorities.”
The firm’s move follows a similar decision by the other major proxy advisory business, Institutional Shareholder Services. Earlier this month, ISS introduced governance research services that do not include voting recommendations and provide customisable data, analysis and recommendations to its clients.
Glass-Lewis said one of the primary drivers of the shift was the “growing divergence” between American and European institutional investors who have taken different approaches to fiduciary duty and sustainability. European clients already rely more on thematic policies rather than benchmark views.
Glass Lewis’s new voting practice comes as proxy advisers have become increasingly scrutinised by public companies and Republican officials over prioritising matters related to environmental, social and governance, and diversity, equity and inclusion. Glass Lewis and ISS are both suing Texas over a state law that limits the guidance that proxy advisers can give to shareholders on corporate governance, diversity and environmental practices.
The proxy adviser’s latest move could blunt some of the criticism that it provides “ideologically driven” recommendations as it moves to give clients more choice to vote in line with their own beliefs and priorities.
Glass Lewis already offers custom voting recommendations to clients but ending its benchmark guidance would push all of its customers under a custom framework.
“They seem to trying to transition clients to develop more specific policy guidelines, which not only takes Glass Lewis out of the line of fire but also makes more money for Glas Lewis,” said Ann Lipton, a law professor at the University of Colorado.
“I think their ultimate goal is transition to the more expensive and profitable business model.”
The unprecedented advancements in information and communications technology (ICT) have significantly transformed the health care landscape, positioning digital tools as indispensable components of modern medical practice. In particular, the proliferation of generative artificial intelligence (AI) in recent years has dramatically improved access to health information. Within this context, the ability of patients to effectively engage with electronic health (eHealth) tools has become a pivotal determinant of health care outcomes. The required capabilities in this domain were initially proposed as eHealth literacy (eHL) by Norman and Skinner in 2006, defining it as “the ability to seek, find, understand, and appraise health information from electronic sources and apply the knowledge gained to addressing or solving a health problem.” [] Subsequent research has consistently demonstrated that higher eHL is associated with superior health management, improved treatment adherence, and reduced health care costs, while insufficient eHL contributes to delayed medical interventions and poorer health outcomes [-].
In China, the surge of digital health initiatives, such as internet hospitals and rural health care digitization, has expanded the accessibility of health care services, with the number of internet users reaching 1.092 billion in 2024, 85% of whom are adults []. For instance, emerging technologies such as indoor navigation systems, AI-driven diagnostic assistance, and generative AI chatbots have shown promise in improving care delivery, reducing costs, and streamlining clinical workflows [-]. However, these advancements also present unique challenges, particularly for inpatients who are often in vulnerable states due to acute or chronic conditions and may lack the skills necessary to navigate complex eHealth environments. Statistics showed that 781 million adults worldwide remain illiterate, highlighting significant barriers many patients face in accessing and using health care technologies []. Furthermore, significant regional disparities in economic development and divide in health care resources across regions create additional barriers for rural and socioeconomically disadvantaged populations, who frequently exhibit lower eHL and limited experience with digital tools []. Without adequate eHL, patients may struggle to access and evaluate health information, undermining their ability to benefit from technological innovations and compromising health care outcomes.
Effective adoption of digital health services in clinical settings hinges on patients’ readiness and ability to use these technologies []. Inpatients often require frequent access to health information to manage their acute or complex medical conditions within a constrained timeframe. Yet, the reliability and quality of online health resources remain uncertain, and the rise of generative AI has introduced additional risks, such as hallucinated or misleading information []. A previous study has shown that patients increasingly rely on the internet for health-related decisions, even more frequently than they consult doctors []. However, they are not fully equipped with the skills to critically evaluate the credibility of digital content or to protect their personal data, with some users judging website authority solely based on superficial design elements []. These gaps in eHL can lead to nonadherence to medical recommendations, strained doctor–patient relationships, compromised treatment outcomes, and diminished overall patient satisfaction. Assessing eHL among inpatients is therefore essential to understanding their medical needs, providing targeted technical support, and empowering patients to actively participate in health care procedures. Such efforts can not only improve patients’ self-management capabilities and quality of life but also optimize the overall efficiency and effectiveness of health care delivery [,].
Despite the growing emphasis on eHL as a crucial competency in the digital health care era, existing assessment tools fail to comprehensively capture the full spectrum of eHL skills required by inpatients under the Web 3.0 era. The foundational “Lily model” of eHL, proposed by Norman and Skinner [], identifies 6 core literacies: traditional literacy, information literacy, media literacy, health literacy, computer literacy, and scientific literacy. These literacies collectively highlight the challenges faced by individuals with limited proficiency in any one area. Importantly, eHL is not static but a dynamic, process-oriented skill that evolves alongside technological advancements and shifts in social, personal, and environmental contexts []. For instance, the progression of the internet from Web 1.0 (read-only) to Web 2.0 (interactive and social) and now Web 3.0 (semantic and machine-driven integration) has reshaped the demands placed on users. Web 1.0 primarily emphasized information retrieval skills, while Web 2.0 demanded interactive and collaborative abilities. Web 3.0, characterized by machine learning and data integration, requires higher-order skills such as managing personal health data, ensuring cybersecurity, and discerning trustworthy digital resources [,]. However, existing eHL assessment tools remain anchored in the Web 1.0 paradigm and fail to address the complex demands of contemporary digital environments. The widely used 8-item eHealth Literacy Scale (eHEALS) by Norman and Skinner [] in 2006 has revealed significant limitations in combining clinical scenarios and reflecting competencies in the Web 3.0 context.
More recent instruments have attempted to expand the scope of eHL measurement, but notable gaps still remain. The electronic health literacy scale (e-HLS), developed by Seçkin et al [] in 2016, primarily focused on behaviors related to information evaluation and trust but neglected foundational skills like resource access and basic technological operation. Likewise, the eHealth Literacy Questionnaire (eHLQ) by Kayser et al [] in 2018 failed to evaluate patients’ ability to assess the credibility and authenticity of health information and lacked integration with real-world clinical settings. Despite the Transactional eHealth Literacy Instrument (TeHLI) pioneering an emphasis on interpersonal skills and the ability to apply knowledge in practice, it overlooked crucial competencies such as data tracking and adaptability to emerging technologies []. While Liu et al [] introduced a tool involving privacy security, data sharing, and ownership, its focus on college students, a digitally adept group with higher baseline literacy and more frequent use of electronic devices, limited its relevance in clinical contexts and its applicability to vulnerable and less experienced populations. Van der Vaart et al [] developed the Digital Health Literacy Instrument (DHLI), which represents a notable advancement in this domain by integrating both self-reported and performance-based measures. Unlike previous instruments, the DHLI uniquely incorporates a set of practical tasks that require respondents to demonstrate digital skills in simulated scenarios, addressing the gap between perceived and actual ability. However, its reliance on computer-based tasks may limit applicability among populations with less computer experience or those who primarily access health information via mobile devices.
Currently, there is no standardized, comprehensive instrument adapted in the new era of AI-integrated digital health care tailored to inpatients. This gap not only limits health care providers’ ability to understand patients’ eHL and facilitate their engagement with eHealth tools but also impedes the integration of innovative solutions into clinical practice. In response to these challenges, this study aimed to develop and validate the Adult Inpatient eHealth Literacy Scale (AIPeHLS), a novel assessment tool grounded in the Lily model and designed to reflect the competencies required in the Web 3.0 health care ecosystem. By addressing this gap, the AIPeHLS holds the potential to empower patients to make informed health decisions, enhance personalized care delivery, and inform the development of future digital health interventions.
Methods
Step 1: Development of the AIPeHLS
Item Pool Generation
The development of the initial item pool was guided by the Lily model, aiming to address the specific needs of inpatients and reflect application scenarios involving modern information technologies. Relevant items from validated scales in existing studies were adapted and refined to ensure consistency, clarity, and relevance to the target population.
A systematic search of both Chinese and English databases was conducted to identify relevant literature published between January 1, 2013 and April 10, 2023. Chinese databases included CNKI, Wanfang, VIP, and SinoMed, while English databases included PubMed, Web of Science, and Embase. Search terms included keywords such as “patients,” “inpatients,” “e-Health literacy,” “digital health literacy,” “scale,” “questionnaire,” “assessment tool,” and “instrument.” Databased-specific strategies were employed, and citation tracing was used to supplement the search. Studies focused on eHL assessment with patients as primary targeted sample were eligible for inclusion. For duplicate studies, the most recent or complete publication was included. Reviews, conference abstracts, editorial, commentaries, study protocols, and articles without available full text were excluded. After removing duplicates, two reviewers independently screened all titles and abstracts for eligibility, followed by a full-text review. Discrepancies were resolved through weekly discussion iteratively with a third researcher. Key study characteristics, including author, year, country/region, study type, population, sample size, instruments, and item details, were extracted for analysis.
Delphi
To refine the item pool and the structure, a Delphi method was used to integrate expertise across multiple fields, ensuring the content validity and robustness of the scale. This iterative process involved 2 rounds of consultation with experts selected based on the following criteria: (1) intermediate or senior technical titles in the health care field, including academic and clinical roles; (2) at least 10 years of professional experience, with strong theoretical knowledge and practical skills; and (3) willingness to participate voluntarily with informed consent and the ability to provide objective and constructive feedback. A total of 18 experts from 12 provincial-level administrative regions in China were invited, representing diverse fields such as hospital information management, smart health, nursing informatics, nursing management, and clinical nursing, to ensure a balanced knowledge structure among the panel [].
The first-round Delphi questionnaire included an introduction to the study, the initial item pool, and basic information of experts. Experts rated the importance of each item using a 5-point Likert scale (from “very important” to “not important at all”). In the second round, experts evaluated both the importance and relevance of each item, which was rated on a 4-point Likert scale (from “very relevant” to “irrelevant”). Experts were also allowed to suggest modifications, deletions, or additions, with justifications provided in comment sections. Questionnaires were distributed via email or WeChat and collected on May 28, 2023, and July 20, 2023, respectively.
Statistical analyses were performed using SPSS 26.0. Items with the average importance score >3.5, full score rate >20%, and coefficient of variance (CV) <0.25 were retained. Experts’ suggestions were systematically addressed, and feedback was incorporated into subsequent rounds until consensus was reached []. The positivity coefficient of experts was assessed by the return rate of questionnaires, with higher return rates reflecting greater engagement []. Expert authority was quantified using the authority coefficient (Cr), calculated as the average of the familiarity coefficient (Cs) and judgment coefficient (Ca): Cr=(Cs+Ca)/2. A Cr ≥0.70 was deemed acceptable []. Specifically, the familiarity coefficient measures how familiar an expert is with the topic being evaluated, typically rated on a scale (eg, from 0.2 to 1.0), with higher values indicating greater familiarity. The judgment coefficient reflects the basis on which the expert makes their judgments, determined by weighting sources such as theoretical analysis, practical experience, literature references, and intuition. Additionally, the concentration level of experts’ advice is reflected by the average importance score and full score rate, while the coordination degree was assessed using the Kendall W coefficient and CV of item importance score [].
Pilot Survey, Item Analysis, and Selection
A pilot survey was conducted in August 2023 to refine the scale based on item analysis and participants’ feedback on any ambiguous or unclear items. A convenience sample of 100 adult inpatients from a Grade A tertiary hospital in Hunan, China, was recruited based on the following criteria []: (1) age 18 years or older; (2) ability to complete the survey independently or with guidance; and (3) informed consent and voluntary participation. Exclusion criteria included the following: (1) mental illness or severe cognitive impairment; (2) acute or critical illness preventing survey completion; and (3) significant visual, auditory, or language impairments.
Item analysis was performed using a combination of statistical methods, including critical value analysis, correlation coefficients, Cronbach α, and exploratory factor analysis (EFA). For critical value analysis, participants were divided into high- and low-scoring groups based on the top and bottom 27% of total scores, and independent samples t tests were performed to compare item scores between these groups. The correlation coefficient method was used to examine the relationships between the total score and each dimension, as well as between each item and its corresponding dimension, using Pearson correlation analyses. Internal consistency reliability was assessed by calculating Cronbach α for the total scale and each dimension. The corrected item-total correlation (CITC) examines the correlation between the score of each item and the full scale minus the contribution of that item to the score. Items with CITCs less than 0.400, and whose removal led to a substantial increase in Cronbach α, were considered to potentially reduce the internal consistency of the dimension. EFA was performed using principal component analysis with eigenvalues >1 and cumulative contribution rate >70% for factor extraction. The Kaiser–Meyer–Olkin (KMO) statistic and Bartlett test of sphericity were used to assess sampling adequacy. KMO values >0.80 were deemed suitable for factor analysis []. Collectively, items were considered for deletion if they met at least 2 of the following criteria []: (1) nonsignificant critical value (P≥.05) in independent sample t test; (2) Pearson correlation coefficient <0.40 between the item and its corresponding dimension; (3) CITC <0.40 with a notable increase in Cronbach α upon item removal; and (4) factor loadings <0.45 in EFA or cross-loadings with differences <0.20.
Step 2: Validation of the AIPeHLS
A cross-sectional study was conducted in September 2023 to validate the scale. A randomized cluster sampling approach was used, with an average of 60 adult inpatients (excluding pediatrics) recruited from each of 9 wards in a Grade A tertiary hospital in Hunan, China, resulting in a total of 532 participants. The scales were distributed in hard copies by the first author (XYF) and two trained researchers (JJ, MYL). Confirmatory factor analysis (CFA) was used to test the alignment of the scale structure with theoretical assumptions. Model fit was evaluated using a range of indices, such as the goodness-of-fit index (GFI), with values closer to 1 indicating better construct validity []. Convergent validity was assessed using average variance extracted (AVE) and composite reliability (CR), with AVE >0.50 and CR >0.70 considered acceptable. Discriminant validity was confirmed if the square root of AVE exceeded interdimension correlation coefficients [].
Content validity was assessed using the content validity index (CVI) derived from Delphi ratings for relevance. Item-level CVI (I-CVI) values ≥0.78 and scale-level CVI (S-CVI) values ≥0.90 were considered acceptable []. The I-CVI was calculated by dividing the number of experts who scored 3 or 4 by the total number of experts, while the S-CVI was determined by averaging the I-CVIs of all the items []. Criterion validity was evaluated by correlating the AIPeHLS with the Chinese version of eHEALS translated by Guo et al, which was validated among 110 high school students with a Cronbach α of .913 []. A higher correlation coefficient indicated stronger criterion validity.
Cronbach α and McDonald omega (ω) coefficients were calculated for the entire scale and its dimensions, with values ≥0.80 indicating good reliability []. Finally, the scale was divided into 2 halves, and the correlation between subscale scores was computed for evaluating split-half reliability, with coefficients ≥0.80 considered good reliability []. A detailed flow diagram for the development and validation process is provided in .
Ethical Considerations
Ethical approval was obtained from the Research Ethics Board of School of Nursing, Central South University, Hunan, China (No. E202373). Informed consent was obtained from all participants enrolled in this study. All patient data were anonymized, with unique IDs assigned to each participant. The data were securely stored in a password-protected database, accessible only to authorized personnel. Patients were informed about data collection and usage and could withdraw at any time without consequences. As a token of appreciation, each participant received a small gift.
Results
Item Pool Generation
A comprehensive review of 934 articles related to eHL was conducted, resulting in the inclusion of 19 studies for item pool development, comprising 8 Chinese and 11 English articles (). An initial pool of 53 items was generated based on this review.
Delphi
To refine the item pool, a 2-round Delphi consultation was carried out with 18 experts from 12 tertiary-level general hospitals, 2 higher education institutions, and 1 national academic organization across 12 provincial-level regions, including Henan, Jilin, Gansu, Shandong, Sichuan, Hunan, Guangdong, Shaanxi, Liaoning, Shanghai, Beijing, and Xinjiang Uygur Autonomous Region. The panel consisted of 14 health care professionals and 4 experts in computer science and engineering. All participants held at least a bachelor’s degree, with approximately 90% holding master’s degrees or higher. Furthermore, nearly 90% of the experts were at vice senior or senior professional levels, and 95% had more than 10 years of working experience, ensuring high expertise and credibility in their feedback ().
The response rates for both rounds of consultation were 100%, demonstrating positive engagement. Expert authority, quantified by the authority coefficient, was 0.864, indicating high reliability of the consultation results. Item importance scores averaged >3.50 across both rounds, with full-score rates exceeding 20% for 90.57% and 100% of items in the first and second rounds, respectively. CVs for 93.22% and 96.08% of items were <0.25 across the 2 rounds, reflecting consensus among experts. The Kendall W coefficients for both rounds were statistically significant (P<.001) with values of 0.249 (χ²=262.340) and 0.146 (χ²=131.317), respectively. Based on expert feedback and statistical evaluation from the first round, we modified 22 items, added 3 new items, removed 11 items, and 8 items were merged appropriately. In the second round, 16 items were modified and 1 item was removed, leading to a finalized pool of 44 items distributed across 6 dimensions for the initial version of APIeHLS ().
Table 1. Demographic characteristics of the experts (n=18).
Variables
N (%)
Gender
Male
4 (22.22)
Female
14 (77.78)
Age (years)
36–45
8 (44.44)
46–60
10 (55.56)
Education level
Doctor
8 (44.44)
Master
8 (44.44)
Bachelor
2 (11.11)
Professional title
Senior
11 (61.11)
Vice-senior
5 (27.78)
Intermediate
2 (11.11)
Work experience
1–10
1 (5.56)
11-20
3 (16.67)
21–30
9 (50.00)
31–40
5 (27.78)
Whether or not a graduate supervisor
No
3 (16.67)
Doctoral supervisor
6 (33.33)
Master supervisor
9 (50.00)
Professional background
Nursing
14 (77.78)
Medical information engineering
1 (5.56)
Computer science and technology
3 (16.67)
Work areas
Nursing management
13 (72.22)
Clinical nursing
9 (50.00)
Nursing informatics
6 (33.33)
Smart health
5 (27.78)
Hospital information management
4 (22.22)
Pilot Survey, Item Analysis, and Selection
In the critical value analysis, independent sample t tests revealed statistically significant differences (P<.001) between the high- and low- scoring groups for all items and confirmed their discriminatory power (). The item-total correlation coefficients for each dimension ranged from 0.843 to 0.943 (traditional literacy), 0.745 to 0.905 (information literacy), 0.895 to 0.936 (media literacy), 0.929 to 0.971 (health literacy), 0.832 to 0.881 (computer literacy), and 0.909 to 0.947 (scientific literacy) (). The correlation coefficients between each dimension and the total score ranged from 0.685 to 0.848, all exceeding the threshold of 0.400 and demonstrating statistical significance (P<.001). The initial scale demonstrated excellent internal consistency, with a total Cronbach α of .959 and subscale values ranging from 0.952 to 0.975. CITCs for all items exceeded 0.400, and the deletion of any item did not significantly improve the Cronbach α, confirming that all items contributed to the overall measurement consistency ().
The KMO value for the initial scale was .921, and the Bartlett test of sphericity yielded a χ² value of 5871.995 (P<.001), confirming the suitability of the data for factor analysis []. Six factors were extracted using the maximum variance method, with eigenvalues of 9.786, 6.668, 6.264, 5.820, 4.252, and 3.562, respectively, accounting for a cumulative variance contribution of 82.616% (). All factor loadings were ≥0.400, and no cross-loading was observed, supporting the clarity and distinctiveness of the dimensions (). The scree plot is illustrated in . The finalized AIPeHLS included 44 items rated on a 5-point Likert scale from 1 (strongly disagree) to 5 (strongly agree) across 6 dimensions.
Table 2. Results of item analysis.
Items
Critical value (t)
Correlation coefficient (r)
CITC
Cronbach α after removement
A1
−14.636
0.932
0.923
0.946
A2
−18.078
0.921
0.881
0.951
A3
−10.850
0.848
0.818
0.957
A4
−12.057
0.843
0.811
0.958
A5
−15.854
0.894
0.874
0.951
A6
−17.298
0.941
0.921
0.946
B7
−8.973
0.824
0.854
0.967
B8
−11.883
0.818
0.853
0.967
B9
−6.407
0.745
0.767
0.969
B10
−8.607
0.781
0.812
0.968
B11
−8.258
0.785
0.808
0.968
B12
−8.892
0.832
0.824
0.968
B13
−6.804
0.774
0.817
0.968
B14
−7.427
0.802
0.855
0.967
B15
−11.125
0.818
0.837
0.968
B16
−7.046
0.819
0.829
0.968
B17
−8.987
0.814
0.842
0.968
B18
−6.709
0.784
0.794
0.969
B19
−10.246
0.905
0.921
0.966
C20
−8.251
0.916
0.897
0.972
C21
−9.884
0.895
0.903
0.971
C22
−6.850
0.904
0.875
0.973
C23
−8.286
0.920
0.920
0.970
C24
−9.067
0.936
0.937
0.969
C25
−9.265
0.918
0.93
0.969
C26
−8.401
0.895
0.892
0.972
D27
−8.439
0.952
0.942
0.972
D28
−8.334
0.971
0.967
0.969
D29
−7.780
0.932
0.923
0.974
D30
−7.796
0.950
0.935
0.972
D31
−7.406
0.908
0.887
0.977
D32
−8.021
0.929
0.899
0.976
E33
−9.244
0.842
0.817
0.959
E34
−8.606
0.870
0.873
0.955
E35
−11.267
0.853
0.871
0.955
E36
−6.631
0.866
0.869
0.955
E37
−6.663
0.844
0.845
0.957
E38
−7.007
0.832
0.824
0.958
E39
−8.683
0.860
0.830
0.957
E40
−11.252
0.881
0.891
0.954
F41
−8.498
0.947
0.913
0.928
F42
−9.156
0.916
0.897
0.933
F43
−7.388
0.909
0.841
0.950
F44
−7.318
0.937
0.883
0.937
aCITC: corrected item-total correlation.
Table 3. Results of exploratory factor analysis.
Factors
Eigenvalue
Extraction sums of squared loadings
Rotation sums of squared loadings
Total
Contribution rate (%)
Cumulative contribution rate (%)
Total
Contribution rate (%)
Cumulative contribution rate (%)
Total
Contribution rate (%)
Cumulative contribution rate (%)
1
24.215
55.034
55.034
24.215
55.034
55.034
9.786
22.240
22.240
2
3.599
8.179
63.213
3.599
8.179
63.213
6.668
15.154
37.394
3
3.166
7.195
70.408
3.166
7.195
70.408
6.264
14.237
51.631
4
2.256
5.126
75.534
2.256
5.126
75.534
5.820
13.228
64.859
5
1.618
3.677
79.211
1.618
3.677
79.211
4.252
9.663
74.522
6
1.498
3.405
82.616
1.498
3.405
82.616
3.562
8.094
82.616
Table 4. Exploratory factor loadings.
Items
Factor loadings
Factor 1
Factor 2
Factor 3
Factor 4
Factor 5
Factor 6
A1
0.343
0.288
0.267
0.202
0.761
0.126
A2
0.342
0.274
0.297
0.185
0.693
0.234
A3
0.268
0.362
0.163
0.212
0.685
0.174
A4
0.300
0.307
0.247
0.208
0.633
0.260
A5
0.344
0.342
0.232
0.233
0.683
0.146
A6
0.318
0.300
0.289
0.213
0.733
0.196
B7
0.746
0.281
0.270
0.206
0.220
−0.024
B8
0.770
0.085
0.213
0.216
0.219
0.219
B9
0.732
0.213
0.262
0.115
0.046
0.060
B10
0.746
0.170
0.280
0.123
0.133
0.142
B11
0.716
0.165
0.278
0.102
0.322
0.046
B12
0.759
0.254
0.249
0.082
0.133
0.142
B13
0.759
0.083
0.236
0.254
0.142
0.107
B14
0.816
0.123
0.178
0.182
0.217
0.025
B15
0.702
0.173
0.196
0.345
0.278
0.138
B16
0.813
0.250
0.056
0.181
0.106
0.087
B17
0.741
0.204
0.194
0.202
0.230
0.192
B18
0.765
0.170
0.144
0.204
0.087
0.107
B19
0.838
0.206
0.158
0.228
0.174
0.191
C20
0.250
0.806
0.214
0.093
0.230
0.190
C21
0.247
0.797
0.188
0.159
0.245
0.214
C22
0.193
0.835
0.230
0.080
0.175
0.100
C23
0.221
0.868
0.150
0.108
0.166
0.176
C24
0.215
0.837
0.251
0.156
0.190
0.202
C25
0.262
0.832
0.190
0.167
0.201
0.199
C26
0.231
0.832
0.180
0.189
0.179
0.115
D27
0.277
0.162
0.206
0.850
0.176
0.147
D28
0.243
0.153
0.195
0.886
0.167
0.152
D29
0.260
0.098
0.220
0.857
0.118
0.170
D30
0.248
0.138
0.213
0.868
0.138
0.146
D31
0.273
0.169
0.230
0.798
0.161
0.154
D32
0.248
0.157
0.273
0.790
0.171
0.236
E33
0.307
0.280
0.708
0.127
0.230
0.109
E34
0.297
0.173
0.733
0.305
0.169
0.218
E35
0.365
0.175
0.700
0.266
0.267
0.174
E36
0.216
0.231
0.812
0.151
0.149
0.167
E37
0.231
0.169
0.790
0.246
0.116
0.147
E38
0.238
0.163
0.752
0.219
0.171
0.153
E39
0.249
0.211
0.768
0.158
0.172
0.140
E40
0.399
0.284
0.697
0.287
0.159
0.162
F41
0.192
0.269
0.195
0.225
0.184
0.824
F42
0.193
0.252
0.276
0.273
0.187
0.778
F43
0.148
0.261
0.258
0.191
0.189
0.768
F44
0.197
0.261
0.192
0.251
0.172
0.800
Figure 1. The scree plot.
Validity and Reliability of the APIeHLS
CFA was conducted to validate the factor structure identified in the EFA. Standardized path models were constructed based on data from 532 participants using AMOS 26.0. Fit indices demonstrated acceptable model fit: χ²=1974.654 (df=887) , GFI=0.854, AGFI=0.837, root mean square error of approximation=0.048, RMR=0.052, comparative fit index=0.957, normed fit index=0.925, and IFI=0.957, which met the criteria of <3.000, >0.900, >0.900, <0.050, <0.050, >0.900, >0.900, and >0.900, respectively. These results confirmed the structural validity of the scale (). Convergent validity was supported by standardized factor loadings >0.700, AVE values ranging from 0.695 to 0.835 (>0.500), and CR values between 0.948 and 0.971 (>0.700) (). Discriminant validity was demonstrated by AVE square roots exceeding interdimensional correlation coefficients, which ranged from 0.354 to 0.466, indicating that each dimension was distinct and unidimensional ().
Figure 2. Structural equation modeling for confirmatory factor analysis.
Table 5. Results of convergent analysis.
Paths
St. estimate
AVE
CR
A. Traditional literacy
0.808
0.962
A6 <— A
0.944
A5 <— A
0.903
A4 <— A
0.871
A3 <— A
0.859
A2 <— A
0.896
A1 <— A
0.917
B. Information literacy
0.718
0.971
B19 <— B
0.904
B18 <— B
0.874
B17 <— B
0.84
B16 <— B
0.838
B15 <— B
0.812
B14 <— B
0.84
B13 <— B
0.836
B12 <— B
0.831
B11 <— B
0.852
B10 <— B
0.859
B9 <— B
0.826
B8 <— B
0.845
B7 <— B
0.854
C. Media literacy
0.756
0.956
C26 <— C
0.923
C25 <— C
0.895
C24 <— C
0.843
C23 <— C
0.852
C22 <— C
0.837
C21 <— C
0.864
C20 <— C
0.867
D. Health literacy
0.819
0.964
D32 <— D
0.928
D31 <— D
0.9
D30 <— D
0.907
D29 <— D
0.898
D28 <— D
0.898
D27 <— D
0.898
E. Computer literacy
0.695
0.948
E40 <— E
0.9
E39 <— E
0.806
E38 <— E
0.824
E37 <— E
0.841
E36 <— E
0.797
E35 <— E
0.817
E34 <— E
0.856
E33 <— E
0.824
F. Scientific literacy
0.835
0.953
F44 <— F
0.946
F43 <— F
0.887
F42 <— F
0.91
F41 <— F
0.911
Table 6. Results of discriminant analysis.
Dimensions
A
B
C
D
E
F
A
0.808
0.426
0.373
0.453
0.385
0.354
B
0.426
0.718
0.421
0.456
0.398
0.380
C
0.373
0.421
0.756
0.459
0.374
0.392
D
0.453
0.456
0.459
0.819
0.466
0.436
E
0.385
0.398
0.374
0.466
0.695
0.452
F
0.354
0.380
0.392
0.436
0.452
0.835
0.899
0.847
0.869
0.905
0.834
0.914
Content validity, assessed using expert-rated relevance scores, showed excellent results with an S-CVI of 0.961 and I-CVIs ranging from 0.889 to 1.000 (). Criterion-related validity was evaluated using Spearman rank correlation coefficients, resulting in a total coefficient of 0.992 (All P<.001), and subscale correlations ranged from 0.607 to 0.785. This revealed a strong correlation between the AIPeHLS and the external criterion, supporting the scale’s applicability and relevance ().
The scale demonstrated strong reliability, with a total Cronbach α coefficient of 0.965. The subscales can be used separately, with Cronbach α coefficients of 0.961 (traditional literacy), 0.971 (information literacy), 0.956 (media literacy), 0.964 (health literacy), 0.948 (computer literacy), and 0.953 (scientific literacy). Also, the omega coefficient for the total scale was 0.962, with subscale values ranging from 0.948 to 0.971, indicating high internal consistency. Split-half reliability, assessed using the Spearman–Brown correlation method, yielded a total reliability coefficient of 0.791, with subscale values consistently above 0.960. The final version of the AIPeHLS is available in .
Table 7. Results of content validity.
Items
Number of experts who rated 3 or 4 (n=18)
I-CVI
A1
18
1.000
A2
18
1.000
A3
18
1.000
A4
18
1.000
A5
18
1.000
A6
18
1.000
B7
18
1.000
B8
18
1.000
B9
17
0.944
B10
17
0.944
B11
17
0.944
B12
17
0.944
B13
18
1.000
B14
18
1.000
B15
18
1.000
B16
18
1.000
B17
18
1.000
B18
17
0.944
B19
16
0.889
C20
17
0.944
C21
17
0.944
C22
17
0.944
C23
16
0.889
C24
18
1.000
C25
18
1.000
C26
16
0.889
D27
18
1.000
D28
18
1.000
D29
18
1.000
D30
18
1.000
D31
18
1.000
D32
17
0.944
E33
16
0.889
E34
17
0.944
E35
16
0.889
E36
16
0.889
E37
18
1.000
E38
17
0.944
E39
17
0.944
E40
16
0.889
F41
18
1.000
F42
16
0.889
F43
18
1.000
F44
17
0.944
Table 8. Results of criterion-related validity analysis.
Dimensions
Correlation coefficients
A. Traditional literacy
0.640
B. Information literacy
0.785
C. Media literacy
0.654
D. Health literacy
0.714
E. Computer literacy
0.658
F. Scientific literacy
0.607
Total
0.992
Discussion
Principal Findings
This study successfully developed and validated the AIPeHLS, a comprehensive and psychometrically robust instrument tailored to measure eHL in adult inpatients. Grounded in the Lily model, the AIPeHL comprises 44 items that reflect the diverse and evolving competencies required to navigate the digital health landscape, spanning from Web 1.0 to Web 3.0. These items take advantages over existing eHL tools [-] by incorporating advanced competencies such as data security, technical problem-solving, and personalization, which are increasingly essential in health care systems that become more digitized and patient-centric. The validation process of AIPeHLS adhered to rigorous psychometric standards to ensure its reliability, validity, and applicability across clinical and research settings. Importantly, the AIPeHLS represents an innovative and forward-looking solution tailored to hospitalized adult inpatients, addressing a critical gap left by previous tools that were either too broad for the general public or targeted at digitally adept younger audiences. This study provides insights for health care providers to better understand how patients make health-related decisions based on their eHealth competencies and develop targeted interventions, while researchers can use the scale to explore opportunities for optimizing user-centered health care solutions.
Step 1: Development of the AIPeHLS
The development of the AIPeHLS was guided by the Lily model, which conceptualizes eHL as comprising 6 interrelated dimensions. This framework informed the item generation, ensuring that the scale captures both foundational and advanced eHL skills relevant to the digital health challenges faced by inpatients. In this study, a comprehensive literature review and expert consultations were conducted to enhance the relevance and inclusivity of the items.
Within the Lily model, traditional (A), information (B), and media literacy (C) are categorized as analytic components that are foundational and applicable across contexts []. For traditional literacy, in addition to a general emphasis on reading and writing (A1, A3) [], we included more real-world scenarios, such as using voice interactions in instant messaging apps (A2) [], articulating health concerns (A5) [], and sharing experiences with peers and caregivers in person or via online health communities (OHCs) (A6) []. These items are necessary to understand patients’ engagement in digital health environments and to identify potential barriers to interaction. Numeracy, a critical component of traditional literacy but often overlooked in previous eHL assessments, was also given particular emphasis in this study (A4) as it is essential for inpatients to interpret medication dosages, understand cost-related information, and manage complex treatment regimens. Information literacy refers to the ability to search for (B7, B8), filter (B16), and evaluate (B10, B11, B12, B13) health-related information proficiently [-]. The AIPeHLS expands this definition to account for emerging concerns unique to the digital age, such as identifying commercial biases in online content (B15) [,], assessing data privacy risks (B17, B19), and managing personal account security (B18). These competencies are increasingly relevant as AI technologies gain prominence in health care, with the percentage of AI-generated information projected to increase from 1% of all human data in 2022 to 10% by 2025 []. Despite breakthroughs in the medical field, unsupervised AI tools can potentially generate hallucinations that impact patient decision-making and even lead to unintended negative consequences, such as biased treatment recommendations and inappropriate mental health advice []. To mitigate these risks, the scale also evaluates patients’ ability to find or verify online information through consultations with health care professionals (B9, B14) [], who remain the most trusted sources for validating the credibility and accuracy of health information. This dual focus on independent information evaluation and professional consultation reflects the evolving interaction patterns between patients and health care providers in the digital era. Media literacy is particularly critical in the social media context, where misinformation can spread rapidly, as seen during the pandemic. In this dimension, the AIPeHLS assesses patients’ ability to critically appraise, question, and correct misinformation encountered online (C20, C21, C22). We also considered behaviors related to ethical content sharing, such as posting illness diaries (C23) [], avoiding spreading unverified content (C24, C25) [] and preventing plagiarism (C26) [], providing insights into patients’ roles as both consumers and disseminators of digital health information.
In contrast, health (D), computer (E), and scientific literacy (F) are categorized as context-specific components that rely on more situation-specific skills []. Specifically, health literacy empowers patients to use eHealth tools to address health-related issues promptly. Therefore, knowledge of medical terminology (D27) [], treatment options (D29), and awareness of changes in health conditions (D28) were considered in this dimension. It also evaluates patients’ ability to leverage eHealth tools for decision-making (D31, D32) [] and self-management (D30) [], aligning with the goals of eHealth interventions. Computer literacy involves the technical skills required to operate digital devices and navigate innovative tools. Research showed that a lack of experience in using technologies could limit patients’ ability to engage with and benefit from digital health services []. The AIPeHLS addresses this gap by assessing familiarity with technological terms (E33), basic operations (E34) [], safety measures (E35), and problem solving (E36). Moreover, this scale assesses the ability to select (E38), use (E37), and adapt to eHealth tools (E40) [] for proactive health promotion, such as tracking medical reports, monitoring lifestyle factors (eg, sleep, exercise, and nutrition), and formulating health plans to achieve specific goals []. Finally, scientific literacy plays a crucial role in enabling patients to comprehend the scientific foundations underlying health recommendations and critically evaluate the credibility of eHealth tools. For individuals without a background in scientific education, interpreting research-based health information presented online can be particularly challenging []. In this study, we assessed whether patients understand that suggestions from eHealth tools are based on time-sensitive research findings (F41, F42) and whether they can recognize the functionalities and limitations of these tools (F43, F44). This focus is novel and significant for selecting eHealth tools rationally and objectively, empowering patients to navigate the complexities of digital health with confidence and competence.
Step 2: Validation of the AIPeHLS
The construct validity of the AIPeHLS was determined through both EFA and CFA. The EFA results demonstrated a clear factor structure, with each item loading strongly onto its respective dimension and minimal cross-loadings. Subsequent CFA confirmed the factorial composition of AIPeHLS, with commonly used fit indices, such as χ², root mean square error of approximation, comparative fit index, normed fit index, and IFI, meeting or exceeding recommended thresholds. Convergent and discriminant validity were confirmed by the AVE, with values above 0.500 and its square root values greater than interdimensional correlation coefficients. The content validity of the APIeHLS was ensured through a rigorous item development process, with expert panels evaluating the importance, relevance, clarity, and representativeness of each item, achieving CVI values exceeding 0.800 across all dimensions. Criterion-related validity was supported by its high correlation with the Chinese version of eHEALS, a widely accepted instrument, although it has some limitations in capturing the most authentic eHL performance among patients. Regarding reliability, the Cronbach α and McDonald omega estimations showed adequate internal consistency reliability for APIeHLS and its dimensions, and the split-half reliability yielded similarly strong coefficients, with values all above 0.700.
The AIPeHLS was found to be a reliable and valid instrument for assessing eHL in adult inpatients. The inclusion of adult inpatients from various specialties during the development and validation process ensures that the tool is grounded in real-world experiences and needs. Its comprehensive framework and strong psychometric properties make it an effective tool for health care providers to understand patients’ digital health competencies and tailor interventions accordingly. For researchers, our findings provided opportunities to explore the relationship between eHL and health outcomes. Notably, this study represents a significant advancement in eHL measurement by involving the latest technology usage behaviors, offering valuable insights into the development of more effective eHealth interventions and policies.
Limitations, Strengths, and Future Directions
It is noted that this study has some limitations to be addressed in future research. First, criterion-related validity was evaluated using the Chinese version of the eHEALS, which is often regarded as the gold standard for measuring eHL; however, its ability to accurately reflect the true level of eHL within the target population was significantly constrained by its overly concise and outdated items. Second, the representativeness of results might be limited due to the study sample selected exclusively from a single clinical institution in China. Third, the absence of test-retest reliability due to the relatively short periods of hospital stays may affect the stability of the instrument over time. Accordingly, multicenter studies across diverse populations and time points are expected to further evaluate the measurement invariance and longitudinal reliability of AIPeHLS. Despite these limitations, this study addressed a critical gap in the literature as no prior measure has specifically focused on eHL assessments among inpatient populations who must navigate increasingly complex eHealth challenges. This work represented an innovative advancement in understanding and measuring eHL, particularly by integrating the evolving Web3.0 context and the rapidly advancing eHealth technologies worldwide. Moving forward, the relationships between eHL, as measured by the AIPeHLS, and a range of potential health-related variables could be systematically explored. Furthermore, this scale can be incorporated into studies evaluating the effectiveness of digital health interventions in inpatient settings, providing valuable insights into the impacts of eHealth tools on the health outcomes, self-management capabilities, and overall well-being of hospitalized individuals.
Conclusions
A psychometrically robust, multidimensional instrument termed the AIPeHLS was developed and validated in this study, comprising 44 items that comprehensively cover all 6 dimensions of the theoretically grounded Lily model of eHL. The AIPeHLS demonstrates a substantial potential to serve as a reliable and valid means of measuring eHL among adult inpatient populations in the evolving Web 3.0 context, empowering health care providers to better understand and improve eHL of inpatients. Furthermore, the deployment of the AIPeHLS may facilitate researchers, engineers, and healthcare providers in evaluating and implementing effective eHealth interventions across diverse clinical settings.
We thank all the patients for their participation in the study. This study was supported by grants from the Youth Fund Project of National Natural Science Foundation of China (Grant No. 72304261).
The datasets analyzed during this study are available from the corresponding author on reasonable request.
Edited by Amaryllis Mavragani, Taiane de Azevedo Cardoso; submitted 10.Apr.2025; peer-reviewed by Efrat Neter, Madalina A Coman; final revised version received 25.Jul.2025; accepted 30.Aug.2025; published 14.Oct.2025.
This is an open-access article distributed under the terms of the Creative Commons Attribution License (https://creativecommons.org/licenses/by/4.0/), which permits unrestricted use, distribution, and reproduction in any medium, provided the original work, first published in the Journal of Medical Internet Research (ISSN 1438-8871), is properly cited. The complete bibliographic information, a link to the original publication on https://www.jmir.org/, as well as this copyright and license information must be included.
“Resilient” is the word of the moment on Wall Street.
JPMorgan Chase, Citigroup and Wells Fargo all reported their quarterly earnings Tuesday, and their CEOs all landed independently on the word “resilient” to describe the U.S. economy and its consumers.
“While there have been some signs of a softening, particularly in job growth, the U.S. economy generally remained resilient,” JPMorgan CEO Jamie Dimon said in a statement. Wells Fargo CEO Charlie Scharf said in a news release, “While some economic uncertainty remains, the U.S. economy has been resilient and the financial health of our clients and customers remains strong.” And Citigroup’s CEO, Jane Fraser, said the global economy has “proved more resilient than many anticipated,” and “America’s economic engine is indeed still humming.”
The numbers back them up, to a point. The most recent quarterly GDP data showed the U.S. economy expanding at a faster pace in the second quarter than had been previously expected.
Still, President Donald Trump’s global trade policies continue to fuel uncertainty as tariffs increasingly weigh on consumers. Trillion-dollar company valuations driven in large part by AI raise questions about how long the markets’ record run can continue. Jobs growth has weakened substantially, too.
U.S. stock indexes ended mostly lower Tuesday, with the Nasdaq falling 0.8% and the S&P 500 ending about flat. The 30-stock Dow closed up 200 points. The mixed session followed a dramatic couple days on Wall Street, during which stocks fell sharply on Friday after Trump threatened 100% tariffs on China — only to recover some of those losses Monday.
“There continues to be a heightened degree of uncertainty stemming from complex geopolitical conditions, tariffs and trade uncertainty, elevated asset prices and the risk of sticky inflation,” JPMorgan’s Dimon said.
The jobs market is rapidly cooling, as well, according to government and private data. Payroll processor ADP’s most recent monthly report showed that private employers shed 32,000 jobs in September.
Theofficial government jobs report for the month has been held up by the government shutdown. Before the shutdown, the August jobs report from the Bureau of Labor Statistics showed that employers added just 22,000 jobs for the month. It also revised data to show there was a net loss of jobs in June.
“It’s pretty easy to imagine a world where the labor market deteriorates from here,” JPMorgan’s financial chief, Jeremy Barnum, said on the bank’s conference call.
“The fact that things are fine now doesn’t mean they’re guaranteed to be great forever,” he added.
Despite the dark clouds on the jobs horizon, Barnum said consumers are still — there’s that word again — “resilient,” noting strong spending and lighter-than-expected delinquency rates.
Scharf said Wells Fargo saw spending on debit and credit cards continuing to increase alongside growth in new auto loans.
“The performance of the consumer is just very, very consistent,” he said on Wells Fargo’s earnings call, adding that he didn’t see “any real pockets of slowing.”
At Citigroup, Fraser noted what she called “pockets of valuation frothiness” in the market, and warned that growth may be “cooling somewhat.”
Still, she said, the U.S. “continues to be a pace setter, driven by consistent consumer spending as well as tech investments in AI and data centers.”
Roula Khalaf, Editor of the FT, selects her favourite stories in this weekly newsletter.
French telecoms operators Orange, Bouygues and Free have made a €17bn offer to buy most of billionaire Patrick Drahi’s Altice France, in what could be a landmark deal to consolidate the country’s market.
The non binding offer, made on Tuesday, would involve the three operators purchasing the bulk of SFR, the flagship telecoms business of Altice France, which is controlled by Drahi.
The deal would involve SFR’s consumer business — which includes mobile and fixed line broadband customers — being carved up between Bouygues, Free and Orange.
Bouygues and Free would divide the SFR unit providing services to companies between them.
Other Altice France assets, including SFR’s fixed line network and mobile phone spectrum, would be mostly split between the three operators.
The proposed offer has an enterprise value of €17bn, Orange, Bouygues and Iliad-owned Free said.
The split of the assets by value within the deal would be about 43 per cent in favour of Bouygues, 30 per cent for Free and 27 per cent for Orange, they added.
The deal — if accepted by Altice France — is expected to face intense regulatory scrutiny because it would reduce the number of mobile network operators in France from four to three and could prompt concerns about whether consumers will be asked to pay more for services.
Altice France did not immediately respond to a request for comment.
Orange, Bouygues and Free said the offer was conditional on the completion of due diligence, in addition to regulatory approval.
Bouygues group chief executive Olivier Roussat said any deal would take at least 18 months to complete, and would likely close in the second half of 2027.
The agreement — if finalised — would put an end to Drahi’s 11 years of ownership of SFR and greatly reduce his role in the French telecoms market.
Any deal became easier after Drahi closed an agreement with creditors earlier this month to reduce Altice France’s debt level from €24bn to €15.5bn.
The offer by Orange, Bouygues and Free does not include Altice France’s controlling stake in XpFibre, a fixed line network that the Financial Times reported last month was the subject of a separate sales process.
Competition authorities in Brussels have been under pressure to permit more mergers of telecoms companies since a report last year about how to improve EU competitiveness by Mario Draghi, the former European Central Bank president.
Draghi’s report recommended allowing consolidation to create stronger businesses that are better placed to invest in network infrastructure.
AUBURN HILLS, Michigan – Stellantis announced today plans to invest $13 billion over the next four years to grow its business in the critical United States market and to increase its domestic manufacturing footprint. The investment is the largest in the Company’s 100-year U.S. history and will support the introduction of five new vehicles across the brand portfolio in key segments; production of the all-new four-cylinder engine; and the addition of more than 5,000 jobs at plants in Illinois, Ohio, Michigan and Indiana.
The new investment will further expand Stellantis’ already significant U.S. footprint, increasing annual finished vehicle production by 50% over current levels. The new product launches will be in addition to a regular cadence of 19 refreshed products across all U.S. assembly plants and updated powertrains planned through 2029.
“This investment in the U.S. – the single largest in the Company’s history – will drive our growth, strengthen our manufacturing footprint and bring more American jobs to the states we call home,” said Antonio Filosa, Stellantis CEO and North America COO. “As we begin our next 100 years, we are putting the customer at the center of our strategy, expanding our vehicle offerings and giving them the freedom to choose the products they want and love.”
“Accelerating growth in the U.S. has been a top priority since my first day. Success in America is not just good for Stellantis in the U.S. — it makes us stronger everywhere,” Filosa said.
Plant Investment Details(1)
The $13 billion investment plan includes research and development and supplier costs to execute the Company’s full product strategy over the next four years as well as investments in its manufacturing operations. The details of the plant-specific investments follow:
Illinois
Stellantis intends to invest more than $600 million to reopen the Belvidere Assembly Plant to expand production of the Jeep® Cherokee and Jeep Compass for the U.S. market. With an initial production launch expected in 2027, these actions are anticipated to create around 3,300 new jobs.
Ohio
With an investment of nearly $400 million, assembly of an all-new midsize truck, previously allocated to the Belvidere plant, plans to move to the Toledo Assembly Complex, where it will join the Jeep Wrangler and Jeep Gladiator. The production shift could create more than 900 jobs. Launch timing is expected in 2028.
The Company also intends to continue with investments in its Toledo operations as previously announced in January. This includes additional technologies and strong product actions for both the Jeep Wrangler and Jeep Gladiator, and more components critical to production at the Toledo Machining Plant.
Michigan
Stellantis plans to develop an all-new range-extended EV and internal combustion engine large SUV that will be produced at the Warren Truck Assembly Plant beginning in 2028. The Company will invest nearly $100 million to retool the facility. It is anticipated that the new program will add more than 900 jobs at the plant, which currently assembles the Jeep Wagoneer and Grand Wagoneer.
The Company also expects to invest $130 million to prepare the Detroit Assembly Complex– Jefferson for production of the next-generation Dodge Durango, reaffirming its commitment from January. Production is anticipated to launch in 2029.
Indiana
The Company confirms its January announcement to make additional investments in several of its Kokomo facilities to produce the all-new four-cylinder engine – the GMET4 EVO – beginning in 2026. The Company plans to invest more than $100 million and to add more than 100 jobs to ensure that the U.S. will be the manufacturing home of this strategic powertrain.
Stellantis’ U.S. footprint includes 34 manufacturing facilities, parts distribution centers and research and development locations across 14 states. These operations support more than 48,000 employees, 2,600 dealers and nearly 2,300 suppliers in thousands of communities across the country. Today’s announcement builds on the previously announced actions in January 2025.
NOTES
About Stellantis
Stellantis N.V. (NYSE: STLA / Euronext Milan: STLAM / Euronext Paris: STLAP) is a leading global automaker, dedicated to giving its customers the freedom to choose the way they move, embracing the latest technologies and creating value for all its stakeholders. Its unique portfolio of iconic and innovative brands includes Abarth, Alfa Romeo, Chrysler, Citroën, Dodge, DS Automobiles, FIAT, Jeep®, Lancia, Maserati, Opel, Peugeot, Ram, Vauxhall, Free2move and Leasys. For more information, visit www.stellantis.com.
Stellantis Forward-Looking Statements
This communication contains forward-looking statements. In particular, statements regarding future events and anticipated results of operations, business strategies, the anticipated benefits of the proposed transaction, future financial and operating results, the anticipated closing date for the proposed transaction and other anticipated aspects of our operations or operating results are forward-looking statements. These statements may include terms such as “may”, “will”, “expect”, “could”, “should”, “intend”, “estimate”, “anticipate”, “believe”, “remain”, “on track”, “design”, “target”, “objective”, “goal”, “forecast”, “projection”, “outlook”, “prospects”, “plan”, or similar terms. Forward-looking statements are not guarantees of future performance. Rather, they are based on Stellantis’ current state of knowledge, future expectations and projections about future events and are by their nature, subject to inherent risks and uncertainties. They relate to events and depend on circumstances that may or may not occur or exist in the future and, as such, undue reliance should not be placed on them.
Actual results may differ materially from those expressed in forward-looking statements as a result of a variety of factors, including: the ability of Stellantis to launch new products successfully and to maintain vehicle shipment volumes; changes in the global financial markets, general economic environment and changes in demand for automotive products, which is subject to cyclicality; Stellantis’ ability to successfully manage the industry-wide transition from internal combustion engines to full electrification; Stellantis’ ability to offer innovative, attractive products and to develop, manufacture and sell vehicles with advanced features including enhanced electrification, connectivity and autonomous-driving characteristics; Stellantis’ ability to produce or procure electric batteries with competitive performance, cost and at required volumes; Stellantis’ ability to successfully launch new businesses and integrate acquisitions; a significant malfunction, disruption or security breach compromising information technology systems or the electronic control systems contained in Stellantis’ vehicles; exchange rate fluctuations, interest rate changes, credit risk and other market risks; increases in costs, disruptions of supply or shortages of raw materials, parts, components and systems used in Stellantis’ vehicles; changes in local economic and political conditions; changes in trade policy, the imposition of global and regional tariffs or tariffs targeted to the automotive industry, the enactment of tax reforms or other changes in tax laws and regulations; the level of governmental economic incentives available to support the adoption of battery electric vehicles; the impact of increasingly stringent regulations regarding fuel efficiency requirements and reduced greenhouse gas and tailpipe emissions; various types of claims, lawsuits, governmental investigations and other contingencies, including product liability and warranty claims and environmental claims, investigations and lawsuits; material operating expenditures in relation to compliance with environmental, health and safety regulations; the level of competition in the automotive industry, which may increase due to consolidation and new entrants; Stellantis’ ability to attract and retain experienced management and employees; exposure to shortfalls in the funding of Stellantis’ defined benefit pension plans; Stellantis’ ability to provide or arrange for access to adequate financing for dealers and retail customers and associated risks related to the operations of financial services companies; Stellantis’ ability to access funding to execute its business plan; Stellantis’ ability to realize anticipated benefits from joint venture arrangements; disruptions arising from political, social and economic instability; risks associated with Stellantis’ relationships with employees, dealers and suppliers; Stellantis’ ability to maintain effective internal controls over financial reporting; developments in labor and industrial relations and developments in applicable labor laws; earthquakes or other disasters; risks and other items described in Stellantis’ Annual Report on Form 20-F for the year ended December 31, 2024 and Current Reports on Form 6-K and amendments thereto filed with the SEC; and other risks and uncertainties.
Any forward-looking statements contained in this communication speak only as of the date of this document and Stellantis disclaims any obligation to update or revise publicly forward-looking statements. Further information concerning Stellantis and its businesses, including factors that could materially affect Stellantis’ financial results, is included in Stellantis’ reports and filings with the U.S. Securities and Exchange Commission and AFM.
Move will help Walmart stand out as retailers try to win over cautious consumers, one analyst says
A new partnership will let consumers buy items sold at Walmart through OpenAI’s ChatGPT and Instant Checkout.
Walmart Inc. was the Dow Jones Industrial Average’s top percentage gainer on Tuesday and closed at a record high, after the big-box chain announced a partnership that will soon allow customers to buy items at the retailer through OpenAI’s artificial-intelligence chatbot ChatGPT.
Shares of Walmart (WMT) finished 4.9% higher on Tuesday.
The partnership between Walmart and OpenAI will let customers and members buy items sold at Walmart through ChatGPT and Instant Checkout, a shopping tool OpenAI introduced late last month.
“For many years now, e-commerce shopping experiences have consisted of a search bar and a long list of item responses,” Walmart Chief Executive Doug McMillon said in a statement. “That is about to change. There is a native AI experience coming that is multimedia, personalized and contextual.”
Walmart made the announcement as shoppers continue to struggle with higher prices – and increasingly turn to mass retailers for relief – and as retailers navigate the U.S.-led trade war. Meanwhile, concerns have grown about the astronomical costs to develop AI, as well as consumers’ willingness to pay for it.
Walmart already uses AI in things like customer service and clothing design. UBS analyst Michael Lasser, in a note on Tuesday, said Walmart’s announcement underscored the retailer’s ability to keep pace with trends in technology and shopping.
“Thus, this should provide incrementality and differentiation vs. the rest of retail,” he said.
D.A. Davidson’s Michael Baker, in a note on Tuesday, was also upbeat about the move.
“This supports our view that Walmart will be a winner among traditional retailers in the agentic commerce race,” he said, referring to the digital AI “agents” designed to help humans with tasks.
When OpenAI announced Instant Checkout last month, it said U.S. ChatGPT users would be able to make in-chat purchases from domestic Etsy Inc. (ETSY) merchants, with products from sellers on Shopify Inc. (SHOP) to be made available later. At the time, it said shoppers could make single-item purchases on Instant Checkout, with multi-item purchases set to follow.
Shares of Walmart are up 18.7% so far this year.
-Bill Peters
This content was created by MarketWatch, which is operated by Dow Jones & Co. MarketWatch is published independently from Dow Jones Newswires and The Wall Street Journal.
TORONTO, October 14, 2025 – Thomson Reuters (Nasdaq/TSX: TRI), a global content and technology company, today announced a new wave of AI-powered innovations that extend the momentum of CoCounsel Legal. The latest enhancements are headlined by the beta launch of Deep Research on Practical Law expanding the organization’s agentic capabilities and deeper integration with trusted Thomson Reuters content.
In addition, deep product integration between CoCounsel and HighQ has launched, and regional expansion of CoCounsel in French, German and Japanese will be available to customers in October.
Deep Research on Practical Law
Deep Research on Practical Law, currently in beta with select customers, is a significant advancement toward the comprehensive, trusted, and seamless CoCounsel Legal research solution of the future. Deep Research on Practical Law plans the research steps, retrieves the most relevant guidance and templates from Practical Law, and presents clear, supported conclusions. It adapts as follow-up questions are asked, enabling deeper, more nuanced analysis.
This streamlined approach saves time, reduces friction, and builds confidence in the resulting work product. As the leading resource for legal know-how content, Deep Research in Practical Law complements Westlaw’s primary-law expertise and supports the evolving needs of legal professionals. Deep Research on Practical Law will be available in the U.S. in the first half of 2026. CoCounsel Deep Research on both Westlaw and Practical Law will be available in the UK in the same timeframe.
“In this dynamic legal environment, continuous innovation is a necessity, and Thomson Reuters is investing more than $200 million a year organically in AI to develop cutting-edge solutions for our customers,” said Raghu Ramanathan, president, Legal Professionals, Thomson Reuters. “Innovative advancements like Deep Research in Practical Law and key CoCounsel integrations empower legal professionals with professional-grade AI to not only navigate this transformative era, but to thrive in it.”
CoCounsel HighQ Integration
CoCounsel’s generative AI capabilities are now integrated into Thomson Reuters HighQ. With more than 1 million users, HighQ is a secure, collaboration and workflow automation platform trusted by law firms, corporations, government agencies and their clients to work seamlessly on legal services. Through CoCounsel’s advanced AI capabilities, HighQ brings generative AI directly into the collaborative workflow between enterprises, allowing legal teams to provide differentiated, AI-powered services that enhance client experiences, improve operational efficiency and create a competitive advantage.
HighQ Document Insights powered by CoCounsel’s document review and summarize capabilities allows HighQ users to understand documents faster, gain critical insights, and pinpoint and extract information at the point of need.
Users can seamlessly access CoCounsel Drafting to review a document, edit, redline it against a playbook and more. This additional integration allows users to leverage their documents in HighQ and eliminate versioning risks and manual uploads, saving significant time on drafting and review tasks.
Self-Service Q&A delivers a new AI-powered chat experience within modernized HighQ dashboards that allows users to ask natural language questions to curated document sets and receive summarized, highly relevant answers in minutes, transforming static repositories into dynamic knowledge hubs.
Global Expansion
CoCounsel is expanding its footprint internationally adding new languages including French, German, Spanish, Portuguese and Japanese. The professional-grade legal AI assistant will be available in France, Benelux/Brussels, Luxembourg and Quebec (French), Germany, Austria and Switzerland (German), Brazil (Portuguese), Argentina (Spanish), and Japan (Japanese) to meet the needs of legal professionals in those regions. CoCounsel is also available in the U.S., UK, Canada, New Zealand, Hong Kong, Southeast Asia and United Arab Emirates.
Additional functionality has been released across multiple legal solutions and is highlighted via the CoCounsel Monthly Insider for October on the Thomson Reuters Innovation Blog.
In the UK, Thomson Reuters will showcase these innovations to customers at Legal Geek in London from Oct. 15-16. According to Thomson Reuters Future of Professionals research, UK legal professionals predict that AI will enable lawyers to save 3 hours per week which translates to an average of over £12,000 in annual value per lawyer based on our comprehensive study. This leads to over £2billion in estimated annual impact across the UK legal industry.
Thomson Reuters customers will get a preview at the Association of Corporate Counsel Annual Meeting from Oct. 19-22, 2025, as well as Corporates and Legal Professionals Synergy 2025 Conference held in Orlando, Fla. from Nov. 9-12, 2025.
Thomson Reuters
Thomson Reuters (Nasdaq/TSX: TRI) informs the way forward by bringing together the trusted content and technology that people and organizations need to make the right decisions. The company serves professionals across legal, tax, accounting, compliance, government, and media. Its products combine highly specialized software and insights to empower professionals with the data, intelligence, and solutions needed to make informed decisions, and to help institutions in their pursuit of justice, truth, and transparency. Reuters, part of Thomson Reuters, is a world leading provider of trusted journalism and news. For more information, visit tr.com.
The revival of the U.S.-China trade war has ended a streak of summer calm that had brought about the lowest volatility since January 2020
The stock market’s “fear gauge” is back above its long-term average.
After one of the quietest summers for the stock market in years, Wall Street’s fear gauge has once again shot higher as investors fret that a trade standoff between the U.S. and China could escalate further.
The Cboe Volatility Index VIX, better known as the VIX, or Wall Street’s “fear gauge,” traded as high as 22.76 on Tuesday, its highest intraday level since May 23, when it traded as high as 25.53, according to Dow Jones Market Data. By the time the market closed, the VIX had moved well off its earlier highs. The index ended the day above 20, a level with some significance.
Since the VIX’s inception in the early 1990s, its long-term average sits just below 20. As a result, investors tend to see this level as the line in the sand between a relatively calm market, and one that is starting to look a bit more panicked.
The level of the VIX is based on trading activity in options contracts tied to the S&P 500 SPX that are due to expire in roughly one month. It is seen as a proxy for how worried traders are about the possibility that stocks could be due for a nosedive. After all, volatility tends to rise more quickly when the market is falling.
A summer lull
Looking back, there were signs that investors were beginning to feel a bit too complacent.
Stocks trundled higher all summer with few interruptions. This placid trading ultimately sent the three-month realized volatility for the S&P 500 to its lowest level since January 2020 last week, according to FactSet data and MarketWatch calculations.
Realized volatility is a calculation that measures how volatile a given index or asset has been in the recent past. The VIX, which measures implied volatility, attempts to gauge how volatile investors expect markets will be in the immediate future.
For a while, the VIX trended lower alongside realized volatility for the S&P 500. But around Labor Day, the two started to diverge.
This could mean a couple of different things, according to portfolio managers who spoke with MarketWatch. The first is that investors increasingly preferred to bet on further upside in the stock market using call options instead of actual shares. Call options on the S&P 500 will deliver a payoff if the index rises above a predetermined level before a given time, which is known as the expiration date.
It might also mean that some traders were scooping up put options, which act like a form of portfolio insurance. Wary of myriad risks that could upset the apple cart following a record-setting rebound earlier in the year, some investors may have preferred to hedge their downside risk, while holding on to their stocks, so as not to miss out on any further gains.
Signs that the market might be bracing for some upcoming turbulence first started to emerge in late September. Between Sept. 29 and Oct. 3, the S&P 500 and the VIX rose simultaneously for five straight sessions. That hadn’t happened since at least 1996, according to an analysis from Carson Group’s Ryan Detrick.
Seeing both the VIX and S&P 500 trend higher hinted that the market’s streak of calm might soon be coming to an end, said Michael Kramer, portfolio manager at Mott Capital Management.
“The tinder was there for something like Friday to occur,” said Mike Thompson, co-portfolio manager at Little Harbor Advisors.
“You just needed that spark to trigger it,” Mott Capital’s Kramer said.
While the U.S.-China trade tensions remain far from settled, Thompson and his brother, Matt Thompson, also a co-portfolio manager at Little Harbor Advisors, are keeping an eye out for any indication that a bigger burst of volatility might lie ahead.
Investors have largely blamed the selloff for the revival of trade tensions between the U.S. and China. On Friday, President Donald Trump threatened 100% tariffs on all Chinese goods imported into the U.S. in retaliation for Beijing stepping up export controls on rare earth metals.
Then on Tuesday, Beijing sanctioned U.S. subsidiaries of a South Korean shipping firm, sparking a global stock-market selloff that had largely reversed by the time the closing bell rang out on Wall Street.
But according to the Thompson brothers, the U.S.-China tariff dance has started to feel a little too familiar for it to be a real cause for concern. Investors appear to be catching on to the pattern of escalation, followed immediately by de-escalation, as each side vies for maximum leverage.
A more plausible threat to market calm, in their view, would be the ructions in the credit market. On Tuesday, JPMorgan Chase & Co. (JPM) Chief Executive Jamie Dimon warned about the potential for more credit problems after the bank lost money on a loan to bankrupt subprime auto lender Tricolor. Trouble in the space could get worse after a long period where conditions in the credit market were relatively favorable.
On Friday, BlackRock (BLK) and other institutional investors asked for their money back from Point Bonita Capital, a fund managed by the investment bank Jefferies (JEF), after the bankruptcy of auto parts supplier First Brands Group saddled the fund with big losses.
“We’re keeping an eye out for whether there is another shoe to drop,” Matt Thompson said.
U.S. stocks were on track to finish mostly higher on Tuesday, until Trump dropped a Truth Social post accusing China of a “Economically Hostile Act” for refusing to purchase soybeans from American farmers. That caused the S&P 500 to finish 0.2% lower, while the Nasdaq Composite COMP ended down 0.8%. Of the three major U.S. indexes, only the Dow Jones Industrial Average DJIA managed to finish higher. Meanwhile, the Russell 2000 RUT, an index of small-cap stocks, quietly notched another record closing high.
-Joseph Adinolfi
This content was created by MarketWatch, which is operated by Dow Jones & Co. MarketWatch is published independently from Dow Jones Newswires and The Wall Street Journal.
We’re presenting Design for Sustainability, a set of technical design principles for new designs of IT hardware to reduce emissions and cost through reuse, extending useful life, and optimizing design.
At Meta, we’ve been able to significantly reduce the carbon footprint of our data centers by integrating several design strategies such as modularity, reuse, retrofitting, dematerialization, using greener materials, and extended hardware lifecycles, Meta can significantly reduce the carbon footprint of its data center infrastructure.
We’re inviting the wider industry to also adopt the strategies outlined here to help reach sustainability goals.
The data centers, server hardware, and global network infrastructure that underpin Meta’s operations are a critical focus to address the environmental impact of our operations. As we develop and deploy the compute capacity and storage racks used in data centers, we are focused on our goal to reach net zero emissions across our value chain in 2030. To do this, we prioritize interventions to reduce emissions associated with this hardware, including collaborating with hardware suppliers to reduce upstream emissions.
What Is Design for Sustainability?
Design for Sustainability is a set of guidelines, developed and proposed by Meta, to aid hardware designers in reducing the environmental impact of IT racks. This considers various factors such as energy efficiency and the selection, reduction, circularity, and end-of-life disposal of materials used in hardware. Sustainable hardware design requires collaboration between hardware designers, engineers, and sustainability experts to create hardware that meets performance requirements while limiting environmental impact.
In this guide, we specifically focus on the design of racks that power our data centers and offer alternatives for various components (e.g., mechanicals, cooling, compute, storage and cabling) that can help rack designers make sustainable choices early in the product’s lifecycle.
Our Focus on Scope 3 Emissions
To reach our net zero goal, we are primarily focused on reducing our Scope 3 (or value chain) emissions from physical sources like data center construction and our IT hardware (compute, storage and cooling equipment) and network fiber infrastructure.
While the energy efficiency of the hardware itself deployed in our data centers helps reduce energy consumption, we have to also consider IT hardware emissions associated with the manufacturing and delivery of equipment to Meta, as well as the end-of-life disposal, recycling, or resale of this hardware.
Our methods for controlling and reducing Scope 3 emissions generally involve optimizing material selection, choosing and developing lower carbon alternatives in design, and helping to reduce the upstream emissions of our suppliers.
For internal teams focused on hardware, this involves:
Optimizing hardware design for the lowest possible emissions, extending the useful life of materials as much as possible with each system design, or using lower carbon materials.
Being more efficient by extending the useful life of IT racks to potentially skip new generations of equipment.
Harvesting server components that are no longer available to be used as spares. When racks reach their end-of-life, some of the components still have service life left in them and can be harvested and reused in a variety of ways. Circularity programs harvest components such as dual In-line memory modules (DIMMs) from end-of-life racks and redeploy them in new builds.
Knowing the emissions profiles of suppliers, components, and system designs. This in turn informs future roadmaps that will further reduce emissions.
Collaborating with suppliers to electrify their manufacturing processes, to transition to renewable energy, and to leverage lower carbon materials and designs.
These actions to reduce Scope 3 emissions from our IT hardware also have the additional benefit of reducing the amount of electronic waste (e-waste) generated from our data centers.
An Overview of the Types of Racks We Deploy
There are many different rack designs deployed within Meta’s data centers to support different workloads and infrastructure needs, mainly:
AI – AI training and inference workloads
Compute – General compute needed for running Meta’s products and services
Storage – Storing and maintaining data used by our products
Network – Providing Low-latency interconnections between servers
While there are differences in architecture across these different rack types, most of these racks apply general hardware design principles and contain active and passive components from a similar group of suppliers. As such, the same design principles for sustainability apply across these varied rack types.
Within each rack, there are five main categories of components that are targeted for emissions reductions:
Compute (i.e., memory, HDD/SSD)
Storage
Network
Power
Rack infrastructure (i.e., mechanical and thermals)
The emissions breakdown for a generic compute rack is shown below.
Our Techniques for Reducing Emissions
We focus on four main categories to address emissions associated with these hardware components:
We will cover a few of the levers listed above in detail below.
Modular Rack Designs
Modular Design which allows older rack components to be re-used in newer racks. Open Rack designs (ORv2 & ORv3) form the bulk of high volume racks that exist in our data centers.
Here are some key aspects of the ORv3 modular rack design:
ORv3 separates Power Supply Units (PSUs) and Battery Backup Units (BBUs) into their own shelves. This allows for more reliable and flexible configurations, making repairs and replacements easier as each field replaceable unit (FRU) is toolless to replace.
Power and flexibility The ORv3 design includes a 48 V power output, which allows the power shelf to be placed anywhere in the rack. This is an improvement over the previous ORV2 design, which limited the power shelf to a specific power zone
Configurations The rack can accommodate different configurations of PSU and BBU shelves to meet various platform and regional requirements. For example, North America uses a dual AC input per PSU shelf, while Europe and Asia use a single AC input.
Commonization effort There is an ongoing effort to design a “commonized” ORv3 rack frame that incorporates features from various rack variations into one standard frame. This aims to streamline the assembly process, reduce quality risks, and lower overall product costs
ORv3N A derivative of ORv3, known as ORv3N, is designed for network-specific applications. It includes in-rack PSU and BBU, offering efficiency and cost improvements over traditional in-row UPS systems
These design principles should continue to be followed in successive generations of racks. With the expansion of AI workloads, new specialized racks for compute, storage, power and cooling are being developed that are challenging designers to adopt the most modular design principles.
Re-Using/Retrofitting Existing Rack Designs
Retrofitting existing rack designs for new uses/high density is a cost-effective and sustainable approach to meet evolving data center needs. This strategy can help reduce e-waste, lower costs, and accelerate deployment times. Benefits of re-use/retrofitting include:
Cost savings Retrofitting existing racks can be significantly cheaper compared to purchasing new racks.
Reduced e-waste Reusing existing racks reduces the amount of e-waste generated by data centers.
Faster deployment Retrofitting existing racks can be completed faster than deploying new racks, as it eliminates the need for procurement and manufacturing lead times.
Environmental benefits Reducing e-waste and reusing existing materials helps minimize the environmental impact of data centers.
There are several challenges when considering re-using or retrofitting racks:
Compatibility issues Ensuring compatibility between old and new components can be challenging.
Power and cooling requirements Retrofitting existing racks may require upgrades to power and cooling systems to support new equipment.
Scalability and flexibility Retrofitting existing racks may limit scalability and flexibility in terms of future upgrades or changes.
Testing and validation Thorough testing and validation are required to ensure that retrofitted racks meet performance and reliability standards.
Overall, the benefits of retrofitting existing racks are substantial and should be examined in every new rack design.
Green Steel
Steel is a significant portion of a rack and chassis and substituting traditional steel with green steel can reduce emissions. Green steel is typically produced using electric arc furnaces (EAF) instead of traditional basic oxygen furnaces (BOF), allowing for the use of clean and renewable electricity and a higher quantity of recycled content. This approach significantly reduces carbon emissions associated with steel production. Meta collaborates with suppliers who offer green steel produced with 100% clean and renewable energy.
Recycled Steel, Aluminum, and Copper
While steel is a significant component of rack and chassis, aluminum and copper are extensively used in heat sinks and wiring. Recycling steel, aluminum, and copper saves significant energy needed to produce hardware from raw materials.
As part of our commitment to sustainability, we now require all racks/chassis to contain a minimum of 20% recycled steel. Additionally, all heat sinks must be manufactured entirely from recycled aluminum or copper. These mandates are an important step in our ongoing sustainability journey.
Several of our steel suppliers, such as Tata Steel, provide recycled steel. Product design teams may ask their original design manufacturer (ODM) partners to make sure that recycled steel is included in the steel vendor(s) selected by Meta’s ODM partners. Similarly, there are many vendors that are providing recycled aluminum and copper products.
Improving Reliability to Extend Useful Life
Extending the useful life of racks, servers, memory, and SSDs helps Meta reduce the number of hardware equipment that needs to be ordered. This has helped achieve significant reductions in both emissions and costs.
A key requirement for extending useful life of hardware is the reliability of the hardware component or rack. Benchmarking reliability is an important element to determine whether hardware life extensions are feasible and for how long. Additional consideration needs to be given to the fact that spares and vendor support may have diminishing availability. Also, extending hardware life also comes with the risk of increased equipment failure, so a clear strategy to deal with the higher incidence of potential failure should be put in place.
Dematerialization
Dematerialization and removal of unnecessary hardware components can lead to a significant reduction in the use of raw materials, water, and/or energy. This entails reducing the use of raw materials such as steel on racks or removing unnecessary components on server motherboards while maintaining the design constraints established for the rack and its components.
Dematerialization also involves consolidating multiple racks into fewer, more efficient ones, reducing their overall physical footprint.
Extra components on hardware boards are included for several reasons:
Future-proofing Components might be added to a circuit board in anticipation of future upgrades or changes in the design. This allows manufacturers to easily modify the board without having to redesign it from scratch.
Flexibility Extra components can provide flexibility in terms of configuration options. For example, a board might have multiple connectors or interfaces that can be used depending on the specific application.
Debugging and testing Additional components can be used for debugging and testing purposes. These components might include test points, debug headers, or other features that help engineers diagnose issues during development.
Redundancy In some cases, extra components are included to provide redundancy in case one component fails. This is particularly important in high-reliability applications where system failure could have significant consequences.
Modularity Extra components can make a board more modular, allowing users to customize or upgrade their system by adding or removing modules.
Regulatory compliance Some components might be required for regulatory compliance, such as safety features or electromagnetic interference (EMI) filtering.
In addition, changes in requirements over time can also lead to extra components. While it is very difficult to modify systems in production, it is important to make sure that each hardware design optimizes for components that will be populated.
Examples of extra components on hardware boards include:
Unpopulated integrated circuit (IC) sockets or footprints
Unused connectors or headers
Test points or debug headers
Redundant power supplies or capacitors
Optional memory or storage components
Unconnected or reserved pins on ICs
In addition to hardware boards, excess components may also be present in other parts of the rack. Removing excess components can lead to lowering the emissions footprint of a circuit board or rack.
Productionizing New Technologies With Lower Emissions
Productionizing new technologies can help Meta significantly reduce emissions. Memory and SSD/HDD are typically the single largest source of embodied carbon emissions in a server rack. New technologies can help Meta reduce emissions and costs while providing a substantially higher power-normalized performance.
Examples of such technologies include:
Transitioning to SSD from HDD can reduce emissions by requiring fewer drives, servers, racks, BBUs, and PSUs, as well as help reduce overall energy usage.
Depending on local environmental conditions, and the data center’s workload, using liquid cooling in server racks can be up to 17% more carbon-efficient than traditional air cooling.
Source: OCP Global Summit, Oct 15-17, 2024, San Jose, CA.
Teams can explore additional approaches to reduce emissions associated with memory/SSD/HDD which include:
Alternate technologies such as phase-change memory (PCM) or Magnetoresistive Random-Access Memory (MRAM) that have the same performance with low carbon.
Use Low-Power Double Data Rates (LPDDRs ) for low power consumption and high bandwidth instead of DDR.
Removing/reusing unused memory modules to reduce energy usage or down-clocking them during idle periods.
Using fewer high capacity memory modules to reduce power and cooling needs. Use High Bandwidth Memory (HBM) which uses much less energy than the DDR memory.
Choosing the Right Suppliers
Meta engages with suppliers to reduce emissions through its net zero supplier engagement program. This program is designed to set GHG reduction targets with selected suppliers to help achieve our net zero target. Key aspects of the program include:
Providing capacity building: Training suppliers on how to measure emissions, set science-aligned targets, build reduction roadmaps, procure renewable energy, and understand energy markets.
Scaling up: In 2021 the program started with 39 key suppliers; by 2024 it expanded to include 183 suppliers, who together account for over half of Meta’s supplier-related emissions.
Setting target goals: Meta aims to have two-thirds of its suppliers set science-aligned greenhouse gas reduction targets by 2026 . As of end-2024, 48% (by emissions contribution) have done so.
The Clean Energy Procurement Academy (CEPA), launched in 2023 (with Meta and other corporations), helps suppliers — especially in the Asia-Pacific region — learn how to procure renewable energy via region-specific curricula.
The Road to Net Zero Emissions
The Design for Sustainability principles outlined in this guide represent an important step forward in Meta’s goal to achieve net zero emissions in 2030. By integrating innovative design strategies such as modularity, reuse, retrofitting, and dematerialization, alongside the adoption of greener materials and extended hardware lifecycles, Meta can significantly reduce the carbon footprint of its data center infrastructure. These approaches not only lower emissions but also drive cost savings, e-waste reductions, and operational efficiency, reinforcing sustainability as a core business value.
Collaboration across hardware designers, engineers, suppliers, and sustainability experts is essential to realize these goals. The ongoing engagement with suppliers further amplifies the impact by addressing emissions across our entire value chain. As Meta continues to evolve its rack designs and operational frameworks, the focus on sustainability will remain paramount, ensuring that future infrastructure innovations support both environmental responsibility and business performance.
Ultimately, the success of these efforts will be measured by tangible emissions reductions, extended useful life of server hardware, and the widespread adoption of low carbon technologies and materials.