The oil market has been in surplus since the start of the year, but stock builds have so far been concentrated in crude in China and gas liquids in the United States. By September, however, a surge in Middle East production, coinciding with seasonally lower regional crude demand, boosted exports to two and a half-year highs. This, combined with robust flows from the Americas, swelled oil on water in September by a massive 102 mb, equivalent to 3.4 mb/d, the largest increase since the Covid-19 pandemic. Brent crude oil futures rose by an average $0.30/bbl to $67.60/bbl m-o-m in September. But by early October, the wave of tankers at sea and the announcement of new trade measures pushed prices down by $4/bbl to $64/bbl at the time of writing.
Global oil supply in September was up by a massive 5.6 mb/d compared with a year ago. OPEC+ accounted for 3.1 mb/d of the increase, as the Group of 8 unwound 2 mb/d of production cuts, and as Libya, Venezuela and Nigeria all posted strong gains. Based on their latest agreement, OPEC+ is now on track to lift output by 1.4 mb/d on average this year and by a further 1.2 mb/d in 2026. Non-OPEC+ producers are set to add 1.6 mb/d and 1.2 mb/d, respectively, over the same timeframe, with the United States, Brazil, Canada, Guyana and Argentina leading growth. Risks to the forecast remain, with sanctions imposed on Russia and Iran compounding geopolitical concerns. Persistent attacks on Russian energy infrastructure have cut Russian crude processing by an estimated 500 kb/d, resulting in domestic fuel shortages and lower product exports. The drop in Russian middle distillate exports reverberated globally as regular buyers scrambled to secure alternative supplies, bidding up diesel and jet fuel cracks in the process. Light sweet crude refining margins hit two-year highs in Europe and 18-month highs on the US Gulf Coast and in Singapore in September.
As for global oil demand, the third quarter of 2025 saw growth rebound to 750 kb/d y-o-y from the second quarter’s 420 kb/d pace, when consumption was weighed down by tariff turmoil, especially for LPG/ethane feedstocks that posted a rare contraction. Third-quarter gains are largely in line with our annual growth forecast of around 700 kb/d in both 2025 and 2026. Despite recent sluggish growth, the petrochemical sector will reassume its position in the driving seat of oil demand growth, as subpar economic conditions, increasing vehicle efficiencies and strong EV sales make for strong headwinds for road transport fuels.
Amid the backdrop of slower demand growth and a rapid increase in crude supplies, global oil balances have seen a 1.9 mb/d surplus since the start of the year, yet crude prices have fluctuated around $70/bbl so far in 2025. That range has been kept in check in part because NGLs dominated the overhang from April through August. Indeed, outside of China, the crude market tightened over the same period. Looking ahead, as the significant volumes of crude oil on water move onshore to major oil hubs, crude stocks look set to surge while NGLs start to drop. However, the loss of Russian product supplies, upcoming EU restrictions on product imports derived from Russian feedstocks, and recent refinery capacity closures may keep the product markets tighter than the overall balance would suggest.
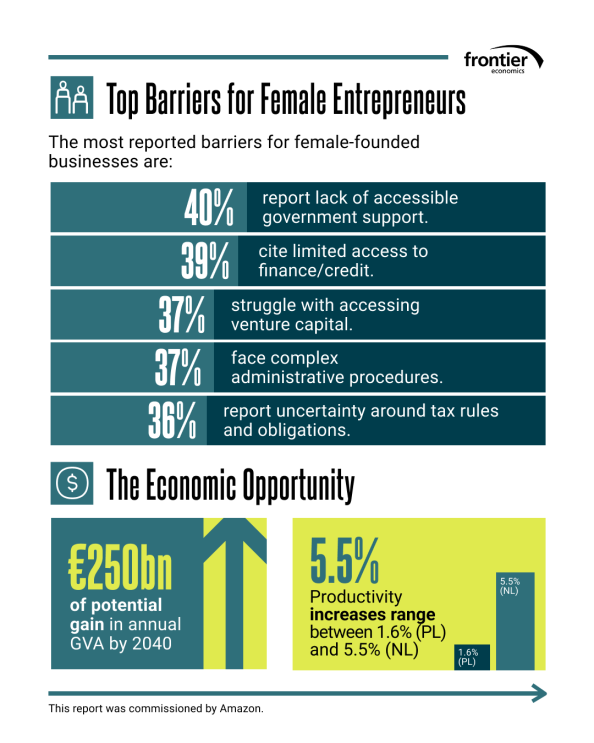
Achieving gender parity in entrepreneurship could significantly boost European economies, new research carried out by Frontier Economics and commissioned by Amazon shows. The study looked at 13 European countries and found that reaching gender parity in new business creation—where 50% of startups are founded by women—could increase productivity by 1.6% to 5.5% by 2040, depending on the country, translating into substantial economic gains across the continent.
Currently, only one-third of EU businesses are started by women, representing significant untapped potential. By 2040, the present value of the annual increase in Gross Value Added (GVA) from achieving gender parity would reach approximately €250 billion across the studied countries—larger than the EU’s annual budget.
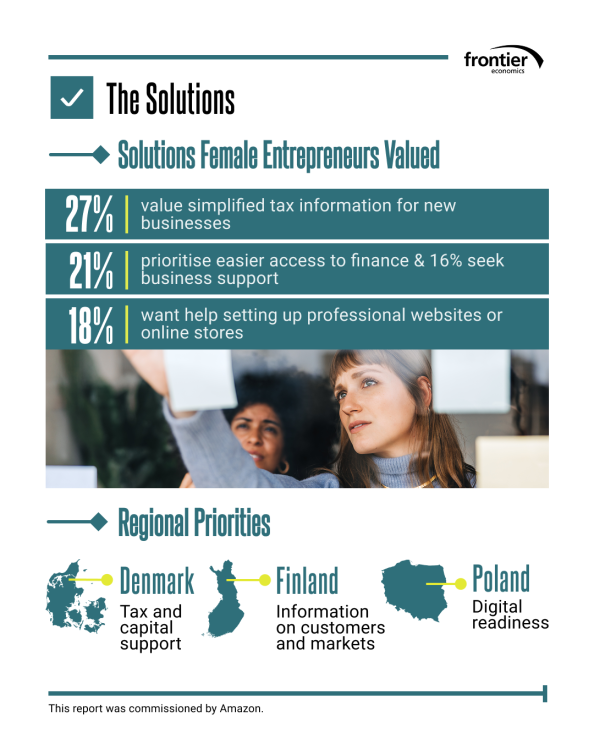
To further understand the challenges behind this gender gap, the study surveyed approximately 600 business founders across six European countries—Denmark, Finland, France, Germany, Italy, and Poland—revealing specific barriers that disproportionately affect women entrepreneurs.
Key barriers holding back female entrepreneurs
While all entrepreneurs face challenges when starting and growing businesses, female founders reported more significant hurdles for growth and scale in several areas:
Access to capital: 37% of female-founded businesses cited difficulty accessing investors or venture capital as a moderate or significant barrier, while 39% reported limited access to finance or credit.
Regulatory obstacles: 40% of female entrepreneurs identified lack of accessible government support (incubators, networks, mentorship programs, courses one-stop-shops for important info and reporting) such as a barrier, with 37% struggling with complex administrative procedures.
These barriers not only affect individual entrepreneurs but also have broader implications for Europe’s economic competitiveness on the global stage.
The EU context: Opportunities to Leverage Existing Frameworks Supporting female entrepreneurship is extremely timely. Mario Draghi’s report on “The future of European competitiveness” highlights that the EU needs increased annual investments and R&D spending by €750-800 billion to unlock its full potential. Meanwhile Atomico points to a €375 billion shortfall in growth-stage funding for European startups over the past decade.
The European Commission’s Competitiveness Compass already contains several encouraging elements that could support entrepreneurial growth, including commitments to:
Remove Single Market barriers that prevent investment, scaling and technology diffusion.
Cut red tape by leveraging digital tools such as digital by default solutions for accessing company information, European Digital Identity Wallets, trust services, and tools for simplifying sustainability reporting and the EU taxonomy.
These strategic priorities align well with supporting female entrepreneurship, but more targeted measures are needed. By specifically addressing the barriers faced by women entrepreneurs within its competitiveness strategy, the EU could make significant progress toward closing its productivity gap with global competitors.
Five priority actions for policymakers and the EU
The study found that without additional measures, closing the gender gap among entrepreneurs would take between 6 and 24 years, depending on the country. However, accelerating this timeline to just five years would increase cumulative benefits by 45%.
Based on the research findings, five key priorities emerged for supporting female entrepreneurship, which the European Commission might want to adopt:
Ensure that EU and national competitiveness strategies support SMEs and female entrepreneurs: Ensuring that policies designed to boost entrepreneurship explicitly address gender-specific barriers.
Improving access to finance for female founders: Creating targeted funding mechanisms and investor education programmes to address the capital gap.
Simplifying regulatory processes: Reducing administrative complexity that disproportionately affects women entrepreneurs with fewer resources or established networks
Supporting digital readiness: Enhancing training and resources to help women-led businesses fully leverage digital marketplaces and tools.
Addressing structural constraints: Implementing policies that help balance entrepreneurial activities with caregiving responsibilities.
The full report, “From Gender Gap to Competitive Edge: Advancing Female Entrepreneurship in Europe,” provides detailed findings and recommendations for EU and national policymakers, business leaders, and support organisations looking to promote more inclusive entrepreneurial ecosystems across Europe.
Amazon’s European initiatives
Amazon is already implementing programmes across Europe demonstrating practical ways to support women entrepreneurs:
Ruth Díaz, Amazon’s Country Manager for Spain
Gulfem Toygar, Amazon’s Country Manager for Sweden
Katarzyna Ciechanowska- Ciosk, Amazon’s Country Manager for Poland
Lucy C. Cronin, Amazon’s Vice President for EU Public Policy
Mariangela Marseglia, Amazon’s Vice President of Amazon European Stores
Enhancing digital skills and networks
“In Spain, we partner with Womenalia, the world’s largest Spanish-speaking network of professional women, to offer free training events focused on e-commerce, digital marketing, wellness, productivity, and networking. Our ‘Women Breaking Barriers’ initiative, driven by Amazon and Womenalia, has brought together hundreds of businesswomen in different Spanish cities to enhance their digital skills and strengthen their professional networks,” said Ruth Díaz, Amazon’s Country Manager for Spain.
Providing capital and business development support
“We are partners of Feminvest, the Nordic region’s largest hub for female entrepreneurs and investors, and we have recently launched Amazon Expand, a programme that will provide nine selected female entrepreneurs with support over a full year, combining business development expertise with specialised coaching in online marketplace scaling.” said Gulfem Toygar, Amazon’s Country Manager for Sweden.
Creating simplified pathways to market
“Polish women entrepreneurs are increasingly drawn to trusted marketplaces, which streamline the initial stages of their journey and guide them step by step through the e-commerce landscape. We share our know-how with sellers and help them expand their businesses”, explained Katarzyna Ciechanowska- Ciosk, Amazon’s Country Manager for Poland.
A call to action for Europe’s economic future
“Our research clearly shows that digital marketplaces are powerful equalisers for female entrepreneurs. Boosting female entrepreneurship isn’t just about equality—it’s essential for Europe’s competitiveness and economic prosperity. As a former entrepreneur myself, I believe digital tools are key to creating more inclusive economic growth across the continent.” Lucy C. Cronin, Amazon’s Vice President for EU Public Policy.
“This research demonstrates that achieving gender parity in entrepreneurship is not just a social imperative, it’s a tremendous economic opportunity for Europe. With the potential to generate €250 billion in value by 2040, supporting women entrepreneurs is one of the smartest investments we can make in Europe’s future competitiveness. At Amazon, we’re committed to breaking down the barriers women face, particularly in accessing capital and navigating regulatory complexity. By leveraging digital tools and marketplaces, we’re creating pathways for female founders to scale their businesses across borders with fewer obstacles. The data is clear: empowering women entrepreneurs drives innovation, creates jobs, and builds a more resilient European economy.” Mariangela Marseglia, Amazon’s Vice President of Amazon European Stores.
[Paris, France, October 13, 2025] At the 11th Ultra-Broadband Forum (UBBF) 2025, James Chen, the President of Huawei’s Carrier Business, shared a number of new best practices the company has developed with operators that drive growth with AI-powered ultra-broadband (UBB). In his keynote speech, “Triple Leaps to AI UBB: Inspiring New Business Growth,” Chen said operators have taken leaps in depth, breadth, and height to create new growth in the AI UBB era.
James Chen, President of Huawei Carrier Business, delivering a keynote speech
“Leapfrog innovations drive great business success,” he said. “Operators can seize this major opportunity to create new growth by deepening experience assurance capabilities, expanding business boundaries to include digital and intelligent services, and competing at higher levels by accelerating network intelligence.” Based on operators’ practices in different sectors, Chen interpreted the leaps in three dimensions of innovation: depth, breadth, and height.
A leap in depth: Driving a paradigm shift from bandwidth- to experience-centric monetization
Carriers combine AI capabilities with networks to accurately detect where application experience improvements are needed and proactively ensure the experience of key applications such as AI cloud gaming and 4K livestreaming, achieving a leap from user-level to application-level experience monetization.
An example of how this new monetization model helps operators is a leading operator from Thailand that has used Huawei’s AI WAN solution to develop new application-level experience assurance capabilities. This operator can now provide application acceleration packages for services such as gaming, home office, and livestreaming. This has enabled users to enjoy a smoother gaming experience, while the operator has drastically increased average revenue per user (ARPU).
A leap in breadth: Pushing the business boundaries to include digital intelligence and computing services
In the home network market: Global operators collectively have over 1 billion home gateways, which give them a natural advantage in upgrading from home network providers to smart home service providers. This year, Huawei developed a new home gateway – the AI Homehub, which supports voice interaction and quick AI agent deployment. One operator has rolled out smart home services using this home gateway and increased its ARPU of home services by 60%.
In the SME market: Operators can use fiber to the office (FTTO) solutions to build a unified management platform, and provide SMEs with standard digital and intelligent services such as video and IoT services, helping enterprises realize intelligent transformation. Huawei has developed a series of FTTO solutions that integrate network, security, and computing capabilities. China’s three major carriers have already commercially used solutions such as these at scale to develop more than 2 million FTTO users.
In the mid-sized and large enterprise market: Operators are using Wi-Fi-based integrated sensing and communications to develop new tools for growth. For example, some operators have used the technology in scenarios such as fall detection in elderly care and intelligent meeting room management for enterprises. In the UAE, e& has used Huawei’s AirEngine Wi-Fi 7, an integrated sensing and communications product, to provide Wi-Fi-as-a-Service offerings, which help enterprises reduce the TCO of a meeting room sensing system by 67%. Within a year, e& has gained 13% more customers.
In the blue-ocean market of AI enterprise services: More enterprises are accessing cloud compute and require on-premise data processing, which requires networks that support new capabilities such as lossless transmission, elasticity, and security. This means computing-network service opportunities for operators. Huawei has worked with China Telecom Shanghai to develop an intelligent IP WAN with high computing usage effectiveness (CUE). This network enables enterprise customers to expand compute capacity in just weeks with less than 5% CUE loss. This means reliable access to AI DCs for enterprises and ensures that privacy data always stays within the enterprise.
A leap in height: Network O&M transformation from work-order-driven operations to intelligent operations
Operators can drive level 4 network autonomy for more intelligent networks to move away from work-order-driven operations towards intelligent operations.
For example, Huawei has worked with MasOrange in Spain to build Europe’s first level 4 autonomous IP network. Using iMaster NCE, the operator has been able to reduce mean time to repair (MTTR), which in turn helps to enhance user satisfaction.
Chen wrapped up his speech by saying that AI UBB is just starting out, and that Huawei is excited to work with operators and industry partners to pursue continuous innovation. The company aims to help operators succeed in the AI era through experience monetization, a second growth curve, and OPEX reduction.
Ask almost any CFO today what keeps them awake at night, and the answer is the same: uncertainty. Markets shift without warning, geopolitical tensions flare, and the pressure to deliver on cost never quite eases. For leaders trained to manage risk, the instinct is to hold on tighter -to stick with what feels safe and predictable. But in business, comfort can become a trap. What feels safe in the moment often keeps progress stuck.
Research shows 70% of CFOs in Europe don’t want to take any risks right now. Whereas in the US, two-thirds are actually planning to invest almost nine percent more in their businesses. And history shows, it’s those who act that set the pace. Today’s CFOs are no longer just guardians of the balance sheet. They are the drivers of change. Digitalisation, decarbonisation, AI – none of these come with certainty. All demand courage.
‘Get un’
That’s why in our latest Wholesale Banking campaign we called on business leaders to break out of their comfort zones and “get un—” : unstuck from what’s holding them back; unbound from legacy thinking; unscripted from the way things are usually done; and unboxed by borders. All rooted in the belief that progress is always possible.
The digital campaign ran in France, Belgium, Italy, Poland, Romania, Singapore and the UK during August and September. It was featured on websites of the Financial Times and Bloomberg and appeared on other relevant business and financial websites targeting key financial professionals, including treasurers, cash managers, finance directors & CFOs of large multinational companies enterprises.
It aimed to help clients navigate uncertainty and unlock opportunities with a mix of strategic thinking, financial expertise and real-world understanding of the sectors and markets they’re active in.
L’IATA souligne les priorités essentielles pour la sécurité et les opérations aériennes (pdf)
IATA destaca las prioridades para una aviación segura (pdf)
Xiamen – The International Air Transport Association (IATA) highlighted three critical priorities for aviation safety and operations as the World Safety and Operations Conference (WSOC) opened today in Xiamen, China. These are: defending and evolving global standards, fostering a strong safety culture through leadership, and using data to enhance performance amid growing operational challenges.
“The environment in which airlines operate has grown even more complex as conflicts and regulatory fragmentation have proliferated. As a result, we have seen airspace closures, drone incursions and rising global navigation satellite system (GNNS) interference disrupt connectivity, undermine confidence, and threaten safety. Ensuring aviation remains the safest mode of transport requires strong leadership, robust adherence to global standards, and smarter use of data. By focusing on these—industry and government together—we will build a safer, more resilient and increasingly efficient global aviation system that can manage today’s risks and is prepared for those of tomorrow,” said Mark Searle, Global Director Safety, IATA.
Defending and Advancing Global Standards
Global standards are essential to aviation safety. Current standards must be adhered to and future standards must be developed to continuously improve industry safety performance. Currently, this focus revolves around:
Addressing GNSS Interference: Reports of GNSS interference have increased by more than 200% between 2021 and 2024. Neither spoofing nor jamming of GNSS systems is acceptable. Together with EASA, IATA has launched a GNSS Resilience Plan built on four priorities: monitoring and reporting, prevention tools, backup infrastructure, and civil–military coordination. The next step is for ICAO to advance these solutions through global standards, guidance, and reporting.
Protecting Aviation’s Radio Spectrum: The radio spectrum essential for aviation navigation, defined in ITU’s global standards, must be safeguarded. The rapid expansion of 5G, and soon 6G, is putting pressure on aviation’s allocations. In several markets, including Australia, Canada and the United States, 5G rollouts have created interference risks near airports and forced costly retrofits. Stronger coordination with telecommunications regulators and realistic timelines for mitigation are urgently needed, along with the development of more resilient on-board systems.
Timely Accident Investigation Reporting: Global standards under Annex 13 of the Chicago Convention clearly define the need for timely accident investigations. Yet, only 58% of accidents between 2019 and 2023 have produced a final report. Delays hinder the industry’s ability to learn vital safety lessons and create space for speculation and misinformation. IATA continues to remind governments of their obligations while recognizing progress, such as the prompt preliminary reports issued following recent accidents in India, South Korea, and the United States.
Using Data to Enhance Performance
Data is transforming aviation safety, delivering the insights needed to anticipate risks and enhance performance. Through the Global Aviation Data Management (GADM) program, which integrates the Flight Data eXchange (FDX), Incident Data eXchange (IDX), and Maintenance Cost Data eXchange (MCX), IATA is enabling data-driven decision-making across airlines and regulators.
Areas where data is making a difference include:
Turbulence Aware: IATA’s Turbulence Aware platform shares data in real-time, enabling pilots and dispatchers to mitigate the risks stemming from inflight turbulence. Participation in the platform grew 25% over the past year, with 3,200 aircraft including Air France, Etihad, and SAS now sharing real-time turbulence data to enhance flight safety and efficiency.
Predictive safety insights: The SafetyIS database, drawing on in-flight data from 217 airlines, enables predictive analysis. For example, early identification of a spike in collision-avoidance alerts at a Latin American airport allowed swift action to reduce risks.
Risk-based IOSA: The risk-based IOSA audit model is well-established in using data to tailor audits to each airline’s operational profile. Already it has resulted in more than 8,000 corrective actions that are strengthening safety.
Fostering a Strong Safety Culture Through Leadership
Leadership is central to a strong aviation safety culture. Strong safety leadership creates an environment where employees are empowered to raise concerns and are confident that issues will be resolved quickly and effectively.
To reinforce this, IATA has developed two key initiatives:
Safety Leadership Charter: Promoting eight core principles of safety leadership, the Charter now covers around 90% of global traffic, strengthening a culture built on leadership, global standards, and data.
IATA Connect: Bringing together 5,600 users from over 600 organizations, IATA Connect enables access to IOSA documentation, the Safety Issue Hub, and Safety Connect, and will soon expand to include ISAGO users.
For more information, please contact: Corporate Communications Tel: +41 22 770 2967 Email: corpcomms@iata.org
Notes for Editors:
IATA (International Air Transport Association) represents some 350 airlines comprising over 80% of global air traffic.
You can follow us on X for announcements, policy positions, and other useful industry information.
U.S. President Donald Trump gestures as he poses next to a sign before a family photo at a world leaders’ summit on ending the Gaza war, amid a U.S.-brokered prisoner-hostage swap and ceasefire deal between Israel and Hamas, in Sharm el-Sheikh, Egypt, Oct. 13, 2025.
Suzanne Plunkett | Reuters
This might not be Christmas, but the war in the Middle East is over — at least according to U.S. President Donald Trump.
On Monday, Trump declared at the Knesset, Israel's parliament, that the "long and painful nightmare" was finally over for both the Israelis and Palestinians. More straightforwardly, Trump gave an unequivocal "yes" when asked by reporters if the war in the Middle East has ended, Reuters reported.
A similarly hopeful mood permeated markets, though for different reasons. After hitting China with 100% additional tariffs and triggering a sell-off on Friday, Trump appeared to walk back his stance, posting on Truth Social that "it will all be fine" with China.
And thus was TACO back on traders' menus: Major U.S. stock indexes rebounded, with technology stocks leading the charge. Quantum computing names popped after JPMorgan Chase announced it will be investing $10 billion in sectors crucial to national interests.
Broadcom, meanwhile, surged almost 10% after it jointly announced a partnership with — who else? — OpenAI to build and deploy custom chips. But where this puts Nvidia, OpenAI's other near and dear one, and on whose chips the ChatGPT maker relies, remains a question.
Though Christmas has yet to arrive, OpenAI is starting to look like the tech sector's Santa Claus, who has his sack full of presents — and, more importantly, cash, according to Oracle.
— CNBC's Holly Ellyatt contributed to this report.
What you need to know today
And finally...
U.S. President Donald Trump shakes hands with Argentina's President Javier Milei during the 80th United Nations General Assembly, in New York City, New York, U.S., Sept. 23, 2025.
Alexander Drago | Reuters
The U.S. has stepped in with an extraordinary bailout of Argentina. Here's what it means
In a move that Treasury Secretary Scott Bessent announced Thursday on social media site X, the U.S. is providing a $20 billion currency swap line with Argentina's central bank — essentially exchanging stable U.S. dollars with volatile pesos.
The move comes amid liquidity concerns in Argentina that threatened stability for the country as it faces key midterm elections. There are equal parts economic and political stakes with the venture, which marks the first U.S. intervention of this nature since rescuing Mexico in 1995.
In today’s fast-paced digital economy, every sector increasingly adopting digital transformation to stay competitive and improve operational efficiency [39]. Many countries have rapidly progressed in infrastructures, support mechanisms, and aligning Information and Communication Technologies (ICT) policy with healthcare vision [37, 78]. These technological advantages have sparked the attention of many countries to digitize healthcare and the increasing penetration of mobile devices have influenced their use in medical education and healthcare delivery [56]. Innovative technologies like mobile devices offer methods to enhance healthcare data access in Low and Middle-Income Countries (LMICs). Mobile devices are thought to help hospital staff work more efficiently, leading to better patient care. Since the Covid-19 pandemic, the use of remote and virtual healthcare services like telehealth and remote monitoring has increased significantly. Bring Your Own Device (BYOD) supports this by allowing healthcare providers to move around easily and coordinate patient care more effectively [109].
Bring-your-own-device (BYOD) is generally conceptualized as employees’ use of personal mobile devices to complete work-related tasks [55]. Driven by rapid advances in ICT and a recent increase in consumer ICTs in the workplace, BYOD is considered a form of Information Technology (IT) consumerization [109]. BYOD is already a working fashion, as the use of portable electronic devices has progressively risen in past years. BYOD applies to workers bringing their devices to the office [23].
Furthermore, previous studies find out that the acceptance of BYOD depends on the combination of related variables that must be synchronously taken into account and it depends on the individual qualities that need to be discussed [25, 81, 91]. The importance of variables that affects the acceptance of individuals may not be the same when studied within developed and emerging nations as the beliefs, morals and traditions of these countries are also unique, and this may influence their attitudes towards technology acceptance [1, 6, 8, 13, 17].
Despite the growing adoption of BYOD in healthcare, and extensive research exists on various perspectives of BYOD adoption, there remains a significant gap in research exploring doctors’ perspectives, particularly their willingness to adopt BYOD, the concerns they face, and their firsthand experiences. Most of the studies concentrated on organisational risks such as virus attacks, employees’ improper use of assets and information [114] and growing concerns for organisation information security management [89, 108]. Unauthorised employees’ access to organisation information, download risky mobile applications and stolen; lost device [22] neglect safety issues about possible breaches of sensitive or secret details [108].
While numerous studies have explored BYOD in healthcare, the majority have focused on socio-technical aspects and its impact on clinical and administrative work [109], investigation of the role of BYOD devices in fostering cybersecurity awareness and its correlation with the productivity of healthcare professionals [67] and investigate security risk perception and safeguard adoption of mobile devices among medical practitioners and IT administrators [9]. Also, BYOD challenges and risks while managing and controlling corporate data and networks [12] and BYOD challenges when employees fail to comply with security policies [76]. Despite the acknowledged benefits of BYOD and its initiatives in recent literature, its adoption remains insignificant among doctors of developing countries, including Pakistan [58].
However, they neglect the perspective of the primary user—the doctors—who is expected to voluntarily use their personal devices for professional purposes. Without addressing the willingness of doctors to adopt BYOD, the effort to create a seamless BYOD environment becomes futile, as the success of this model hinges on their active and voluntary participation [22, 108, 110, 116]. This gap highlights the need to investigate doctors’ intention to ensure BYOD implementation aligns with their needs and preferences, ultimately enhancing its effectiveness in clinical practice.
Doctors’ intention to adopt BYOD is critical because they are the ones bringing their own devices into the professional setting [42]. Their concerns, motivations, and preferences are pivotal to the model’s success, yet remain underexplored in the literature. Key questions arise about their privacy concerns when blending personal and professional data on a single device [64, 70]. This lack of clarity on privacy-related apprehensions, especially when the device is owned and controlled by the doctor, creates a significant barrier to understanding their willingness to adopt BYOD [22].
Privacy and security are primary concerns in healthcare communication technologies. These problems emerge as mobile phones handle sensitive data and highly confidential data. The confidentiality vulnerability from practitioners is an issue that needs to be considered so that only permitted people can access sensitive information. However, some studies have investigated information security-related empirical research. The increase of different devices has led to an increased risk of exposure to viruses, malware, and a host of other security issues and the potential leaking of sensitive material and data [14]. The challenge in adopting BYOD is ensuring the safety and security of the doctors’ data and devices. Furthermore, using their own devices may instill greater confidence among doctors compared to using company-provided devices, which often require additional training or adjustment. Doctors may find personal devices more convenient, familiar, and efficient for professional use. Additionally, the cost of the device falls on the doctor, further emphasizing the need to understand their willingness and readiness to embrace BYOD.
The limitations of BYOD adoption are linked to several variables, representing the individual’s characteristics and features of the technology itself. The importance of variables that affect individuals’ acceptance may not be the same when studied within developed and emerging nations, as these countries’ beliefs, morals, and traditions are unique. Pakistan’s doctors represent the primary users of BYOD, and their acceptance of it can significantly influence its adoption. The study manifests a need for empirical evidence to identify and evaluate the determinant factors underlying how doctors in emerging nations might see and intend to adopt BYOD.
By addressing these gaps, this study seeks to contribute to a deeper understanding of doctors’ intentions and motivations, which are crucial for the effective implementation of BYOD in healthcare settings specifically doctors’ intention to accept health technologies to allow effective healthcare administration in Pakistan. Hence, a specific model is required to examine BYOD’s intention among the doctors in Pakistan.
Research model
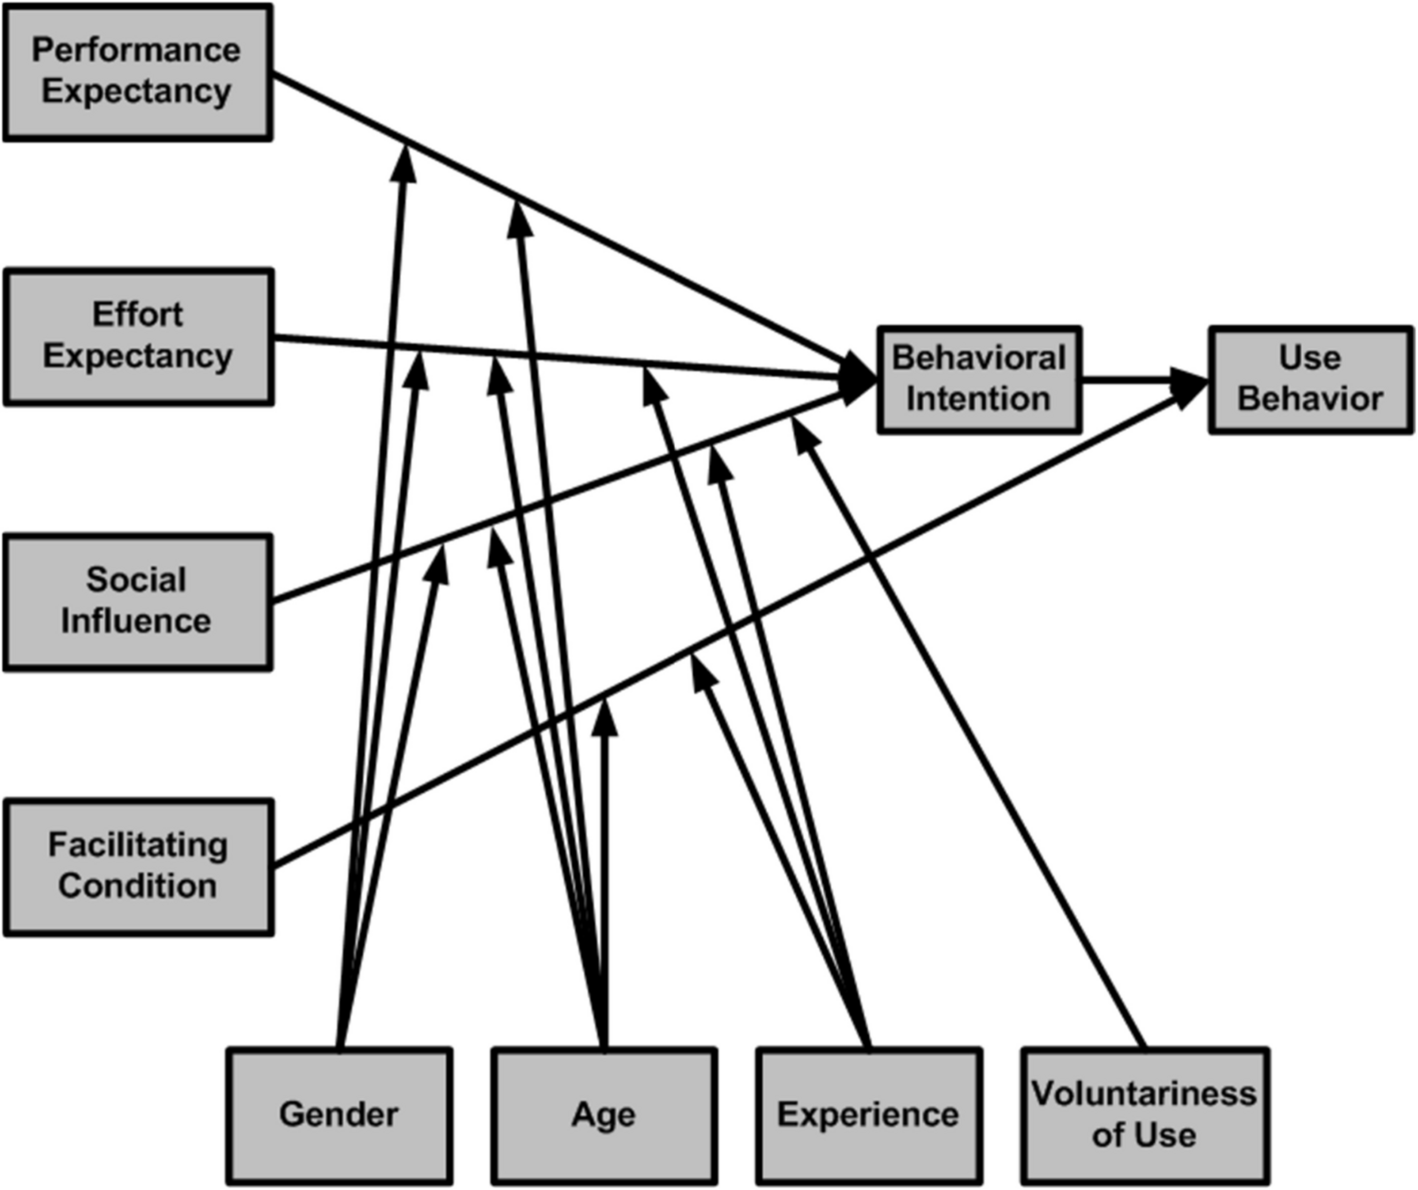
Venkatesh [101] presented Unified Theory of Acceptance and Use of Technology (UTAUT) in 2003 after reviewing eight models and theories, this model is suitable for defining employees’ technology acceptance and use. UTAUT posits several factors that shape an individual’s inclination to adopt a technology [2]. The model presented three variables: performance expectancy, effort expectancy, and social influence that directly affect behavioural intention. Facilitating conditions and behavioural intention direct affect technology use. Those relationships moderated by age, gender, experience and voluntariness [101], as displayed in Fig. 1.
Fig. 1
Unified Theory of Acceptance and Use of Technology (UTAUT) [101]
Nevertheless, in a healthcare context, the UTAUT model does not seem to have a similar effect as in any other settings in order to describe doctors’ attitudes, and the variance described in previous studies seems to be noticeably smaller than the variance defined in the UTAUT model, reflecting a limitation in the healthcare system [1, 15, 19, 52, 103]. These research results supported this study to integrate the UTAUT model with other factors to measure its significance in the Pakistani doctors’ context.
While UTAUT2 provides a comprehensive framework for understanding users’ behavioural intentions and technology usage, it has several limitations [2]. Cognitive perspectives are widely used to explain behavioural patterns and variables that may influence a protective or preventive action. These theories examine cognitive behaviour change and share the presumption that attitudes, beliefs, expectations of future events and outcomes are important factors for health-related behavior [72]. Protection Motivation Theory (PMT) is a social-cognitive model that identifies behavior [69]. PMT was presented by Rogers [84] as a theory for explaining the influence of fear appeals. It is commonly used in the health domain, but it has increasingly gained popularity in the information security domain [16, 99]. PMT examine the motivational reasons for adopting protective measures and breaks them into threat and coping appraisal. In the context of BYOD, the threat appraisal refers to the perceived vulnerability as a possibility of a security incident and the perceived severity as the impact of outcomes resulting from a security incident [27]. The coping appraisal refers to the individual’s evaluation of how well he/she can manage in the given situation. The coping appraisal process consists of response costs and self-efficacy, as shown in Fig. 2.
Fig. 2
Protection motivation theory
This research’s proposed hybrid model is presented in Fig. 3. The UTAUT model forms the backbone for the theoretical framework for this study. Additional factors were added to the base model to improve its performance regarding explaining the consumer’s behaviour. Perceived vulnerability and perceived severity represented the threat appraisal and; response cost and self-efficacy represented coping appraisal. In this study, all additional hypotheses have a negative affect on behavioural intention except self-efficacy.
Fig. 3
The present study makes slight modifications to the model. In this research, the focus is on behavioural intention. Since the dependent variable is behavioural intention, and the adoption is pre-implementation, there is no sense to measure the use of technology. Age and gender will moderate all relationships of UTAUT due to the novelty of BYOD and the pre-implementation research, experience and voluntariness of use as a moderator had dropped.
Research objectives
The main research objective was to propose a hybrid model of intention to adopt BYOD amongst Pakistani doctors. Therefore, to accomplish the main objective, the following specific objectives were also formed:
To identify the determinant factors for intention to adopt BYOD among Pakistani doctors
To identify the moderating effect of age and gender on the intention to adopt BYOD
To develop the hybrid model of behavioural intention to adopt BYOD among Pakistani doctors
To validate the proposed model of intention to adopt BYOD through practitioners
Hypothesis development
In this study, the hybrid model was proposed as the theoretical framework. The hypotheses are divided into two categories; main (direct) relationships and moderating relationships. In this study, Intention to Adopt BYOD (IAB) is the dependent variable. Behavioural intention is the strength of a user’s intention to achieve a specific behaviour; it indicated a human’s desire to adopt a technology [30, 101].
Performance Expectancy (PE) is a key predictor of behavioral intention in technology adoption across various fields, including healthcare, education, and commerce. It reflects the perceived benefits of technology in enhancing efficiency and outcomes. Research by [11] and [31] shows that PE significantly influences the adoption of Business Intelligence (BI) systems and blockchain in healthcare, emphasizing improved decision-making and operational efficiency. Studies by [90] further highlight how PE drives Bring Your Own Device (BYOD) and mobile device adoption by promoting mobility and convenience. In education, [50] underline PE’s role in providing resource access and bridging knowledge gaps. Studies have shown that PE significantly influenced behavioural intention to adopt technology in healthcare [3, 32, 81, 105]. In BYOD, PE is defined as how adopting the technology will influence users to perform activities [101, 102]. It shows the practical value for users adopting the technology, identified in different technology acceptance models, such as perceived usefulness in the TAM, extrinsic motivation in the Motivational Model (MM), and relative advantage in the Innovation Diffusion Theory (IDT).
Overall, these studies illustrate PE’s importance in technology adoption, particularly where clear benefits exist, such as faster decision-making and enhanced collaboration. In healthcare, PE encapsulates advantages like real-time patient data access and workflow integration, making it a crucial element of frameworks like the Unified Theory of Acceptance and Use of Technology (UTAUT). PE influences technology adoption by enhancing user acceptance, facilitating collaboration, and empowering staff through the use of preferred devices. Positive experiences with personal devices lead to faster decision-making and better integration into workflows, making users more likely to embrace BYOD policies. In this study, PE is a doctors’ perception of the degree to which the doctors’ believe that using a BYOD will help him/her to attain gains in job performance. When doctors believe that using BYOD can empower them to improve healthcare capabilities, doctors’ are likely to adopt the technology. Thus, PE was measured with five questions that focused on the intention to adopt BYOD. Therefore, the researcher hypothesized that:
Effort Expectancy (EE) is a crucial predictor of behavioral intention in technology adoption, particularly in professional environments, acknowledged as the extent of ease linked to a consumers’ technology utilization [5]. Research by [11] and [31] shows that healthcare professionals are more likely to adopt technologies like Business Intelligence (BI) systems and blockchain when they find them intuitive and easy to use. EE has a significant role in predicting behavioural intention in healthcare settings [32, 60, 86] significance of PEOU is a related factor to EE, as a predictor of behavioural intention, confirmed by other studies [7]. Another study [59] identified that healthcare professionals’ behavioural intention for Electronic Health Record (EHR) system affected perceived ease of use rather than perceived usefulness. Furthermore, studies by [90] indicate that EE is vital in the adoption of BYOD policies and mobile technologies. Users prefer systems that integrate smoothly into their workflows without extensive training. It is also essential to recognize that the significance of EE can vary across different contexts and user demographics. A study by [50] found that, contrary to expectations, EE did not significantly affect medical students’ decisions regarding Wi-Fi adoption. This outcome might be attributed to their prior familiarity with the technology and its functionalities, indicating that users’ existing knowledge can influence their perceptions of new systems.
In the specific context of BYOD adoption within healthcare environments, the relevance of EE becomes even more pronounced. Healthcare professionals often operate under intense pressure, managing critical tasks that require efficiency and quick decision-making. Therefore, any perceived complexity associated with new technologies or a steep learning curve can significantly hinder their adoption. This reality highlights the necessity of developing BYOD systems that prioritize user-friendliness and can be easily incorporated into daily routines. Thus, it is essential to develop user-friendly BYOD systems that fit seamlessly into daily routines, promoting smoother adoption and enhancing efficiency in healthcare settings. The EE was measured with four questions that focused on the intention to adopt BYOD. Thus, the hypothesis of this research on the impact of the EE on behavioural intention among Pakistani doctors is:
Social influence (SI) refers to how significant others’ opinions can influence the individual’s behaviour regarding new technology [101]. Recent studies emphasize that SI, shaped by peer influence, organizational culture, and societal norms, significantly impacts behavioral intention to adopt new technologies. SI is described as the extent to which a users’ decision is affected by others’ perceptions [93]. The construct of SI in the UTAUT model adopted from the TRA, TAM2, TPB/DTPB, and C-TAM-TPB; social factors (MPCU); and image (IDT) [62]. Previous research has shown [33] revealed that SI significantly influenced health professionals’ acceptance of mobile-based clinical guideline applications in resource-limited settings, highlighting the importance of colleagues and organizational culture in driving adoption. Similarly, studies by [11], and [31] explored the adoption of BI systems, blockchain, AI-driven healthcare services, and EHR systems, demonstrating that SI is a critical enabler for fostering acceptance, especially in environments requiring collaboration and teamwork. Additional research by [2] and [50] further reinforces that SI significantly drives adoption through peer recommendations and shared expectations. While studies like [90] suggest that SI may have limited impact in more autonomous professions, such as healthcare and military settings, they acknowledge that SI can complement other factors such as performance expectancy and facilitating conditions in promoting adoption. A study by [81] found that SI significantly influenced emergency information systems. However, several findings have concluded that because of context, respondents traits, and the technologies investigated, SI did not affect behavioural intention in the healthcare context [92]. The disagreement in the literature about the effect of SI on behavioural intention in healthcare helps this research investigate its significance among Pakistani doctors. These findings collectively justify the inclusion of SI as a predictor in BYOD adoption research, as it captures the influence of peer dynamics, leadership endorsement, and organizational culture in encouraging the acceptance and integration of personal devices in healthcare workflows.
The SI was measured with three questions that focused on the intention to adopt BYOD. The hypothesis is as follows:
Facilitating Conditions (FC) are consistently identified as a significant predictor of behavioral intention and technology adoption in UTAUT-based studies. FC refers to the availability of organizational and technical resources, including IT support, infrastructure, and policies, that enable users to adopt and effectively use a technology [101]. Studies such as [11] and [31] highlight the importance of FC in healthcare, demonstrating that robust IT systems and accessible resources significantly enhance the adoption of BI systems and blockchain technology. Similarly, [50] found that FC strongly influences both behavioral intention and actual use of Wi-Fi systems among medical students, indicating the critical role of a supportive environment in fostering technology use.
In resource-constrained settings, [75] showed that FC is essential for the adoption of EHR systems by healthcare professionals, emphasizing that technical support and infrastructure are pivotal in overcoming barriers. Studies like [110] also affirm that FC plays a vital role in BYOD adoption. Facilitating Conditions (FC) are crucial for predicting behavioral intention and technology adoption, particularly in healthcare. Research on the hospital’s technical support and training substantially impacted HIS’s adoption [18, 38]. Research indicates that strong FC enhances the adoption of technologies like business intelligence systems, blockchain, electronic health records (EHR), and Bring Your Own Device (BYOD) practices. Studies show that supportive environments significantly influence technology use among medical professionals and students, helping them overcome barriers and effectively integrate personal devices into their workflows. These findings collectively underscore that facilitating conditions are critical for the successful adoption of BYOD in healthcare, where robust IT support, clear policies, and training programs can help professionals overcome technical challenges and ensure efficient use of personal devices in their workflows. The FC measured with three questions that focused on the intention to adopt BYOD. Hypothesis for FC is:
The Perceived Vulnerability (PV) is the user’s opinion about the probability that the threat will appear [65]. PV plays a significant role in influencing compliance behaviors within BYOD practices, largely through the process of threat appraisal. Research conducted by [97] explores BYOD security compliance through the lens of Protection Motivation Theory (PMT), identifying threat and coping appraisals as key predictors of compliance intentions. The study also highlights additional factors, such as mixed device usage and the visibility of company surveillance. Similarly, [4] investigate how perceived vulnerability, response efficacy, and subjective norms affect protective behaviors in BYOD environments. They suggest targeted interventions aimed at strengthening security practices among employees. Both studies emphasize that awareness of potential risks is a strong predictor of compliance intentions and protective behaviors, underscoring the necessity of enhancing risk awareness to promote secure practice. Additionally, [76] connect perceived vulnerability to security awareness and risk perception within their threat appraisal framework. Their study focuses on BYOD compliance in the public sector, establishing relationships between security behaviors and essential factors like policy clarity, self-efficacy, and psychological ownership, while emphasizing the critical role of training and support.
Individuals who believe their information system resources are vulnerable to an information system attack are more likely to take preventive measures [48]. Employees are vigilant about whether their data is secure, mainly using their own devices for work tasks. Hence, personal privacy and data confidentiality for using their mobile device is the most critical concerns [21]. In this context, it is possible to disclose employees’ private details to an unapproved entity. If employees think his/her data security is not assured, it will stop them from accepting BYOD. The PV measured with three questions; the researcher proposed the following hypothesis:
Perceived Severity (PS) refers to the degree of threat from unhealthy behaviours [84]. PS is observed as the degree to which a consumer thinks that risk impacts on his/her device would be dangerous [95]. However, there are different outcomes in the personal computing domain context [74]. If an employee uses his/her device instead of the company computer, the user’s security risk can be a significant problem.
Perceived severity is a significant component of threat appraisal that influences compliance behaviors in Bring Your Own Device (BYOD) practices by highlighting the potential consequences of security breaches. Tu et al. [97] incorporated perceived severity into their Protection Motivation Theory (PMT) framework, demonstrating its influence on compliance intentions alongside other relevant factors. Similarly, [4] identified it as a crucial determinant of behavioral intentions in BYOD environments. In general, users considering adopting BYOD may act differently based on their PS [113], the PV measured with three questions. Consequently, the researcher proposed the following hypothesis.
Response Cost (RC) which refers to the perceived effort, inconvenience, individuals’ costs when required to introduce a security policy safeguard measure, or time required to engage in protective behaviors, is vital for compliance with BYOD [115, 117]. It covers the costs of taking adaptive coping measures, like resources, time, commitment, inconvenience, complexity, comprehension, or other negative impacts on adopting the BYOD security plan [24]. If the expenses surpass the benefits, it is unlikely that the consumer will attempt any coping action [98]. RC applies to the costs affiliated with practising defensive behaviour. It has demonstrated a crucial part in personal computing, such that changes in perceived RC adversely affect intentions to implement security behaviours [95].
Moreover, [97] recognized response cost as a barrier to compliance intentions within the coping appraisal framework of Protection Motivation Theory (PMT). Al-Harthy and Ali [4] further supported this notion by showing that employees are less inclined to adopt protective behaviors when they perceive the effort as high, advocating for security measures that are user-friendly to foster compliance. When RC is high, individuals will be less likely to engage in a given protective behavior [96]. RC was found to negatively affect adopting anti-plagiarism software [65], BYOD practices [29] and online security behaviours [96]. Posey, Roberts & Lowry explained RC as perceived drawbacks such as expenses, disruptions, difficulties and likely adverse effects that users could incur [80].
Contrary to previous studies’ findings, if a person agrees that the proposed preventive behaviour is appropriate, the cost of responding is justified [106]. A study by showed that the RC to mobile device users has no substantial impact on defending their device from data violations [44]. The study by [76] suggests that when organizational policies are clear and well-supported, the perceived effort or difficulty associated with compliance—conceptualized as response cost—is likely reduced. By streamlining processes and minimizing complexity, organizations can foster an environment where employees are more inclined to adhere to BYOD security measures, thereby enhancing overall compliance and security outcomes. If consumers of devices are assured in their self-efficacy against security attacks, RC would not significantly impact their defensive behaviour. Thus, the RC was measured with three questions; the researcher proposed that:
Self-Efficacy (SE) is an individual’s confidence in their capability to present behaviour [24]. It originated from the social cognitive theory, which alluded to an individual’s belief in responding. However, according to social cognitive theory, people with stronger self-confidence in their skills can begin challenging behaviours. An individual’s belief in his or her skills to complete a behaviour has positively influenced the mobile health system [117]. Alhelaly et al. [10] underscored the significance of self-efficacy as a vital factor in protection motivation, illustrating its role in mitigating privacy concerns and promoting compliance with BYOD policies. Similarly, [97] incorporated self-efficacy into their PMT framework, demonstrating that heightened self-efficacy enhances employees’ coping abilities and strengthens their commitment to security measures. Al-Harthy and Ali [4] highlighted self-efficacy as a key determinant of behavioral intentions and protective behaviors in BYOD contexts, emphasizing the necessity of confidence-building strategies. These studies illustrate the critical importance of self-efficacy in BYOD security practices, urging organizations to prioritize the development of employee confidence through comprehensive training, robust support, and clear policies. Crossler, Long, Loraas, & Trinkle examined the factors determining whether employees follow BYOD policies through the PMT lens. They found that SE of BYOD is the salient factor for adopting BYOD policy [28].
Besides, the results obtained from several studies of PMT showed that SE might be the powerful predictor of intention to adopt preventative measures [112]. SE signifies an individual’s ability to perform protection behavior [52]. By contrast, another study suggested the insignificant effects of SE [34]. Therefore, further empirical evidence is required for an improved understanding of this issue. In this research, SE refers to an individual’s ability to implement security measures specified by a security policy to reduce the risk posed by BYOD adoption. Also, it can influence one’s desire to accept BYOD, such as belief and desire to improve the adoption of mhealth, thus enhancing the overall attitude towards BYOD. Therefore, the SE was measured with four questions that focused on the intention to adopt BYOD. We propose the following hypothesis:
Generally, different people have different perceptions about a particular aspect, or they understand and associate it uniquely based on their distinctive attributes, such as age, gender, preferences and experiences [47]. A moderator variable is a third variable affecting the relationship between the dependent and independent variables [85]. Within the study’s contemporary context, two moderators were examined, age and gender.
Age moderated the relationship between performance expectancy, effort expectancy, social influence, facilitating conditions and behavioural intention. Elderly consumers tend to have more problems understanding new or complicated information, affecting their learning of new technologies [102]. In previous technology adopted research, age was assumed as a moderator. However, the influence depended on context, and results were not consistent across different settings. Research revealed that elderly individuals are less willing to adopt e-health technologies [32]. However, research in a healthcare setting, age did not significantly influence healthcare professionals’ willingness to accept Health Information System (HIS). Research revealed that elderly individuals are less willing to adopt e-health technologies [32]. However, research in a healthcare setting, age did not significantly influence healthcare professionals’ willingness to accept HIS. The effect of age on technology adoption has been well examined in a commercial context, but a lack of studies apply to healthcare settings [73]. The current study hypothesized the effect of age as the following:
H9: Age will moderate the relationship between performance expectancy, effort expectancy, social influence and facilitating conditions on the intention to adopt BYOD
Gender is vital while examining performance expectancy, effort expectancy, social influence, facilitating conditions on BI [102]. Studies examining the role of gender indicate how personality characteristics and gender variation are essential to understanding and using emerging technologies. The role of gender cannot be ignored in the evaluation of the acceptance of technology. The original UTAUT model investigated gender as a moderator and found its significant impact on the relationship between facilitating conditions to intention to adopt [101]. Another study also found that females are less interested and likely to adopt e-health technology [32]. To evaluate the impact of gender as a moderator on the relationship between facilitating conditions and intention to adopt the hypothesis is:
H10: Gender will moderate the relationship between performance expectancy, effort expectancy, social influence and facilitating conditions on the intention to adopt BYOD. The 08 main research hypotheses and 02 moderator hypotheses are summarized in Table 1 in a tabular format; the hybrid research model is also presented in Fig. 4.
ING announced today that, as part of our €2.0 billion share buyback programme announced on 2 May 2025, in total 4,239,000 shares were repurchased during the week of 6 October 2025 up to and including 10 October 2025.
The shares were repurchased at an average price of €21.32 for a total amount of €90,367,787.70. For detailed information on the daily repurchased shares, individual share purchase transactions and weekly reports, see share buy back programme.
In line with the purpose of the programme to reduce the share capital of ING, the total number of shares repurchased under this programme to date is 92,123,891 at an average price of €19.67 for a total consideration of €1,811,927,494.72. To date approximately 90.60% of the maximum total value of the share buyback programme has been completed.
Note for editors
More on investor information, go to the investor relations section on this site.
For news updates, go to the newsroom on this site or via X (@ING_news feed).
For ING photos such as board members, buildings, go to Flickr.
ING PROFILE
ING is a global financial institution with a strong European base, offering banking services through its operating company ING Bank. The purpose of ING Bank is: empowering people to stay a step ahead in life and in business. ING Bank’s more than 60,000 employees offer retail and wholesale banking services to customers in over 100 countries.
ING Group shares are listed on the exchanges of Amsterdam (INGA NA, INGA.AS), Brussels and on the New York Stock Exchange (ADRs: ING US, ING.N).
ING aims to put sustainability at the heart of what we do. Our policies and actions are assessed by independent research and ratings providers, which give updates on them annually. ING’s ESG rating by MSCI was reconfirmed by MSCI as ‘AA’ in August 2024 for the fifth year. As of December 2023, in Sustainalytics’ view, ING’s management of ESG material risk is ‘Strong’. Our current ESG Risk Rating, is 17.2 (Low Risk). ING Group shares are also included in major sustainability and ESG index products of leading providers. Here are some examples: Euronext, STOXX, Morningstar and FTSE Russell. Society is transitioning to a low-carbon economy. So are our clients, and so is ING. We finance a lot of sustainable activities, but we still finance more that’s not. Follow our progress on ing.com/climate.
Important legal information
Elements of this press release contain or may contain information about ING Groep N.V. and/ or ING Bank N.V. within the meaning of Article 7(1) to (4) of EU Regulation No 596/2014 (‘Market Abuse Regulation’).
ING Group’s annual accounts are prepared in accordance with International Financial Reporting Standards as adopted by the European Union (‘IFRS- EU’). In preparing the financial information in this document, except as described otherwise, the same accounting principles are applied as in the 2024 ING Group consolidated annual accounts. All figures in this document are unaudited. Small differences are possible in the tables due to rounding.
Certain of the statements contained herein are not historical facts, including, without limitation, certain statements made of future expectations and other forward-looking statements that are based on management’s current views and assumptions and involve known and unknown risks and uncertainties that could cause actual results, performance or events to differ materially from those expressed or implied in such statements. Actual results, performance or events may differ materially from those in such statements due to a number of factors, including, without limitation: (1) changes in general economic conditions and customer behaviour, in particular economic conditions in ING’s core markets, including changes affecting currency exchange rates and the regional and global economic impact of the invasion of Russia into Ukraine and related international response measures (2) changes affecting interest rate levels (3) any default of a major market participant and related market disruption (4) changes in performance of financial markets, including in Europe and developing markets (5) fiscal uncertainty in Europe and the United States (6) discontinuation of or changes in ‘benchmark’ indices (7) inflation and deflation in our principal markets (8) changes in conditions in the credit and capital markets generally, including changes in borrower and counterparty creditworthiness (9) failures of banks falling under the scope of state compensation schemes (10) non- compliance with or changes in laws and regulations, including those concerning financial services, financial economic crimes and tax laws, and the interpretation and application thereof (11) geopolitical risks, political instabilities and policies and actions of governmental and regulatory authorities, including in connection with the invasion of Russia into Ukraine and the related international response measures (12) legal and regulatory risks in certain countries with less developed legal and regulatory frameworks (13) prudential supervision and regulations, including in relation to stress tests and regulatory restrictions on dividends and distributions (also among members of the group) (14) ING’s ability to meet minimum capital and other prudential regulatory requirements (15) changes in regulation of US commodities and derivatives businesses of ING and its customers (16) application of bank recovery and resolution regimes, including write down and conversion powers in relation to our securities (17) outcome of current and future litigation, enforcement proceedings, investigations or other regulatory actions, including claims by customers or stakeholders who feel misled or treated unfairly, and other conduct issues (18) changes in tax laws and regulations and risks of non-compliance or investigation in connection with tax laws, including FATCA (19) operational and IT risks, such as system disruptions or failures, breaches of security, cyber-attacks, human error, changes in operational practices or inadequate controls including in respect of third parties with which we do business and including any risks as a result of incomplete, inaccurate, or otherwise flawed outputs from the algorithms and data sets utilized in artificial intelligence (20) risks and challenges related to cybercrime including the effects of cyberattacks and changes in legislation and regulation related to cybersecurity and data privacy, including such risks and challenges as a consequence of the use of emerging technologies, such as advanced forms of artificial intelligence and quantum computing (21) changes in general competitive factors, including ability to increase or maintain market share (22) inability to protect our intellectual property and infringement claims by third parties (23) inability of counterparties to meet financial obligations or ability to enforce rights against such counterparties (24) changes in credit ratings (25) business, operational, regulatory, reputation, transition and other risks and challenges in connection with climate change, diversity, equity and inclusion and other ESG-related matters, including data gathering and reporting and also including managing the conflicting laws and requirements of governments, regulators and authorities with respect to these topics (26) inability to attract and retain key personnel (27) future liabilities under defined benefit retirement plans (28) failure to manage business risks, including in connection with use of models, use of derivatives, or maintaining appropriate policies and guidelines (29) changes in capital and credit markets, including interbank funding, as well as customer deposits, which provide the liquidity and capital required to fund our operations, and (30) the other risks and uncertainties detailed in the most recent annual report of ING Groep N.V. (including the Risk Factors contained therein) and ING’s more recent disclosures, including press releases, which are available on www.ING.com.
This document may contain ESG-related material that has been prepared by ING on the basis of publicly available information, internally developed data and other third-party sources believed to be reliable. ING has not sought to independently verify information obtained from public and third-party sources and makes no representations or warranties as to accuracy, completeness, reasonableness or reliability of such information. Materiality, as used in the context of ESG, is distinct from, and should not be confused with, such term as defined in the Market Abuse Regulation or as defined for Securities and Exchange Commission (‘SEC’) reporting purposes. Any issues identified as material for purposes of ESG in this document are therefore not necessarily material as defined in the Market Abuse Regulation or for SEC reporting purposes. In addition, there is currently no single, globally recognized set of accepted definitions in assessing whether activities are “green” or “sustainable.” Without limiting any of the statements contained herein, we make no representation or warranty as to whether any of our securities constitutes a green or sustainable security or conforms to present or future investor expectations or objectives for green or sustainable investing. For information on characteristics of a security, use of proceeds, a description of applicable project(s) and/or any other relevant information, please reference the offering documents for such security.
This document may contain inactive textual addresses to internet websites operated by us and third parties. Reference to such websites is made for information purposes only, and information found at such websites is not incorporated by reference into this document. ING does not make any representation or warranty with respect to the accuracy or completeness of, or take any responsibility for, any information found at any websites operated by third parties. ING specifically disclaims any liability with respect to any information found at websites operated by third parties. ING cannot guarantee that websites operated by third parties remain available following the publication of this document, or that any information found at such websites will not change following the filing of this document. Many of those factors are beyond ING’s control.
Any forward-looking statements made by or on behalf of ING speak only as of the date they are made, and ING assumes no obligation to publicly update or revise any forward-looking statements, whether as a result of new information or for any other reason.
This document does not constitute an offer to sell, or a solicitation of an offer to purchase, any securities in the United States or any other jurisdiction.
a Refer to bp’s second quarter and half year 2025 group results announcement and bp.com for full text.
b Underlying effective tax rate is sensitive to a range of factors, including the volatility of the price environment and its impact on the geographical mix of the group’s profits and losses.*
* See Glossary.
Glossary
Capital expenditure is total cash capital expenditure as stated in the condensed group cash flow statement. Capital expenditure for the operating segments, gas & low carbon energy businesses and customers & products businesses is presented on the same basis.
Replacement cost (RC) profit or loss reflects the replacement cost of inventories sold in the period and is calculated as profit or loss attributable to bp shareholders, adjusting for inventory holding gains and losses (net of tax). RC profit or loss for the group is a non-IFRS measure. The nearest equivalent measure on an IFRS basis is profit or loss attributable to bp shareholders.
Refining indicator margin (RIM) is a simple indicator of the weighted average of bp’s crude slate and product yield as deemed representative for each refinery. Actual margins realized by bp may vary due to a variety of factors, including the actual mix of a crude and product for a given quarter.
Technical service contract (TSC) – Technical service contract is an arrangement through which an oil and gas company bears the risks and costs of exploration, development and production. In return, the oil and gas company receives entitlement to variable physical volumes of hydrocarbons, representing recovery of the costs incurred and a profit margin which reflects incremental production added to the oilfield.
Underlying production – 2025 underlying production, when compared with 2024, is production after adjusting for acquisitions and divestments, curtailments, and entitlement impacts in our production-sharing agreements/contracts and technical service contract*.
Underlying RC profit or loss before interest and tax for the operating segments or customers & products businesses is a non-IFRS measure and is calculated as RC profit or loss including profit or loss attributable to non-controlling interests before interest and tax for the operating segments and excluding net adjusting items for the respective operating segment or business. The nearest equivalent measure on an IFRS basis for segments and businesses is RC profit or loss before interest and taxation.
Underlying effective tax rate (ETR) is a non-IFRS measure. The underlying ETR is calculated by dividing taxation on an underlying replacement cost (RC) basis by underlying RC profit or loss before tax. Taxation on an underlying RC basis for the group is calculated as taxation as stated on the group income statement adjusted for taxation on inventory holding gains and losses and total taxation on adjusting items. Information on underlying RC profit or loss is provided below. Taxation on an underlying RC basis presented for the operating segments is calculated through an allocation of taxation on an underlying RC basis to each segment. bp believes it is helpful to disclose the underlying ETR because this measure may help investors to understand and evaluate, in the same manner as management, the underlying trends in bp’s operational performance on a comparable basis, period on period. Taxation on an underlying RC basis and underlying ETR are non-IFRS measures. The nearest equivalent measure on an IFRS basis is the ETR on profit or loss for the period.