Category: 3. Business

  • EBRD and donors support inclusive and sustainable growth in Bosnia and Herzegovina

    EBRD and donors support inclusive and sustainable growth in Bosnia and Herzegovina

    • EBRD providing three loans totalling €4 million to Intesa Sanpaolo Banka Bosnia and Herzegovina
    • Loans will improve access to green finance and support youth- and women-led businesses
    • Package of loans will promote inclusive and sustainable growth

    The European Bank for Reconstruction and Development (EBRD) is providing three loans totalling €4 million to Intesa Sanpaolo Banka Bosnia and Herzegovina to encourage green investments in the residential sector, boost youth entrepreneurship and support women-led businesses in Bosnia and Herzegovina. This package of loans comprises the following:

    • A €2 million loan under the Western Balkans Green Economy Financing Facility (GEFF)*: This loan will be lent on to the residential sector, supporting access to finance for energy-saving investments. Beneficiaries will include individual residents, housing collectives, housing management companies, service providers, producers and vendors of green technologies and materials, construction companies and the public sector. Eligible sub-borrowers will be able to receive incentive grants totalling up to 20 per cent of their sub-loans from the European Union (EU) on successful completion of their projects, with technical assistance funded by Japan and the EU supporting effective implementation.
    • A €1 million loan under the Western Balkans Youth in Business programme: This loan will be lent on to eligible youth-led or -owned micro, small and medium-sized enterprises (MSMEs). This transaction aims to facilitate financial inclusion for young people in Bosnia and Herzegovina, improving access to finance for MSMEs owned or led by young people, which often face barriers on account of factors such as insufficient collateral, limited credit history or lack of business experience.
    • A €1 million loan under Phase II of the Western Balkans Women in Business programme: This loan will be lent on to eligible women-led MSMEs, seeking to foster women’s entrepreneurship and encourage broader participation in business by enhancing women-led MSMEs’ access to finance and know-how.

    In addition to providing finance, the Women in Business and Youth in Business programmes also engage with young business owners and managers, giving them access to tailored advisory services that help them develop new skills, improve the performance of their businesses and unlock new growth opportunities. This advisory support is backed by the EU and the governments of Sweden (through the Swedish International Development Cooperation Agency), Luxembourg and Italy (through the Central European Initiative).

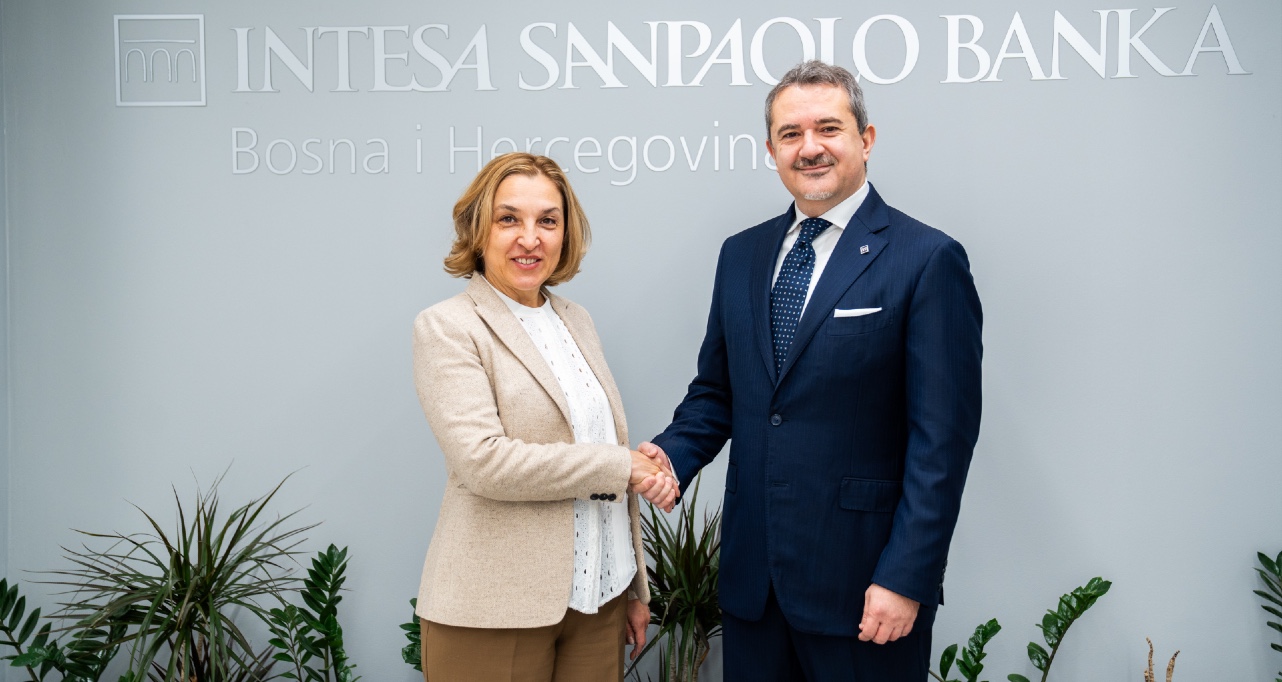
    The loan agreements were signed by Stela Melnic, the EBRD’s Director of Bosnia and Herzegovina, Michele Castoro, President of the Management Board of Intesa Sanpaolo Banka, and Minja Filipović, a member of the Management Board.

    Stela Melnic said: “We are proud to be expanding our support for inclusive and green finance in Bosnia and Herzegovina. These loans to Intesa Sanpaolo Banka underline our commitment to empowering women and young entrepreneurs, while accelerating the green transition and fostering sustainable growth across the country.”

    Michele Castoro added: “This partnership with the EBRD represents another important step in strengthening our role as a driver of positive change in Bosnia and Herzegovina. Through these new loan facilities, we can further support investments in energy efficiency, as well as young and women-led businesses that are shaping the future of our economy. We value the continued trust placed in our bank and remain committed to delivering sustainable impact and meaningful opportunities for our clients and communities.”

    Intesa Sanpaolo Banka Bosnia and Herzegovina is the fifth largest bank in Bosnia and Herzegovina. With headquarters in Sarajevo, it services the entirety of the country through electronic channels and a network of 43 branches.

    The EBRD’s Women in Business and Youth in Business programmes are supported by the EU, the Austrian Federal Ministry of Finance and bilateral donors to the Western Balkans Investment Framework (WBIF) and are implemented in partnership with the Energy Community Secretariat.

    The EBRD has invested €3.4 billion across 254 projects in Bosnia and Herzegovina since it began operating there in 1996. The Bank’s strategic priorities in the country are to promote the green economy, support the competitive development of the private sector and foster regional integration.

    * The EBRD’s Western Balkans GEFF is co-funded by the EU (through the WBIF), Austria, Japan and Denmark, as well as Austria and Switzerland through the EBRD’s High-Impact Partnership on Climate Action (HIPCA)**.
    ** HIPCA is supported by Austria, Canada, Finland, Germany, the Netherlands, South Korea, Spain, Switzerland, the TaiwanICDF, the United Kingdom and the United States of America.

    Continue Reading

  • Japan raises interest rates to highest level in 30 years

    Japan raises interest rates to highest level in 30 years

    Unlock the Editor’s Digest for free

    Japan’s benchmark government bond yields hit their highest level since 1999 after the central bank pushed up short-term interest rates to address rising prices and wages.

    The Bank of Japan raised its policy rate by 0.25 percentage points to “around 0.75 per cent”, a three-decade high, and signalled its readiness to continue monetary tightening if conditions are right.

    The rate increase, a unanimous decision by the bank’s Policy Board, was the fourth under governor Kazuo Ueda, continuing a “normalisation” process he launched last year.

    The rate is the highest since 1995 as Japan emerges from decades when it maintained an ultra-loose monetary policy to try to fight deflation.

    Despite the prospect of further rate increases, the yen weakened against the dollar following the BoJ’s move.

    Traders said the move reflected market concerns around Japan’s fiscal situation under Prime Minister Sanae Takaichi, who took office in October and has proposed expansive spending plans.

    Some content could not load. Check your internet connection or browser settings.

    In a press conference Ueda said the new 0.75 per cent interest rate level was still “far from the bottom” of the central bank’s estimated range for the “neutral rate” — the level where monetary policy is neither expansionary nor contractionary.

    “Our estimate on Japan’s neutral rate sits on a pretty wide range. It’s hard to set a pinpoint estimate . . . We’d ​like to look at how the economy and prices react to each change in short-term rate,” said Ueda.

    Friday’s rate rise was widely anticipated after what traders said was unusually clear messaging ahead of the decision. A less telegraphed rate increase in July 2024 caused severe market ructions.

    Hiroshi Shiraishi, senior economist at BNP Paribas in Tokyo, said Ueda had raised market expectations earlier in the month that he might be more explicit about BoJ estimates of the neutral rate. “In the event, he didn’t really say anything very new: he didn’t want to sound too hawkish and upset the government, or sound too dovish and cause the yen to fall . . . the market reaction is exactly as expected,” said Shiraishi.

    The yield on the benchmark 10-year Japanese government bond climbed 0.05 percentage points, breaking through 2 per cent and reaching the highest level since 1999. Bond yields move inversely to prices.

    Line chart of 10-year JGB yield showing Japanese 10-year bond yields hit highest level since 1999

    Yields on JGBs had already risen to multiyear highs in recent weeks, driven by anticipation of the BoJ’s move and investor concerns that Japan’s fiscal position will be stretched by Takaichi’s spending plans.

    The yen weakened to ¥156.77 against the dollar.

    Andrew Pease, Asia-Pacific head of investments for Russell Investments, said the yen’s move was “a puzzle” but could suggest the market was potentially “worried about the fiscal dynamics in Japan”.

    The market “is underestimating the potential for the Bank of Japan to tighten more aggressively next year”, Pease added.

    Shoki Omori, chief desk strategist at Mizuho, said: “There was some disappointment in the market that the BoJ’s statement was not more hawkish, but the central bank does seem to have handled this very smoothly this time.”

    He added that by remaining vague on the neutral rate, the BoJ appeared to have struck a balance to prevent markets from unduly front-running further rate increases. “It is therefore appropriate to characterise the current posture as hawkish in action and moderate in communication,” said Omori.

    The BoJ statement noted that labour conditions in Japan, where the population is shrinking, continued to be tight, while corporate profits were expected to remain strong despite the impact of tariff policies.

    The central bank said companies were “highly likely” to keep raising wages next year and that prices would continue to rise moderately.

    Those conditions justified the adjustment of monetary policy, it said, a move that some economists judged to be at odds with Takaichi’s sweeping economic stimulus plans.

    The BoJ observed that “real interest rates are expected to remain significantly negative after the change in the policy interest rate, and accommodative financial conditions will continue to firmly support economic activity”.

    Headline consumer price inflation has been above the BoJ’s target level of 2 per cent for more than three years, driven by the yen’s weakness and Japan’s dependence on imports of food and energy. Official data on Friday showed consumer prices excluding fresh food rose 3 per cent in November from a year earlier.

    Additional reporting by William Sandlund and data visualisation by Haohsiang Ko in Hong Kong

    Continue Reading

  • Updated framework for contributions post-retirement

    This framework recognises continued contributions of former staff members after retirement in support of CERN’s mission

    The framework for former staff members active over retirement age has been updated to recognise continued contributions and clarify roles and expectations for all involved.

    The Retired Contributing Staff (RETC) status has been in place since 2021, following proposals from a CERN-wide working group. Based on the positive experience over the past years, with many important contributions from our colleagues, the Directorate has decided to extend this scheme, and to change the name to Honorary Associates. The conditions and process initially established for the RETC status will continue to apply, and a specific contribution remains a prerequisite for obtaining and maintaining the status. More details are available in the admin eguide.

    Another proposal of the CERN-wide working group was the creation of the Emeritus (EMER) title, to recognise exceptional contributions of former staff members to the Organization. A first list has been compiled by the Directorate, based on input from the departments and in line with a framework endorsed by the Enlarged Directorate. It recognises former staff members who were founders of the LEP and LHC experiments, former Directors-General, former Directors with long and impactful careers at CERN and former CERN staff with particular global impact and visibility. The list can be found here.  

    The aim is for the list of Emeriti to be reviewed by the CERN Management on a regular basis, and to evolve to reflect CERN’s legacy of excellence and impact.

    This framework is complementary to the CERN Alumni network. It strengthens the connection between CERN and former staff members, and supports the transfer of the CERN mission, legacy and values to the next generations.  

    Continue Reading

  • Abbott, J. J., Diller, E. & Petruska, A. J. Magnetic methods in robotics. Annu. Rev. Control Robot Auton. Syst. 3, 57–90 (2020).

    Google Scholar 

  • Chen, X. Z. et al. Recent developments in magnetically driven micro- and nanorobots. Appl. Mater. Today. 9, 37–48 (2017).

    Google Scholar 

  • Xiao, Y., Zhang, J., Fang, B., Zhao, X. & Hao, N. Acoustics-Actuated Microrobots Micromachines 13, 481 (2022).

    Google Scholar 

  • Kim, H. & Kim, M. J. Electric field control of Bacteria-Powered microrobots using a static obstacle avoidance algorithm. IEEE Trans. Robot. 32, 125–137 (2016).

    Google Scholar 

  • Nelson, B. J., Kaliakatsos, I. K. & Abbott, J. J. Microrobots for minimally invasive medicine. Annu. Rev. Biomed. Eng. 12, 55–85 (2010).

    Google Scholar 

  • Doutel, E. & Galindo-Rosales, F. J. Campo-Deaño, L. Hemodynamics challenges for the navigation of medical microbots for the treatment of CVDs. Materials 14, 7402 (2021).

    Google Scholar 

  • Hu, M. et al. Micro/Nanorobot: A promising targeted drug delivery system. Pharmaceutics 12, 665 (2020).

    Google Scholar 

  • Jang, D., Jeong, J., Song, H. & Chung, S. K. Targeted drug delivery technology using untethered microrobots: a review. J. Micromech Microeng. 29, 053002 (2019).

    Google Scholar 

  • Yang, M. et al. Swarming magnetic nanorobots bio-interfaced by heparinoid-polymer brushes for in vivo safe synergistic thrombolysis. Sci. Adv. 9, eadk7251 (2023).

    Google Scholar 

  • Wang, S. et al. Accelerating thrombolysis using a precision and clot-penetrating drug delivery strategy by nanoparticle-shelled microbubbles. Sci. Adv. 6, eaaz8204 (2020).

    Google Scholar 

  • Lai, S. K. et al. Rapid transport of large polymeric nanoparticles in fresh undiluted human mucus. Proc. Natl. Acad. Sci. U.S.A. 104, 1482–1487 (2007).

  • Aghakhani, A. et al. High shear rate propulsion of acoustic microrobots in complex biological fluids. Sci. Adv. 8, eabm5126 (2022).

    Google Scholar 

  • Walker, D., Käsdorf, B. T., Jeong, H. H., Lieleg, O. & Fischer, P. Enzymatically active biomimetic micropropellers for the penetration of mucin gels. Sci. Adv. 1, e1500501 (2015).

    Google Scholar 

  • Tasci, T. O., Herson, P. S., Neeves, K. B. & Marr, D. W. M. Surface-enabled propulsion and control of colloidal microwheels. Nat. Commun. 7, 10225 (2016).

    Google Scholar 

  • Zimmermann, C. J., Herson, P. S., Neeves, K. B. & Marr, D. W. M. Multimodal microwheel swarms for targeting in three-dimensional networks. Sci. Rep. 12, 5078 (2022).

    Google Scholar 

  • Ishiki, A. K., Neeves, K. B. & Marr, D. W. M. Reversible microwheel translation induced by polymer depletion. Langmuir 39, 15547–15552 (2023).

    Google Scholar 

  • Wolvington, E., Yeager, L., Gao, Y., Zimmermann, C. J. & Marr, D. W. M. Paddlebots: translation of rotating colloidal assemblies near an Air/Water interface. Langmuir 39, 7846–7851 (2023).

    Google Scholar 

  • Tasci, T. O. et al. Enhanced fibrinolysis with magnetically powered colloidal microwheels. Small 13, 1700954 (2017).

    Google Scholar 

  • Disharoon, D., Trewyn, B. G., Herson, P. S., Marr, D. W. M. & Neeves, K. B. Breaking the fibrinolytic speed limit with microwheel co-delivery of tissue plasminogen activator and plasminogen. J. Thromb. Haemost. 20, 486–497 (2022).

    Google Scholar 

  • Pontius, M. H. H. et al. Magnetically powered microwheel thrombolysis of occlusive thrombi in zebrafish. Proc. Natl. Acad. Sci. U.S.A. 121, e2315083121 (2024).

  • Osmond, M. J. et al. Micrometer-scale tPA beads amplify plasmin generation for enhanced thrombolytic therapy. Bioeng. Transla Med. e70012 (2025). https://doi.org/10.1002/btm2.70012

  • Ota, S. & Takemura, Y. Characterization of Néel and brownian relaxations isolated from complex dynamics influenced by dipole interactions in magnetic nanoparticles. J. Phys. Chem. C. 123, 28859–28866 (2019).

    Google Scholar 

  • Joshi, R., Jadhao, M. & Ghosh, S. K. Recent trends in the applications of nanocomposites in cancer theranostics. Green. Sustainable Process. Chem. Environ. Eng. Sci. (Elsevier), 283–320. https://doi.org/10.1016/B978-0-323-95169-2.00011-0 (2023).

  • Koleoso, M. et al. Micro/nanoscale magnetic robots for biomedical applications. Mater. Today Bio.. 8, 100085 (2020).

    Google Scholar 

  • Rajan, A. & Sahu, N. K. Review on magnetic nanoparticle-mediated hyperthermia for cancer therapy. J. Nanopart. Res. 22, 319 (2020).

    Google Scholar 

  • Park, J., Jin, C., Lee, S., Kim, J. & Choi, H. Magnetically actuated degradable microrobots for actively controlled drug release and hyperthermia therapy. Adv. Healthc. Mater. 8, 1900213 (2019).

    Google Scholar 

  • Landers, F. C. et al. On-Command disassembly of microrobotic superstructures for transport and delivery of magnetic micromachines. Adv. Mater. 36, 2310084 (2024).

    Google Scholar 

  • Rajabimashhadi, Z., Gallo, N., Salvatore, L. & Lionetto, F. Collagen derived from fish industry waste: progresses and challenges. Polymers 15, 544 (2023).

    Google Scholar 

  • Wagner, C. E., Wheeler, K. M. & Ribbeck, K. Mucins and their role in shaping the functions of mucus barriers. Annu. Rev. Cell. Dev. Biol. 34, 189–215 (2018).

    Google Scholar 

  • Korson, L., Drost-Hansen, W. & Millero, F. J. Viscosity of water at various temperatures. J. Phys. Chem. 73, 34–39 (1969).

    Google Scholar 

  • Kol, R. et al. Toward more universal prediction of polymer solution viscosity for Solvent-Based recycling. Ind. Eng. Chem. Res. 61, 10999–11011 (2022).

    Google Scholar 

  • Al-Shammari, B., Al-Fariss, T., Al-Sewailm, F. & Elleithy, R. The effect of polymer concentration and temperature on the rheological behavior of metallocene linear low density polyethylene (mLLDPE) solutions. J. King Saud Univ. – Eng. Sci. 23, 9–14 (2011).

    Google Scholar 

  • Harding, S. E. The intrinsic viscosity of biological macromolecules. Progress in measurement, interpretation and application to structure in dilute solution. Prog. Biophys. Mol. Biol. 68, 207–262 (1997).

    Google Scholar 

  • de la García, J. & Hernández Cifre, J. G. Hydrodynamic properties of biomacromolecules and macromolecular complexes: concepts and Methods. A tutorial Mini-review. J. Mol. Biol. 432, 2930–2948 (2020).

    Google Scholar 

  • Liu, M., Zhang, J., Shan, W. & Huang, Y. Developments of mucus penetrating nanoparticles. Asian J. Pharm. Sci. 10, 275–282 (2015).

    Google Scholar 

  • Ponchel, G. Specific and non-specific bioadhesive particulate systems for oral delivery to the Gastrointestinal tract. Adv. Drug Deliv. Rev. 34, 191–219 (1998).

    Google Scholar 

  • Hanlon, D. F., Clouter, M. J. & Andrews, G. T. Temperature dependence of the viscoelastic properties of a natural gastropod mucus by Brillouin light scattering spectroscopy. Soft. Matter.. 19, 8101–8111 (2023).

    Google Scholar 

  • Çinar, Y. Blood viscosity and blood pressure: role of temperature and hyperglycemia. Am. J. Hypertens. 14, 433–438 (2001).

    Google Scholar 

  • Hasnain, S. et al. Knee synovial fluid flow and heat transfer, a power law model. Sci. Rep. 13, 18184 (2023).

    Google Scholar 

  • Penconek, A., Michalczuk, U., Sienkiewicz, A. & Moskal, A. The effect of desert dust particles on rheological properties of saliva and mucus. Environ. Sci. Pollut Res. 26, 12150–12157 (2019).

    Google Scholar 

  • Gavilán, H. et al. Magnetic nanoparticles and clusters for magnetic hyperthermia: optimizing their heat performance and developing combinatorial therapies to tackle cancer. Chem. Soc. Rev. 50, 11614–11667 (2021).

    Google Scholar 

  • Fonnum, G., Johansson, C., Molteberg, A., Mørup, S. & Aksnes, E. Characterisation of Dynabeads® by magnetization measurements and Mössbauer spectroscopy. J. Magn. Magn. Mater. 293, 41–47 (2005).

    Google Scholar 

  • Shah, R. R. et al. Determining iron oxide nanoparticle heating efficiency and elucidating local nanoparticle temperature for application in agarose gel-based tumor model. Mater. Sci. Engineering: C. 68, 18–29 (2016).

    Google Scholar 

  • Liu, X. et al. Comprehensive Understanding of magnetic hyperthermia for improving antitumor therapeutic efficacy. Theranostics 10, 3793–3815 (2020).

    Google Scholar 

  • Johannsen, M. et al. Clinical hyperthermia of prostate cancer using magnetic nanoparticles: presentation of a new interstitial technique. Int. J. Hyperth. 21, 637–647 (2005).

    Google Scholar 

  • Kouzoudis, D., Samourgkanidis, G., Kolokithas-Ntoukas, A., Zoppellaro, G. & Spiliotopoulos, K. Magnetic hyperthermia in the 400–1,100 kHz frequency range using mions of condensed colloidal nanocrystal clusters. Front. Mater. 8, 638019 (2021).

    Google Scholar 

  • Lai, S. K., Wang, Y. Y., Wirtz, D. & Hanes, J. Micro- and macrorheology of mucus. Adv. Drug Deliv. Rev. 61, 86–100 (2009).

    Google Scholar 

  • Yang, L. & Zhang, L. Motion control in magnetic microrobotics: from individual and multiple robots to swarms. Annu. Rev. Control Robot Auton. Syst. 4, 509–534 (2021).

    Google Scholar 

  • Seneterre, E., Paganin, F., Bruel, J., Michel, F. & Bousquet, J. Measurement of the internal size of bronchi using high resolution computed tomography (HRCT). Eur. Respir J. 7, 596–600 (1994).

    Google Scholar 

  • Bosetti, F. et al. Small Blood Vessels: Big Health Problems? Scientific Recommendations of the National Institutes of Health Workshop. JAHA 5, e004389 (2016).

  • Cunha, L. H. P. et al. Slow relaxation dynamics of superparamagnetic colloidal beads in time-varying fields. Phys. Rev. Mater. 8, 105601 (2024).

    Google Scholar 

  • Erb, R. M., Martin, J. J., Soheilian, R., Pan, C. & Barber, J. R. Actuating soft matter with magnetic torque. Adv. Funct. Mater. 26, 3859–3880 (2016).

    Google Scholar 

  • Kanwal, R. P. Slow rotatory motion of a circular disk about one of its diameters in a viscous fluid. J. Appl. Mech. 26, 485–487 (1959).

    Google Scholar 

  • Bird, R. B., Stewart, W. E. & Lightfoot, E. N. Transport Phenomena (Wiley, 2002).

  • Jeffery, G. B. On the steady rotation of a solid of revolution in a viscous fluid. Proc. Lond. Math. Soc. s2_14, 327–338 (1915).

    Google Scholar 

  • Tanzosh, J. P. & Stone, H. A. Transverse motion of a disk through a rotating viscous fluid. J. Fluid Mech. 301, 295–324 (1995).

    Google Scholar 

  • Martínez-Padilla, L. P. Rheology of liquid foods under shear flow conditions: recently used models. J. Texture Stud. 55, e12802 (2024).

    Google Scholar 

  • Serio, F. et al. Co-loading of doxorubicin and iron oxide nanocubes in Polycaprolactone fibers for combining Magneto-Thermal and chemotherapeutic effects on cancer cells. J. Colloid Interface Sci. 607, 34–44 (2022).

    Google Scholar 

  • Zimmermann, C. J. et al. Delivery and actuation of aerosolized microbots. Nano Select Nano. 202100353 https://doi.org/10.1002/nano.202100353 (2022).

  • Balsamo, R., Lanata, L. & Egan, C. G. Mucoactive drugs. Eur. Respir Rev. 19, 127–133 (2010).

    Google Scholar 

  • Andreu, I. & Natividad, E. Accuracy of available methods for quantifying the heat power generation of nanoparticles for magnetic hyperthermia. Int. J. Hyperth. 29, 739–751 (2013).

    Google Scholar 

  • Deatsch, A. E. & Evans, E. E. Heating efficiency in magnetic nanoparticle hyperthermia. J. Magn. Magn. Mater. 354, 163–172 (2014).

    Google Scholar 

  • Zimmermann, C. czimm79/MuControl: v1.1.1 – DOI generation. Zenodo https://doi.org/10.5281/ZENODO.5793922 (2021).

    Google Scholar 

Continue Reading

  • Gold, Silver Both Drop in Pakistan After Global Price Correction

    Gold, Silver Both Drop in Pakistan After Global Price Correction

    Gold lost ground in Pakistan on Friday as a pullback in international prices dragged the local market lower, while silver also retreated after its recent record run.

    In the domestic market, the price of gold per tola fell by Rs. 900 during the day to close at Rs. 454,862. The rate for 10-gram gold slipped by Rs. 772 to Rs. 389,970, according to figures shared by the All-Pakistan Gems and Jewellers Sarafa Association (APGJSA).

    A day earlier, on Thursday, gold had settled at Rs. 455,762 per tola after a rise of Rs. 2,200 during the session.

    In the international market, the price of gold declined by $9 to $4,325 per ounce (including a premium of $20).

    Silver also went down, with the price per tola dropping by Rs. 52 to Rs. 6,848 in the local market.


    Continue Reading

  • Euro area monthly balance of payments: October 2025

    Nicht auf Deutsch verfügbar.

    19 December 2025

    • Current account recorded €26 billion surplus in October 2025, up from €24 billion in previous month
    • Current account surplus amounted to €313 billion (2.0% of euro area GDP) in the 12 months to October 2025, down from €419 billion (2.8%) one year earlier
    • In financial account, euro area residents’ net acquisitions of non-euro area portfolio investment securities totalled €829 billion and non-residents’ net acquisitions of euro area portfolio investment securities totalled €780 billion in the 12 months to October 2025

    Chart 1

    Euro area current account balance

    (EUR billions unless otherwise indicated; working day and seasonally adjusted data)

    Source: ECB.

    The current account of the euro area recorded a surplus of €26 billion in October 2025, an increase of €2 billion from the previous month (Chart 1 and Table 1). Surpluses were recorded for goods (€31 billion) and services (€13 billion). Deficits were recorded for secondary income (€16 billion) and primary income (€3 billion).

    Table 1

    Current account of the euro area

    (EUR billions unless otherwise indicated; transactions; working day and seasonally adjusted data)

    Source: ECB.

    Note: Discrepancies between totals and their components may be due to rounding.

    Data for the current account of the euro area

    In the 12 months to October 2025, the current account recorded a surplus of €313 billion (2.0% of euro area GDP), compared with a surplus of €419 billion (2.8% of euro area GDP) one year earlier. This decrease was mainly driven by a switch from a surplus (€50 billion) to a deficit (€21 billion) for primary income, but also by a reduction in the surplus for services (down from €175 billion to €152 billion) and a larger deficit for secondary income (up from €166 billion to €188 billion). These developments were partly offset by larger surplus for goods (up from €360 billion to €370 billion).

    Chart 2

    Selected items of the euro area financial account

    (EUR billions; 12-month cumulated data)

    Source: ECB.

    Notes: For assets, a positive (negative) number indicates net purchases (sales) of non-euro area instruments by euro area investors. For liabilities, a positive (negative) number indicates net sales (purchases) of euro area instruments by non-euro area investors.

    In direct investment, euro area residents made net investments of €162 billion in non-euro area assets in the 12 months to October 2025, following net disinvestments of €118 billion one year earlier (Chart 2 and Table 2). Non-residents invested €74 billion in net terms in euro area assets in the 12 months to October 2025, following net disinvestments of €370 billion one year earlier.

    In portfolio investment, euro area residents’ net purchases of non-euro area equity amounted to €160 billion in the 12 months to October 2025, down from €218 billion one year earlier. Over the same period, net purchases of non-euro area debt securities by euro-area residents increased to €669 billion, up from €477 billion one year earlier. Non-residents’ net purchases of euro area equity increased to €431 billion in the 12 months to October 2025, up from €388 billion one year earlier. Over the same period, non-residents made net purchases of euro area debt securities amounting to €348 billion, declining from €417 billion one year earlier.

    Table 2

    Financial account of the euro area

    (EUR billions unless otherwise indicated; transactions; non-working day and non-seasonally adjusted data)

    Source: ECB.

    Notes: Decreases in assets and liabilities are shown with a minus sign. Net financial derivatives are reported under assets. “MFIs” stands for monetary financial institutions. Discrepancies between totals and their components may be due to rounding.

    Data for the financial account of the euro area

    In other investment, euro area residents recorded net acquisitions of non-euro area assets amounting to €562 billion in the 12 months to October 2025 (up from €342 billion one year earlier), while their net incurrence of liabilities was €443 billion (following net disposals of €35 billion one year earlier).

    Chart 3

    Monetary presentation of the balance of payments

    (EUR billions; 12-month cumulated data)

    Source: ECB.

    Notes: “MFI net external assets (enhanced)” incorporates an adjustment to the MFI net external assets (as reported in the consolidated MFI balance sheet items statistics) based on information on MFI long-term liabilities held by non-residents, available in b.o.p. statistics. B.o.p. transactions refer only to transactions of non-MFI residents of the euro area. Financial transactions are shown as liabilities net of assets. “Other” includes financial derivatives and statistical discrepancies.

    The monetary presentation of the balance of payments (Chart 3) shows that the net external assets (enhanced) of euro area MFIs increased by €230 billion in the 12 months to October 2025. This increase was driven by the current and capital accounts surplus and euro area non-MFIs’ net inflows in portfolio investment equity and other investment. These developments were partly offset by euro area non-MFIs’ net outflows in other flows, portfolio investment debt and direct investment.

    In October 2025, the Eurosystem’s stock of reserve assets increased to €1,709.8 billion up from €1,622.2 billion in the previous month (Table 3). This increase was mostly driven by positive price changes (€82.8 billion), due to an increase in the price of gold, and, to a lesser extent, by positive exchange rate changes (€4.0 billion) and net acquisitions of assets (€0.8 billion).

    Table 3

    Reserve assets of the euro area

    (EUR billions; amounts outstanding at the end of the period, flows during the period; non-working day and non-seasonally adjusted data)

    Source: ECB.

    Notes: “Other reserve assets” comprises currency and deposits, securities, financial derivatives (net) and other claims. Discrepancies between totals and their components may be due to rounding.

    Data for the reserve assets of the euro area

    Data revisions

    This press release includes revisions to the seasonally and working-day adjusted current account and its components from January 2013 onwards owing to the incorporation of newly estimated seasonal and working-day factors. These revisions did not significantly alter the figures previously published.

    Next releases:

    • Quarterly balance of payments: 13 January 2026 (reference data up to the third quarter of 2025)
    • Monthly balance of payments: 20 January 2026 (reference data up to November 2025)

    For media queries, please contact Benoît Deeg, tel.: +49 172 1683704.

    Notes

    • Current account data are always seasonally and working day-adjusted, unless otherwise indicated, whereas capital and financial account data are neither seasonally nor working day-adjusted.
    • Hyperlinks in this press release lead to data that may change with subsequent releases as a result of revisions.

    Continue Reading

  • Sandvik wins large order for battery-electric mining equipment in Canada

    Sandvik has received a large order for battery-electric vehicles (BEVs) from the Canada-based mining company Eldorado Gold, to be used at its Lamaque mine in Val-d’Or, Québec. The order is valued at around SEK 160 million and was booked in the fourth quarter of 2025.

    The order includes battery-electric trucks and loaders and follows a SEK 65 million BEV order from Eldorado Gold booked in the third quarter. Deliveries are expected to begin mid-2026 and continue into 2027. With the new orders, the fleet of Sandvik BEVs at the Lamaque mine will grow from two to 12 units.

    “Sandvik BEVs have proven their capability underground at Lamaque, and this order confirms the strength of our battery-electric offering. We are proud to expand our partnership with Eldorado Gold and support their strategy to strengthen efficiency, safety and sustainability in their mining operations,” says Mats Eriksson, President of business area Mining at Sandvik.

    Stockholm, December 19, 2025
    Sandvik AB

    For further information, contact Louise Tjeder, VP Investor relations, phone: +46 (0) 70782 6374 or Johannes Hellström, Press and Media Relations Manager, phone: +46 (0) 70721 1008

    Sandvik wins large order for battery-electric mining equipment in Canada (PDF)

    Continue Reading

  • Greater flexibility to be given for setting future contactless limits

    Banks and payment providers with strong fraud controls will be able to set their own limit for contactless payments, allowing them to better respond to changing consumer demands, inflation and new technology. They are also being encouraged to let customers set their own limit, or turn contactless off altogether, as many high street banks already do.  

    People are using contactless as the go-to way to pay. Research by Barclays found that almost 95% of all eligible in-store card transactions were contactless in 2024. 

    Banks and payment providers must have strong fraud controls when processing contactless transactions. The greater flexibility will incentivise firms to step up their fraud prevention, giving consumers greater protection and peace of mind. 

    Crucially, existing consumer protections remain in place. Consumers must be reimbursed in unauthorised fraud cases, such as if their card is lost or stolen. 

    David Geale, executive director of payments and digital finance at the FCA, said: 

    ‘Contactless is people’s favoured way to pay. We want to make sure our rules provide flexibility for the future, and choice for both firms and consumers.’

    Kate Nicholls, chair of UKHospitality, said:  

    ‘Making life easier for consumers is a positive for any hospitality and high street business, and I’m pleased the FCA is bringing forward this change. 

    ‘Contactless has increasingly become the preferred payment method of choice for many people and lifting the limit can mean quicker and easier experiences for consumers. While many people still prefer to use cash or chip and PIN, this change adds much-needed flexibility for providers and consumers.’

    The new standards follow a public discussion and consultation around contactless payments, and how to make paying more convenient for consumers, while supporting growth. This work is one of around 50 measures that the regulator outlined in a letter to the Prime Minister in January to support economic growth and prioritise digital solutions.

    The rule changes take effect in March 2026, after which it will be up to firms if and when they take up the greater flexibility to change any contactless limits. Those that do, will need to communicate the changes clearly to their customers. 

    Notes to editors

    1. In line with the Consumer Duty, firms will need to communicate any contactless limit changes to consumers.
    2. Based on industry feedback, the FCA understands that most banks and payment service providers are likely to maintain their existing contactless limits for the foreseeable future, even after the changes come in.
    3. The FCA enables a fair and thriving financial services market for the good of consumers and the economy. Find out more about the FCA. 

    Continue Reading

  • Getting around North East Lincolnshire this Christmas and New Year

    Getting around North East Lincolnshire this Christmas and New Year

    If you’re using public transport this year, make sure to read the below so you know exactly when and where everything is running.

    Stagecoach

    Monday 22 December & Tuesday 23 December

    Normal weekday journeys will run on the following services:

    3, 4 Morrisons to Cleethorpes Pier

    5, 5S Grimsby to Immingham

    5M Grimsby to Catch Training Centre

    45 Cleethorpes and Grimsby to Immingham

    9, 10 Hewitts Circus to Grimsby and Waltham

    Saturday journeys will run on the following services:

    1, 2 Victor Street and Grimsby to Europarc

    6 Wybers Wood and Grimsby to Cleethorpes

    7 Grimsby to Hewitts Circus

    8 Grimsby to Scartho and Cleethorpes

    11 Grimsby to Bradley Park and New Waltham

    12 Grimsby and Cleethorpes to Waltham

    20 Cleethorpes and Grimsby to Europarc

    53 Grimsby to Lincoln

    250 Grimsby to Hull 251 Grimsby to Louth

    251 Grimsby to Louth

    CHRISTMAS EVE Wednesday 24 December.

    Normal Wednesday journeys will run on the following services:

    5, 5S Grimsby to Immingham

    5M Grimsby to Catch Training Centre

    45 Cleethorpes and Grimsby to Immingham

    9, 10 Hewitts Circus to Grimsby and Waltham

    Except, some services will ­finish early.

    The last bus that will run is:

    9 Waltham to North Sea Lane               19:05

    9 North Sea Lane to Waltham               19:12

    10 Waltham to Hewitts Circus                19:35

    10 Hewitts Circus to Waltham               19:35

    45 Immingham to Cleethorpes Pier      19:50

    45 Cleethorpes Pier to Immingham      20:04

    Saturday journeys will run on the following services:

    1, 2 Victor Street and Grimsby to Europarc

    3, 4 Morrisons to Cleethorpes Pier

    6 Wybers Wood and Grimsby to Cleethorpes

    7 Grimsby to Hewitts Circus

    8 Grimsby to Scartho and Cleethorpes

    11 Grimsby to Bradley Park and New Waltham

    12 Grimsby and Cleethorpes to Waltham

    20 Cleethorpes and Grimsby to Europarc

    53 Grimsby to Lincoln

    250 Grimsby to Hull

    251 Grimsby to Louth

    An additional morning journey will run as follows:

    3 Morrisons to Cleethorpes Pier                           05:00

    Except, some services will ­finish early.

    The last bus that will run is:

    3 Morrisons to Cleethorpes Pier                           19:15 

    3 Cleethorpes Pier to Morrisons                           19:35

    4 Laceby Village to Cleethorpes Pier                   19:45

    4 Cleethorpes Pier to Laceby Village                   19:55

    8 Grimsby to Cleethorpes Pier                              19:25

    8 Cleethorpes Pier to Grimsby                              19:45

    20 Wybers Way to Cleethorpes Pier                    18:08

    250 Grimsby to Hull                                                 17:30

    250 Grimsby to Barton only                                   18:30*

    250 Hull to Grimsby                                                 19:45

    251 Grimsby to Louth                                              20:00

    251 Louth to Grimsby                                              20:00

    *Passengers wishing to continue to Hull should transfer onto the 2000 Service 350 from Barton to Hull.

    CHRISTMAS DAY Thursday 25 December.

    No bus services will run.

    BOXING DAY Friday 26 December.

    No bus services will run.

    Saturday 27 December & Sunday 28 December .

    Normal bus services will run.

    Monday 29 December & Tuesday 30 December.

    A Saturday service will run except for the following which will run a normal weekday service:

    5, 5S Grimsby to Immingham

    5M Grimsby to Catch Training Centre

    45 Cleethorpes and Grimsby to Immingham

    9, 10 Hewitts Circus to Grimsby and Waltham

    An additional morning journey will run as follows:

    3 Morrisons to Cleethorpes Pier                           05:00

    NEW YEAR’S EVE Wednesday 31 December.

    See Christmas Eve.

    NEW YEAR’S DAY Thursday 1 January 2026.

    No bus services will run.

    Friday 2 January 2026.

    Will run the same service level as 29th and 30th December.

    Normal services will resume from Saturday 3 January 2026.

    Local Stagecoach info 0345 241 8000

    Christmas and New Year Customer Service opening times

    0800 to 1800……….. Monday 22 December

    0800 to 1800……….. Tuesday 23 December

     0800 to 1700 ……….Christmas Eve

    Closed…………………Christmas Day

    Closed ……………….  Boxing Day

    0900 to 1700……….. Saturday 27 December

    0900 to 1700……….. Sunday 28 December

    0800 to 1800……….. Monday 29 December

    0800 to 1800……….. Tuesday 30 December

    0800 to 1700 ………..New Year’s Eve

    Closed…………………New Year’s Day

    0900 to 1700……….. Friday 2 January

    Normal opening hours from Saturday 3 January

    Contact

    [email protected]

    @StagecoachEMid

    stagecoachbus.com/christmas-in-emid

    Phone ‘n’ Ride

    • 22 December from 6:30am to 6:30pm
    • 23 December from 6:30am to 6:30pm
    • 24 December from 7:30am to 5:30pm
    • 25 December – CLOSED
    • 26 December – CLOSED
    • 27 December from 6:30am to 6:30pm
    • 28 December – CLOSED
    • 29 December from 7:30am to 5:30pm
    • 30 December from 7:30am to 5:30pm
    • 31 December from 7:30am to 5:30pm
    • 1 January 2026 – CLOSED
    • 2 January from 6:30am to 6:30pm

    Dial a Ride

    The office will be closed from 23/12/2025 to 05/01/2026 No bookings can be made between these times. Should passengers require a trip over the Christmas and New Year period, they will need to book at least 2-3 weeks in advance.

    TransPennine Express

    Wednesday 24th December

    • Last services from Manchester Piccadilly to Cleethorpes – 18:57
    • Last Services from Liverpool Lime Street to Cleethorpes – 17:56
    • Last Services from Cleethorpes to Liverpool Lime Street – 17:26
    • Last Services from Cleethorpes to Sheffield – 18:26

    Thursday 25th and Friday 26th December.

    No TransPennine Express services will run on either Christmas Day or Boxing Day.

    Saturday 27th December.

    Services will start later with a reduced frequency on many routes.

    Customer travelling over the festive and New Year period are advise the plan their journeys in advance by visiting www.TPExpress.co.uk.

    East Midlands Railway

    Wednesday 24th December

    EMR trains run on Christmas Eve, but services will finish earlier than normal. The last trains usually depart between 7-9pm, depending on your route.

    Thursday 25th and Friday 26th December

    No services will run on either Christmas Day or Boxing Day.

    Saturday 27th December

    EMR services resume on 27th December, although a revised timetable may be in place. Some routes may be affected by engineering works, and trains may be less frequent than usual or start slightly later.

    Wednesday 31 December

    Due to New Years Eve early shutdown, EMR Regional will be running a reduced timetable in the evening.

    Thursday 1st January 2026

    Trains do run on New Years Day but may start later and run less frequently

    Customer travelling over the festive and new Year period are advise the plan their journeys in advance by visiting www.eastmidlandsrailway.co.uk.

    Age UK

    Grimsby Office – Closed Wednesday 24th December to Sunday 28th December re-opens Monday 29th  to Wednesday 31st December 10.00am to 2.00pm. Closed 1st January 26 re-opens as normal from Friday 2nd January 26.

    Cleethorpes Office –  Closed Wednesday 24th December to Monday 5th January 26.

    NELC are not responsible for inaccurate information.  Please check with the service provider before traveling.

    Continue Reading

  • ECB wage tracker suggests lower wage growth and gradual normalisation of negotiated wage pressures in 2026

    ECB wage tracker suggests lower wage growth and gradual normalisation of negotiated wage pressures in 2026

    19 December 2025

    • ECB wage tracker updated with wage agreements signed up to end of November 2025; forward-looking horizon extended to end of December 2026
    • Forward-looking information indicates easing of negotiated wage growth, consistent with data published following October 2025 Governing Council meeting
    • ECB wage tracker with unsmoothed one-off payments at 3.0% in 2025 and 2.7% in 2026

    The European Central Bank (ECB) wage tracker, which covers active collective bargaining agreements, indicates negotiated wage growth with smoothed one-off payments of 3.2% in 2025 (based on a coverage of 49.5% of employees in participating countries) and 2.3% in 2026 (based on a coverage of 28.8%). The ECB wage tracker with unsmoothed one-off payments indicates negotiated wage growth of 3.0% in 2025 and 2.7% in 2026. The wage tracker excluding one-off payments indicates an easing of negotiated wage growth from 3.9% in 2025 to 2.6% in 2026. The headline ECB wage tracker is better suited to describing quarterly or monthly dynamics in negotiated wages as it smoothens one-off payments over time. Meanwhile, the ECB wage tracker with unsmoothed one-off payments is better suited to describing yearly dynamics, ensuring that one-off payments are not smoothed twice when constructing the yearly outcomes.

    For 2026, the headline ECB wage tracker stands at 2.0% in the first quarter, 2.1% in the second quarter, 2.5% in the third quarter and 2.7% in the fourth quarter. The rise in the wage path over the course of the year is related to the dissipation of the mechanical downward effect of large one-off payments that were made in 2024 but not in 2025. The ECB wage tracker also suggests that there is less dispersion in negotiated wage pressures across the different euro area countries in 2026 in comparison with previous years.

    The ECB wage tracker with unsmoothed one-off payments (3.1% in the first quarter, 2.5% in the second quarter, 2.4% in the third quarter and 2.7% in the fourth quarter) also reflects the more stable and less volatile outlook in negotiated wage growth for 2026 in comparison with previous years. The wage tracker excluding one-off payments stands at 2.8% in the first quarter, 2.6% in the second quarter, 2.5% in the third quarter and 2.7% in the fourth quarter, which also suggests more moderate negotiated wage dynamics than in previous years. The employee coverage in 2026 stands at 36.9% in the first quarter, 30.1% in the second quarter, 24.8% in the third quarter and 23.4% in the fourth quarter. See Chart 1 and Table 1 for further details.

    Since the previous data release in November 2025, the ECB wage tracker has been expanded to retroactively include collective agreements in Finland from January 2015 onwards. The forward-looking horizon has been extended to the end of December 2026, providing some initial insights for the full year.

    Overall, the ECB wage tracker may be subject to revisions, and the forward-looking component should not be interpreted as a forecast, as it only captures the information that is currently available for active collective bargaining agreements. Moreover, the ECB wage tracker does not track the indicator of negotiated wage growth precisely and deviations are to be expected over time. For a more comprehensive assessment of wage developments in the euro area, please refer to the December 2025 Eurosystem staff macroeconomic projections for the euro area, which indicate a yearly growth rate of compensation per employee in the euro area of 4.0% in 2025 and 3.2% in 2026.

    The ECB publishes four wage tracker indicators for the aggregate of nine participating euro area countries on the ECB Data Portal.

    Chart 1

    ECB wage tracker: forward-looking signals for negotiated wages and revisions to previous data release

    Indicators between January 2024 and December 2026

    Revisions to previous data release

    (left-hand scale: yearly growth rates, percentages; right-hand scale: percentage share of employees)

    (percentage points)

    Sources: ECB calculations based on data provided by the Nationale Bank van België/Banque Nationale de Belgique, the Belgian Federal Public Service Employment, Labour and Social Dialogue, the Belgian National Social Security Office, the Deutsche Bundesbank, the Bank of Greece, the Banco de España, the Banque de France, the Banca d’Italia, the Dutch employers’ association AWVN, the Oesterreichische Nationalbank, Suomen Pankki – Finlands Bank, Elinkeinoelämän keskusliitto, Tilastokeskus and Eurostat. The indicator of negotiated wage growth is calculated using data from the Belgian Federal Public Service Employment, Labour and Social Dialogue, the Deutsche Bundesbank, the Ministerio de Empleo y Seguridad Social, the Banque de France, the Istituto Nazionale di Statistica (ISTAT), the Centraal Bureau voor de Statistiek, Statistik Austria, Tilastokeskus, Haver Analytics and Eurostat.

    Notes: Dashed lines denote forward-looking information (which is not yet available for the indicator of negotiated wage growth). The latest observations are for December 2026 for the ECB wage tracker indicators (left panel), September 2025 for the indicator of negotiated wage growth (left panel) and September 2026 for the revisions to the previous data release (right panel).

    What do the four different indicators show?

    • The headline ECB wage tracker is a tracker of negotiated wage growth that includes collectively agreed one-off payments, such as those related to inflation compensation, bonuses or back-dated pay, which are smoothed over 12 months.
    • The ECB wage tracker excluding one-off payments reflects the extent of structural (or permanent) negotiated wage increases.
    • The ECB wage tracker with unsmoothed one-off payments is constructed using a methodology that, in terms of both data sources and statistical methodology, is conceptually similar to, but not necessarily the same as, that used for the ECB indicator of negotiated wage growth.
    • The share of employees covered is the percentage of employees across the participating countries that are directly covered by ECB wage tracker data. This indicator provides information on the representativeness of the underlying (negotiated) wage growth signals obtained from the set of wage tracker indicators for the aggregate of the participating countries. Employee coverage differs across countries and within each country over time (more details can be found in Table 2).

    Table 1

    ECB wage tracker summary

    (percentages)

    ECB wage tracker

    Coverage

    Headline indicator

    With unsmoothed one-off payments

    Excluding one-off payments

    Share of employees (%)

    2013-24

    2.2

    2.3

    2.1

    49.5

    2025

    3.2

    3.0

    3.9

    49.5

    2026

    2.3

    2.7

    2.6

    28.8

    Q1 2025

    4.7

    2.7

    4.5

    49.7

    Q2 2025

    4.0

    4.1

    4.3

    49.9

    Q3 2025

    2.3

    2.1

    3.5

    49.4

    October 2025

    2.0

    3.1

    3.3

    48.9

    November 2025

    1.8

    3.0

    3.1

    48.8

    December 2025

    1.9

    3.4

    3.1

    48.7

    January 2026

    1.8

    2.9

    2.9

    38.5

    February 2026

    2.1

    3.6

    2.8

    36.2

    March 2026

    2.1

    2.7

    2.7

    36.0

    Q2 2026

    2.1

    2.5

    2.6

    30.1

    Q3 2026

    2.5

    2.4

    2.5

    24.8

    Q4 2026

    2.7

    2.7

    2.7

    23.4

    Sources: ECB calculations based on data provided by the Nationale Bank van België/Banque Nationale de Belgique, the Belgian Federal Public Service Employment, Labour and Social Dialogue, the Belgian National Social Security Office, the Deutsche Bundesbank, the Bank of Greece, the Banco de España, the Banque de France, the Banca d’Italia, the Dutch employers’ association AWVN, the Oesterreichische Nationalbank, Suomen Pankki – Finlands Bank, Elinkeinoelämän keskusliitto, Tilastokeskus and Eurostat.
    Notes: ECB wage tracker indicators reflect yearly growth in negotiated wages as a percentage. Coverage is defined as the share of employees in participating countries as a percentage. Rows with values in italics and bold refer to the forward-looking aspect of the respective indicators. Data are subject to revisions.

    Table 2

    Employee coverage by country

    (share of employees in each country, percentages)

    Belgium

    Germany

    Greece

    Spain

    France

    Italy

    Netherlands

    Austria

    Finland

    Euro area

    2013-24

    37.6

    42.5

    10.7

    62.3

    52.1

    48.7

    64.1

    60.6

    66.3

    49.5

    Q1 2025

    44.7

    45.0

    19.2

    47.3

    56.2

    47.4

    62.2

    77.6

    62.5

    49.7

    Q2 2025

    44.9

    46.0

    16.7

    47.3

    56.0

    47.7

    61.8

    76.6

    62.6

    49.9

    Q3 2025

    44.7

    45.9

    10.3

    46.7

    55.5

    47.6

    61.4

    76.0

    62.7

    49.4

    Q4 2025

    44.7

    45.7

    10.3

    46.3

    53.7

    47.3

    61.2

    75.0

    62.4

    48.8

    Q1 2026

    44.9

    40.9

    10.1

    17.5

    29.9

    46.0

    55.1

    53.9

    62.2

    36.9

    Q2 2026

    44.8

    34.4

    9.9

    12.6

    13.9

    44.9

    53.0

    40.8

    61.9

    30.1

    Q3 2026

    44.8

    26.5

    9.8

    6.6

    9.3

    44.8

    40.9

    35.0

    59.3

    24.8

    Q4 2026

    44.7

    25.9

    9.8

    3.7

    2.6

    43.8

    37.7

    33.9

    57.1

    23.4

    Sources: ECB calculations based on data provided by the Nationale Bank van België/Banque Nationale de Belgique, the Belgian Federal Public Service Employment, Labour and Social Dialogue, the Belgian National Social Security Office, the Deutsche Bundesbank, the Bank of Greece, the Banco de España, the Banque de France, the Banca d’Italia, the Dutch employers’ association AWVN, the Oesterreichische Nationalbank, Suomen Pankki – Finlands Bank, Elinkeinoelämän keskusliitto, Tilastokeskus and Eurostat.
    Notes: The euro area aggregate comprises the nine participating wage tracker countries. The coverage shows the relative strength of wage signals for each country and the euro area. The historical average is calculated from January 2015 for Finland, January 2016 for Greece and February 2020 for Austria. For the other countries, it is calculated from January 2013 to December 2024. Rows with values in italics and bold refer to the forward-looking aspect of the indicator. Data are subject to revisions.

    For media queries, please contact Benoit Deeg, tel.: +491721683704

    Notes

    • The ECB wage tracker is the result of a Eurosystem partnership currently comprising the European Central Bank and nine euro area national central banks: the Nationale Bank van België/Banque Nationale de Belgique, the Deutsche Bundesbank, the Bank of Greece, the Banco de España, the Banque de France, the Banca d’Italia, De Nederlandsche Bank, the Oesterreichische Nationalbank and Suomen Pankki – Finlands Bank. It is based on a highly granular database of active collective bargaining agreements for Belgium, Germany, Greece, Spain, France, Italy, the Netherlands, Austria and Finland. The wage tracker can be used to help assess wage pressures in the euro area.
    • The wage tracker methodology uses a double aggregation approach. First, it aggregates the highly granular information on collective bargaining agreements and constructs the wage tracker indicators at the country level using information on the employee coverage within each country. Second, it uses this information to construct the aggregate for the euro area using time-varying weights based on the total compensation of employees among the participating countries.
    • Given that the forward-looking nature of the tracker is dependent on the underlying collective bargaining agreements database, the wage signals should always be considered conditional on the information available at any given point in time and thus subject to revisions. This is particularly relevant at the turn of the year as many agreements are signed or renewed in the first quarter in some countries.
    • The results in this press release do not represent the views of the ECB’s decision-making bodies.

    Continue Reading