The news:Jeff Bezos is returning to an operational role for the first time since stepping down as CEO from Amazon in 2021. His new startup—Project Prometheus—launched with $6.2 billion in funding, instantly making it one of the best-capitalized early-stage AI companies, per The New York Times.
Project Prometheus has hired almost 100 employees, including talent from OpenAI, DeepMind, and Meta. It’s focused on “physical AI”—where systems learn from real-world experimentation—for engineering and manufacturing across computers, humanoid robots, and aerospace and automotive industries.
Bezos is co-CEO of the company, marking a high-stakes return to building and scaling tech from the inside. The other CEO is Vik Bajaj, who previously led moonshot projects at Google X, including early work on Wing drones and Waymo self-driving cars.
Why it’s worth watching:Bezos fronting a new AI company outside of Amazon is a significant departure from his retail, cloud, and Amazon Web Services (AWS) infrastructure roots. Building it as a startup, rather than a subsidiary, doesn’t muddle Amazon’s bottom line and insulates Project Prometheus from investor expectations.
Project Prometheus solutions will feed into Bezos’ interests without directly competing with OpenAI, Meta, or Google AI releases.
AI shifts: Prometheus is leading a new wave of startups moving past large language models (LLMs) and into physical AI. Here are a couple of the other players:
Periodic Labs is building robot-driven research facilities with an investment of $300 million to pursue autonomous labs, smart robots, and AI-driven discovery to reshape physical science and accelerate R&D.
Thinking Machines Lab raised $2 billion to build scientific AI tools for research, engineering applications, and specialized business solutions rather than a one-size-fits-all mode.
Prometheus dwarfs both in funding—an early signal of its intent and expected scale of production for its AI tools.
What this means for brands: Companies like Project Prometheus will shorten product cycles, streamline supply chains, and accelerate breakthroughs in aerospace, automotive, and computing—delivering faster, cheaper results with clear ROIs.
Brands should watch how physical AI reshapes manufacturing and R&D. The next competitive edge will come from using AI to prototype new products, automate factory intelligence, and bring ideas to market with unprecedented speed.
This content is part of EMARKETER’s subscription Briefings, where we pair daily updates with data and analysis from forecasts and research reports. Our Briefings prepare you to start your day informed, to provide critical insights in an important meeting, and to understand the context of what’s happening in your industry. Non-clients can click here to get a demo of our full platform and coverage.
(PRO Views are exclusive to PRO subscribers, giving them insight on the news of the day direct from a real investing pro. See the full discussion above.) Nvidia’s quarterly report this week is the biggest catalyst to watch in the current “bend but don’t break kind of market,” New York Stock Exchange insider Jay Woods tells traders. Nvidia — set to report after the bell on Wednesday — is expected to inform Wall Street on the strength of the artificial intelligence trade moving forward, particularly with the tech-heavy Nasdaq Composite on track to snap a seven-month win streak. The chipmaker’s results come at a time when investors are questioning sky-high valuations tied to major technology stocks and wondering how long the AI-powered bull market rally will last. Questions about the depreciation cycles of Nvidia’s GPUs are also getting louder. “We all know one thing and one thing is only on traders’ mind this week and that’s one earnings — it’s Nvidia,” said Woods, chief market strategist at Freedom Capital Markets. “It’s not hyperbole, it is the most important earnings of the year. Why? Because it’s almost 8% of the S & P 500. It’s in the Dow Jones Industrial average. It’s part of the Nasdaq-100, roughly 10% … so, Nvidia’s gonna move markets.” Nvidia also holds a huge weight in big technology-focused exchange traded funds, the VanEck Semiconductor ETF (SMH) and the Technology Select Sector SPDR ETF (XLK) he noted. Woods is watching to see if Nvidia can hold above the $185 level. The stock last closed at $190.17 but traded around $186 per share on Monday. Shares of the company are up more than 38% year to date but have slid nearly 8% this month. “What do we want? We’re watching technically 185. This seems to be the level. We broke above it, ran to almost $212, and then we failed,” Woods said. “Everyone’s talking about AI, the spend, the valuations. Jensen Huang’s gonna give us a little peek as to how things are going. And as Nvidia goes, the rest of the market should go.” NVDA 1Y mountain Nvidia stock performance over the past year. (Watch full video above.) What else Woods is watching this week: September’s nonfarm payrolls report expected Thursday, which would be the first economic data release following the record-setting U.S. government shutdown This week’s Federal Reserve speeches, which entail Governor Stephen Miran on Wednesday and Governor Lisa Cook on Thursday, as traders’ rate cut expectations dial back Earnings from key retail companies, notably Home Depot and TJX Companies . Woods is watching Home Depot’s 200-day moving average to see if the stock can break above $380 per share. With TJX soaring to new highs last week, Woods is looking to see if the discount retailer’s rally can continue and hold above the $145 level in case a pullback occurs. (This weekly Monday video is exclusively for CNBC PRO subscribers.)
Simply sign up to the US financial regulation myFT Digest — delivered directly to your inbox.
The US Securities and Exchange Commission on Monday said it would allow companies to exclude shareholder proposals from proxy materials, as Wall Street’s top regulator increasingly moves to limit investor activism.
Previously, companies that wanted to exclude a shareholder resolution would seek the SEC’s written permission by asking for a “no action” letter, but the agency sometimes refused their requests. Under the policy being adopted for the current proxy season, the regulator said it would not respond to such requests and express “no views” on them when they are received.
“The SEC has essentially announced that it will not enforce its own rules,” said Sanford Lewis, director and general counsel of Shareholder Rights Group, an investor advocacy association. “The ‘no action’ process and staff determinations regarding whether or not a proposal is excludable is a long-standing SEC rule.”
The move follows the regulator’s decision in February to rescind guidance issued by Joe Biden’s administration that made it easier for shareholders to submit environmental and social proposals. The withdrawal of that guidance resulted in a rise of omitted resolutions, contributing to a significant decline in shareholder proposals compared to the previous proxy season.
The policy could reshape the current proxy season by making it harder for shareholders to demand changes at companies.
The SEC in September allowed companies to limit the risk of shareholder lawsuits by allowing the disputes to be heard privately. The regulator also approved ExxonMobil’s plan to build an automated voting system for retail investors that will automate voting in line with board of director positions.
Shareholder advocates have objected to the moves. The International Corporate Governance Network, a group of global investors with assets under management of $90tn, warned in a letter to the regulator in October that the changes could lower governance standards in the US, thereby risking the “attractiveness of US capital markets”.
The SEC said companies that intend to exclude shareholder proposals from proxy materials must notify the commission, but there is “no requirement” that they must seek the staff’s view and that no response from the regulator is required. It cited a large volume of filings and current “resource and timing considerations” following the government shutdown in deciding it would express “no views” on a group’s decision to exclude resolutions.
Still, the new changes could make companies vulnerable to legal risk from shareholders. “There is a higher legal burden on the company side now because they don’t get to rely on the SEC,” said Ariane Marchis-Mouren, a senior researcher at The Conference Board’s ESG centre.
If a company wishes to receive a response for any proposal that it intends to exclude, the SEC will respond with a letter indicating that it will not object to the omission, the regulator said.
Under the surface, we are seeing breakdowns in high-beta stocks that had formerly been upside leadership for the market, even as the major indices hold up above initial support. A correction has been in place for high-flying stocks since mid-October, which has resulted in a one-month return of -11.7% for the ARK Innovation ETF (ARKK) , a high-growth technology stock proxy. We view the sell-off in ARKK as a risk-off indication for the broader market. The correction in ARKK looks poised to deepen over the next few weeks, at least. Intermediate-term momentum recently shifted to the downside per the weekly MACD, and the weekly stochastics have room to move into oversold territory. Next support on the chart is near $67, where the February high and the 200-day MA converge. The daily chart suggests that there is downside risk in the short term to the 200-day MA. ARKK broke down below cloud-based support late last week as a fresh bearish catalyst. The daily MACD shows that short-term momentum is strongly negative, and there are no signs of downside exhaustion yet. The ratio of ARKK to the SPX saw a steep run-up in September, reflective of a strong tape led by riskier assets. The ratio has since seen a significant retracement, indicating that the market is now avoiding risk. The underperformance has resulted in a downturn in the 50-day MA for the ratio, something we last saw in late February. The ratio also has room to move toward next support from its 200-day MA, supporting additional downside leadership from ARKK in the near term. In conclusion, the sell-off in ARKK is a risk-off indication for the broader market, which looks vulnerable to a deeper correction over the next few weeks. We would be quicker to reduce exposure to volatile technology stocks, which tend to get hit harder than the average stock during corrective phases. —Katie Stockton with Will Tamplin Access research from Fairlead Strategies for free here . DISCLOSURES: None. All opinions expressed by the CNBC Pro contributors are solely their opinions and do not reflect the opinions of CNBC, NBC UNIVERSAL, their parent company or affiliates, and may have been previously disseminated by them on television, radio, internet or another medium. THE ABOVE CONTENT IS SUBJECT TO OUR TERMS AND CONDITIONS AND PRIVACY POLICY . THIS CONTENT IS PROVIDED FOR INFORMATIONAL PURPOSES ONLY AND DOES NOT CONSITUTE FINANCIAL, INVESTMENT, TAX OR LEGAL ADVICE OR A RECOMMENDATION TO BUY ANY SECURITY OR OTHER FINANCIAL ASSET. THE CONTENT IS GENERAL IN NATURE AND DOES NOT REFLECT ANY INDIVIDUAL’S UNIQUE PERSONAL CIRCUMSTANCES. THE ABOVE CONTENT MIGHT NOT BE SUITABLE FOR YOUR PARTICULAR CIRCUMSTANCES. BEFORE MAKING ANY FINANCIAL DECISIONS, YOU SHOULD STRONGLY CONSIDER SEEKING ADVICE FROM YOUR OWN FINANCIAL OR INVESTMENT ADVISOR. Click here for the full disclaimer. Fairlead Strategies Disclaimer: This communication has been prepared by Fairlead Strategies LLC (“Fairlead Strategies”) for informational purposes only. This material is for illustration and discussion purposes and not intended to be, nor construed as, financial, legal, tax or investment advice. You should consult appropriate advisors concerning such matters. This material presents information through the date indicated, reflecting the author’s current expectations, and is subject to revision by the author, though the author is under no obligation to do so. This material may contain commentary on broad-based indices, market conditions, different types of securities, and cryptocurrencies, using the discipline of technical analysis, which evaluates the demand and supply based on market pricing. The views expressed herein are solely those of the author. This material should not be construed as a recommendation, or advice or an offer or solicitation with respect to the purchase or sale of any investment. The information is not intended to provide a basis on which you could make an investment decision on any particular security or its issuer. This document is intended for CNBC Pro subscribers only and is not for distribution to the general public. Certain information has been provided by and/or is based on third party sources and, although such information is believed to be reliable, no representation is made with respect to the accuracy, completeness, or timeliness of such information. This information may be subject to change without notice. Fairlead Strategies undertakes no obligation to maintain or update this material based on subsequent information and events or to provide you with any additional or supplemental information or any update to or correction of the information contained herein. Fairlead Strategies, its officers, employees, affiliates and partners shall not be liable to any person in any way whatsoever for any losses, costs, or claims for your reliance on this material. Nothing herein is, or shall be relied on as, a promise or representation as to future performance. PAST PERFORMANCE IS NOT INDICATIVE OF FUTURE RESULTS. Opinions expressed in this material may differ or be contrary to opinions expressed, or actions taken, by Fairlead Strategies or its affiliates, or their respective officers, directors, or employees. In addition, any opinions and assumptions expressed herein are made as of the date of this communication and are subject to change and/or withdrawal without notice. Fairlead Strategies or its affiliates may have positions in financial instruments mentioned, may have acquired such positions at prices no longer available, and may have interests different from or adverse to your interests or inconsistent with the advice herein. Any investments made are made under the same terms as nonaffiliated investors and do not constitute a controlling interest. No liability is accepted by Fairlead Strategies, its officers, employees, affiliates, or partners for any losses that may arise from any use of the information contained herein. Any financial instruments mentioned herein are speculative in nature and may involve risk to principal and interest. Any prices or levels shown are either historical or purely indicative. This material does not take into account the particular investment objectives or financial circumstances, objectives or needs of any specific investor, and are not intended as recommendations of particular securities, investment products, or other financial products or strategies to particular clients. Securities, investment products, other financial products or strategies discussed herein may not be suitable for all investors. The recipient of this information must make its own independent decisions regarding any securities, investment products or other financial products mentioned herein. The material should not be provided to any person in a jurisdiction where its provision or use would be contrary to local laws, rules, or regulations. This material is not to be reproduced or redistributed absent the written consent of Fairlead Strategies.
One of the biggest goals for companies in the field of artificial intelligence is developing “agentic” or autonomous systems. These metaphorical agents can perform tasks without a guiding human hand. This parallels the goals of the emerging urban air mobility industry, which hopes to bring autonomous flying vehicles to cities around the world. One company got a head start on doing both with some help from NASA.
Autonomy Association International Inc. (AAI) is a public benefit corporation based in Mountain View, California, near NASA’s Ames Research Center in Silicon Valley. In 2022, AAI signed a Space Act Agreement with Ames to support the agency’s Data and Reasoning Fabric project, which aimed to support the transportation of people and cargo to areas previously unserved or underserved by aviation, and to provide reliable, accurate, and current data for aeronautic decision-making.
“Inspiration to lean into data fabric to solve certain complexities came from our NASA partnership,” said AAI cofounder and the project’s industry principal investigator Greg Deeds. “Working on this project was a great experience. Working with NASA engineers and leaders gave us experience that we’ll carry forward in all of our products.”
Similar to how clothing fabric is made of intertwined threads, a data fabric comprises intertwined data sources. While a data fabric built by a tech company may include data from a few different cloud service providers, NASA’s Data and Reasoning Fabric can also use information provided by local governments and other service providers. By viewing airspace as a large data fabric, an autonomous vehicle can take in data and requests from the cities and towns it flies over and prioritize responses between them.
Working with Ken Freeman, principal investigator of the project at Ames, AAI and NASA performed four testing adaptations of the data fabric technology in the air over Arizona. Using hardware and software developed by AAI, the flights tested advanced air mobility passenger flights and the use of a drone for rapid delivery of medical supplies from urban to rural areas and back, while sending new tasks to the aircraft in flight. A helicopter stood in for the drone and air taxi, flying over towns, universities, tribal lands, and the airspace around Phoenix Sky Harbor airport and obtaining data and programs given to it from different places.
“We’re focusing on the digital infrastructure building blocks of smart cities and regions of the future,” said Jennifer Deeds, chief operating officer and cofounder of AAI.
In the years since the original NASA project, the company has cultivated relationships and customers abroad, including companies in agriculture, real estate development, and industrial food production using its system to aggregate and manage data. Released in 2024, the company’s Digital Infrastructure Platform uses the same technology originally designed for the NASA flight test. A new, “agentic” version followed not long after, able to retrieve necessary AI programs with minimal interaction.
As AI unlocks innovation across American industries, NASA is equipping its commercial partners with the keys, using proven technology to generate breakthrough solutions.
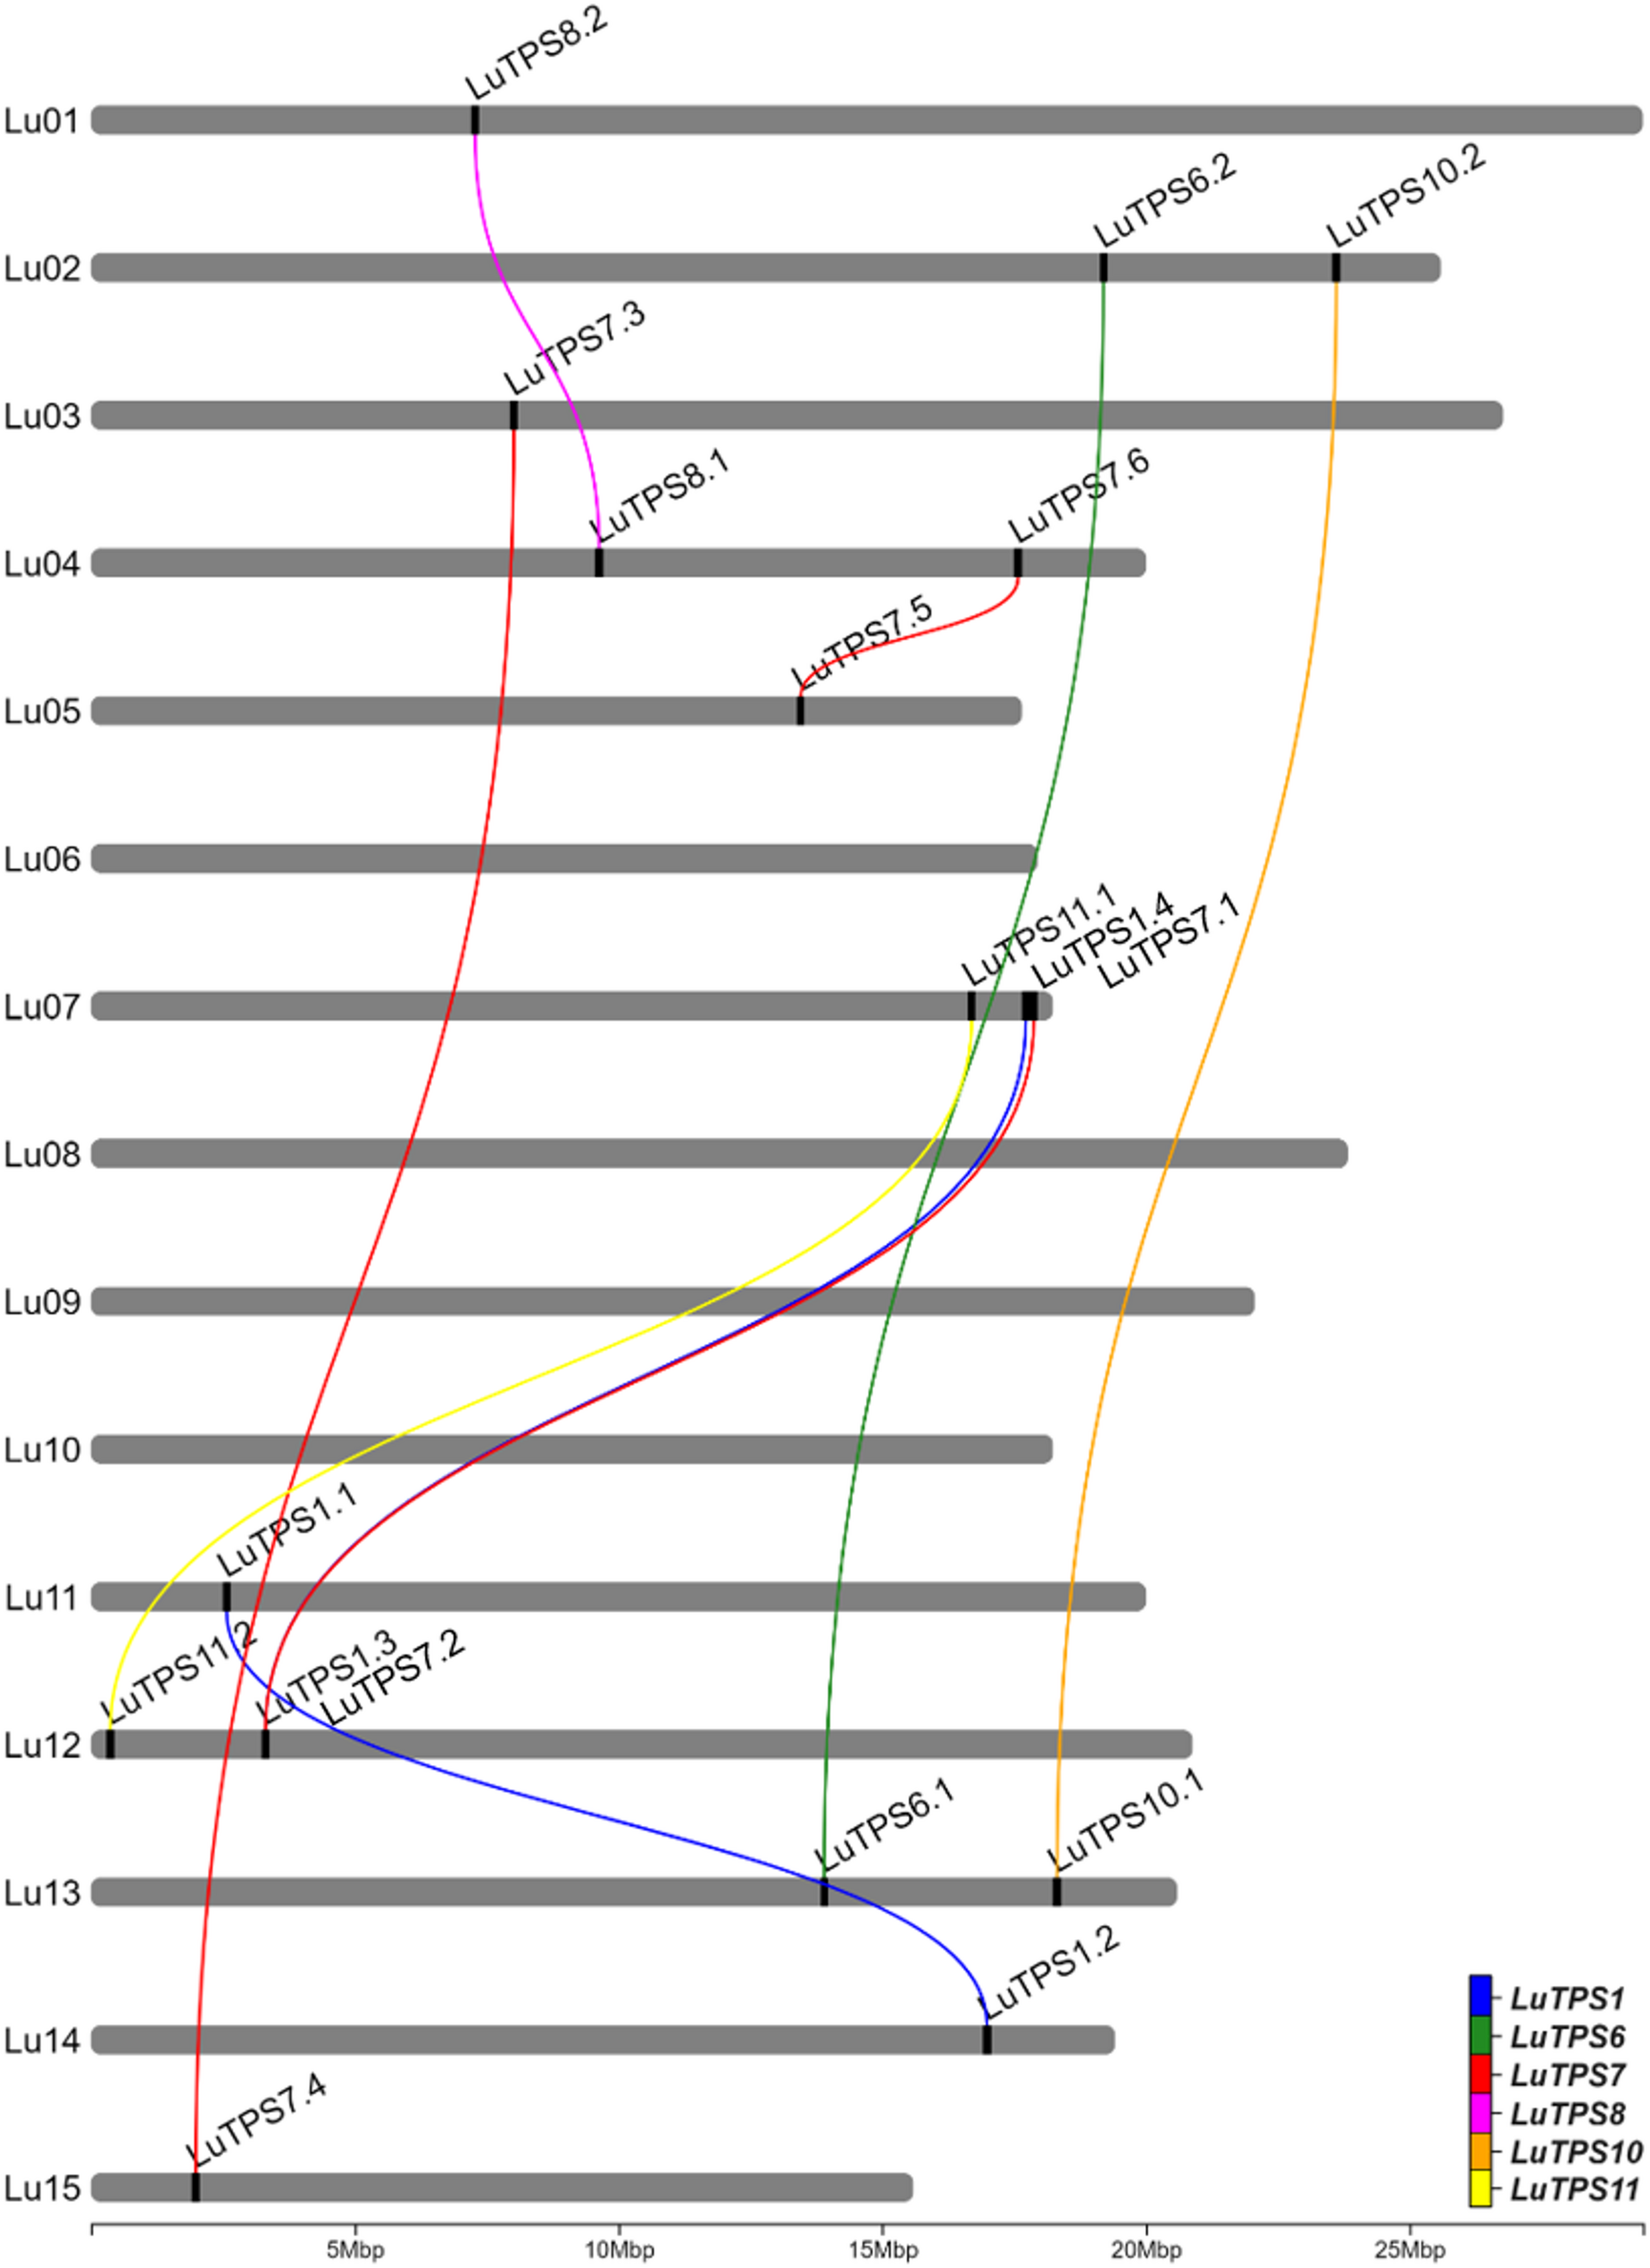
Identification and in silico characterization of LuTPS gene family
A total of 18 LuTPS genes were identified in silico, distributed across 11 of the 15 linseed chromosomes, excluding Lu06, Lu08, Lu09, and Lu10 (Fig. 1, Table 1). The LuTPS proteins ranged from 800 (LuTPS11.2) to 971 (LuTPS1.1) amino acids long. The predicted isoelectric point (pI) values varied from 5.50 (LuTPS7.6) to 7.05 (LuTPS1.1), with an average pI of 6.08. The predicted localization of the LuTPS proteins varied across different cellular compartments, with the majority localized in the chloroplast (7 proteins), followed by cytoplasm (5 proteins), nucleus (5 proteins), and one in vacuole. The highest number of phosphorylation sites was predicted for LuTPS1.3 and LuTPS1.4 (47 each), followed by LuTPS6.1 and LuTPS6.2 (38 each), and LuTPS1.1 and LuTPS1.2 (34 each), whereas the lowest number of phosphorylation sites was found in LuTPS7.1 and LuTPS7.2 (23 each) (Table 1). The LuTPS1 paralogs exhibited the most complex gene structures, with LuTPS1.1 containing 16 exons and LuTPS1.2, LuTPS1.3, and LuTPS1.4 each containing 17 exons. In contrast, other LuTPS genes displayed simpler structures, with exon numbers ranging from 2 (LuTPS10.2) to 4 (LuTPS11.2) (Figure S1).
Fig. 1
Chromosomal positions of trehalose-6-phosphate synthase genes in linseed and their paralogues. Lines connecting TPS genes indicate paralogous relation
Table 1 List of identified TPS genes in linseed and its in-silico characterization
Phylogenetic analysis and nomenclature of linseed TPS
The LuTPS genes were named according to their closest Arabidopsis orthologs as identified in the pairwise distance matrix. In cases where multiple linseed genes showed similarity to the same Arabidopsis TPS, they were designated with numerical suffixes indicating their relative similarity to the Arabidopsis ortholog (Table 1). For phylogenetic analysis of LuTPS, the protein sequences of 18 LuTPS along with 11 AtTPS were aligned using t-coffee, and a phylogenetic tree was constructed using the ML method implemented in MEGA 11. The linseed TPS, along with Arabidopsis TPS, clustered into two distinct groups, Cluster 1 and Cluster 2 (Fig. 2). The LuTPS1 paralogues (LuTPS1.1, LuTPS1.2, LuTPS1.3, LuTPS1.4) were found in Cluster 1, alongside the AtTPS1. Cluster 1 also included AtTPS2, AtTPS3, and AtTPS4. Cluster 2 was further divided into three subclusters, 2a, 2b, and 2c. Subcluster 2a contained LuTPS6.1 and LuTPS6.2, along with AtTPS6, as well as AtTPS5. Subcluster 2b was exclusively composed of LuTPS7 (LuTPS7.1, LuTPS7.2, LuTPS7.3, LuTPS7.4, LuTPS7.5, LuTPS7.6) together with AtTPS7. Subcluster 2c included paralogues of LuTPS8 (LuTPS8.1, LuTPS8.2), LuTPS10 (LuTPS10.1, LuTPS10.2), and LuTPS11 (LuTPS11.1, LuTPS11.2), which clustered alongside AtTPS8, AtTPS10, AtTPS11, and AtTPS9.
Fig. 2
Phylogenetic analysis of trehalose-6-phosphate synthase (TPS) genes from linseed and Arabidopsis thaliana. The TPS genes are grouped into two major clusters, reflecting their evolutionary relationships
Expression analysis of LuTPS genes in vegetative and reproductive tissues
Gene expression profiles of the LuTPS genes in linseed were analyzed from the available transcriptome sequence data across four different tissues, bud at two developmental stages (bud1, bud2), flower, leaf, and stem, using RNA sequencing data from two early flowering-maturing accessions, IC0523807 and IC0525939. LuTPS6.1, LuTPS6.2, and LuTPS10.1 showed relatively higher expression in all the studied tissues including floral buds, flowers, leaf and stem in both the accessions. LuTPS10.1 showed conspicuously high expression in leaf in both the accessions (Fig. 3a, b). Most of the LuTPS genes except LuTPS1.3, LuTPS1.4, LuTPS7.5, and LuTPS7.6 were found expressed in one or more studied tissue types in both the accessions. A few genes showed high expression across all tissues in both the early flowering accessions which included LuTPS7.1, LuTPS7.2, LuTPS7.3, LuTPS7.4, LuTPS8.1, LuTPS8.2, LuTPS10.1, and LuTPS10.2. In contrast, LuTPS1.1, LuTPS1.2, LuTPS11.1, and LuTPS11.2 exhibited relatively higher expression in flower compared to other reproductive and vegetative tissues. Overall, the top most expressing LuTPS genes were LuTPS6.1, LuTPS6.2, and LuTPS10.1.
Fig. 3
Gene expression profiles of TPS genes in reproductive and vegetative tissues of early-flowering linseed genotypes IC0523807 and IC0525939 based on transcriptome data. Gene names are displayed on the right, with expression-based hierarchical clustering shown on the left. The color gradient from red to blue represents transcript abundance in TPM (Transcripts Per Million), ranging from high to low expression levels
To further pinpoint the potential linseed TPS genes involved in flowering regulation linseed, TPS gene expressions was compared to that of gene expression of important flowering regulators including FLOWERING LOCUS T (FT) (Lus10013532), FRUITFULL (FUL) paralogs (Lus10011349, Lus10021140), SUPPRESSOR OF OVEREXPRESSION OF CONSTANS 1 (SOC1) (Lus10036543), Squamosa Promoter Binding Protein-Like 9 (SPL9) (Lus10007984) using the transcriptome of floral buds at two stages, flowers, leaves and stem of two early flowering linseed accessions IC0523807 and IC0525939 (Fig. 4). A positive correlation of FT was observed only with LuTPS1.1; while FUL (Lus10011349) showed positive correlation with LuTPS1.2, LuTPS6.1, LuTPS6.2, LuTPS7.2, LuTPS7.3, LuTPS7.4 and LuTPS8.2, indicating possible functional redundancy. Interestingly, LuTPS10.1 was the only gene which showed positive correlation with expression of the other FUL paralog (Lus10021140) and SOC1. There was no significant correlation of any TPS gene expression to that of SPL9, indicating no probable role of the latter in regulating TPS gene expression.
Fig. 4
Homology-based 3D structures of the LuTPS10.2 protein variant in linseed, showing the amino acid substitution at position 782: (a) GLY-782 in late-flowering genotypes and (b) VAL-782 in early-flowering genotypes. Intramolecular interactions of the LuTPS10.2 variants are illustrated for (c) GLY-782 and (d) VAL-782
Allelic variation in LuTPS genes in early and late linseed accessions
To investigate the allelic variations in LuTPS gene family, available whole genome sequencing data of two early flowering-maturing (IC0523807, IC0525939) and two late flowering-maturing (EC0115148, EC0718827) linseed germplasm accessions (Bio-project ID-PRJNA1207411; Table S1) was used and the reference-based SNP calling was performed. Trait-specific SNPs (those capable of distinguishing between early and late flowering-maturing accessions) were identified in two genes, LuTPS6.1 (3 SNPs: 2 SNPs in exons, 1 SNP in intron) (Table 2), and LuTPS10.2 (3 SNPs, all in exons) (Table 3). Both the exonic SNPs in LuTPS6.1 gene were synonymous in nature and therefore had no alteration in the protein sequence. Additionally, in the promoter sequence of the LuTPS6.1 gene, a total of 16 SNPs/indels were identified (Table 2). However, these variations in the promoter region did not exhibit any clear pattern associated with early or late flowering phenotypes. In LuTPS10.2, from the 3 SNPs, one SNP was non-synonymous at nucleotide position 2439 (‘G’ in late flowering-maturing group changed to ‘T’ in early flowering-maturing group) which resulted in an amino acid substitution, Glycine (a non-polar amino acid) to Valine (an aliphatic and hydrophobic amino acid) at position 782 in the resulting protein (Table 3, Figure S2). The other two SNPs were synonymous, causing no change in the protein sequence. Further, in the promoter sequence of LuTPS10.2, a total of 9 SNPs, and 18 indels were identified (Table 3). Of these, 10 SNPs exhibited phenotype-specific patterns, differing between early and late flowering-maturing accessions. Further, two insertions of 2 and 11 nucleotides (at position −1117 to −1116 and −627 to −617, respectively) and a single nucleotide deletion (at position−685) were observed in both early flowering accessions.
Table 2 SNP haplotype of LuTPS6.1 gene along with 2 kb promoter sequence in 2 early and 2 late flowering-maturing germplasm accessions of linseed. SNPs highlighted in bold font can differentiate between early and late flowering-maturing accessions
Table 3 SNP haplotype of LuTPS10.2 gene along with 2 kb promoter sequence in 2 early and 2 late flowering-maturing germplasm accessions of linseed. SNPs highlighted in bold font can differentiate between early and late flowering-maturing accessions
Effect of amino acid substitution on 3D structure of TPS protein
To evaluate the impact of the amino acid substitution on the LuTPS10.2 protein’s 3D structure, homology-based modeling was performed and the 3D structures of both the original protein (prior to amino acid substitution) and the modified protein (after substitution) were predicted and compared to evaluate any structural changes (Fig. 5a-d). Notably, the proteins from the early flowering-maturing group demonstrated an increase in intramolecular interactions, which typically enhances protein stability (Fig. 5c, d). The substitution of ‘G’ with ‘V’ in the early flowering-maturing group led to a significant reduction in potential energy, contributing to a stabilizing effect on the proteins within these accessions (Table 4).
Fig. 5
Correlation of expression of TPS genes and key flowering genes FT (Lus10013532), FUL paralogs (Lus10011349, Lus10021140), SOC1 (Lus10036543) and SPL9 (Lus10007984) in linseed.a Pairwise correlation between gene pairs. Color gradient of the circle from blue to red denotes positive to negative correlation. Size of the circle indicates the strength of p value. b, g Line plots depicting the normalized expression (Transcripts per Million) of TPS paralogs and flowering genes across tissues, floral bud 1, bud 2, flower, leaves, and stem in early-flowering linseed accessions IC0525939 and IC0523807. Expression data under NCBI, BioProject ID PRJNA773597 was used
Table 4 Potential energy of LuTPS10.2 protein before and after amino acid substitution in late and early flowering-maturing accessions
Analysis of CREs in LuTPS genes and their enrichment
2 kb promoter sequences upstream of the start codon of 37,999 linseed genes were extracted from the linseed genome assembly. The position weight matrix data of 2,254 TF binding sites (TFBS) from the PlantPAN 3.0 database were used to predict the occurrence of CRE motifs within these promoter sequences. The CREs within the 2 kb promoter regions of 18 LuTPS genes were identified, and their enrichment was assessed by statistically comparing their frequency against the background frequency across the entire linseed genome (37,999 genes). A total of 32 CREs were identified as significantly enriched in the promoter sequences of LuTPS genes compared to the average genomic distribution at a threshold of q-value ≤ 0.1 (Table 5). Among the significantly enriched CREs, flowering and photoperiod related CREs included TF_motif_seq_0250, TF_motif_seq_0146, TF_motif_seq_0321, TFmatrixID_1221, TFmatrixID_0797, and TF_motif_seq_0481. It is intriguing to note that from the 32 enriched CREs, at least 15 were related to Dof-type domain-containing protein (Table 5). In addition, the promoter sequences of individual LuTPS genes were also analyzed for the presence of CREs using the PlantPAN4 database [62]. The analysis identified a total of 104 CREs, each present at least once in the promoter region of every LuTPS gene (Table S3). It is also important to highlight that six of the enriched CREs (TF_motif_seq_0250, TF_motif_seq_0315, TF_motif_seq_0344, TF_motif_seq_0238, TF_motif_seq_0321, and TF_motif_seq_0458) were consistently present in the promoter of all TPS genes in linseed (Table 5, Table S3).
Table 5 List of cis-regulatory elements enriched in LuTPS promoter sequences
Genome scale syntenic network analysis of linseed and nine other plant genomes
To understand synteny of TPS genes in different crop plants, The genome scale syntenic network analysis of linseed and nine other plants representing cereals, oilseeds, pulses, and a model plant species (Arabidopsis, rice, barley, wheat, sesame, sunflower, soybean, greengram, and cowpea) was performed. A total of 68,930 conserved syntenic blocks (CSBs) were identified in the studied 10 plant species (Table 6). Among the comparisons, the highest number of CSBs involving linseed was found with soybean, (3,673 CSBs), followed by sunflower (2,159), cowpea (2,092), and sesame (2,018) while barley exhibited the fewest CSBs with linseed (588) (Fig. 6, Figure S3, Table 6). Notably, 179 of the 68,930 CSBs contained at least one LuTPS gene (Table 7). The highest number of LuTPS-containing CSBs was observed between linseed and soybean (43), followed by cowpea (25), sunflower (24), and sesame (22). Linseed itself had 15 intraspecific CSBs with gene counts per CSB ranging from 9 to 399 (Fig. 6, Table 7).
Table 6 Number of total CSBs identified among the 10 crops under study. The numbers in parentheses indicate the size (number of genes) of the smallest and largest CSBs. The numbers in curly braces denote the count of CSBs in the plus and minus orientations, respectively
Fig. 6
Genome-wide synteny analysis of linseed with soybean (Glycine max) (a), sunflower (Helianthus annuus) (b), and cowpea (Vigna unguiculata) (c). The genome wide conserved syntenic blocks (CSB) between the two species are depicted in grey shade, and the CSBs harbouring linseed TPS are shown with red lines
Table 7 Number of CSBs containing at least one LuTPS gene. The numbers in parentheses indicate the size (number of genes) of the smallest and largest CSBs. The numbers in curly braces denote the count of CSBs in the plus and minus orientations, respectively
Syntenic gene collinearity networks (GCN) of linseed TPS
In order to identify LuTPS-specific syntenic block networks (SBN), the 179 CSBs (containing at least one LuTPS gene) were analyzed using Cytoscape software [48]. Accordingly, the 179 CSBs clustered into four distinct SBNs. The interaction of linseed TPS genes within these four SBNs was visualized as nodes (representing genes) and edges (representing syntenic relationships). Consequently, the linseed TPS genes formed four gene collinearity networks (GCN) (Fig. 7). Each node (gene) within the GCN represents the CSB in which this gene was located, while the edges highlight the syntenic relationships between them. The largest cluster, GCN Cluster-I (Fig. 7a), comprised of 35 genes, including 10 linseed TPS genes, LuTPS1.1, LuTPS1.2, LuTPS1.3, LuTPS1.4, LuTPS7.1, LuTPS7.2, LuTPS7.3, LuTPS7.4, LuTPS7.5, and LuTPS7.6. The remaining genes in this GCN were TPS genes from soybean, sunflower, cowpea, sesame, Arabidopsis, greengram, barley, and rice. The highest syntenic relationship for linseed TPS genes was observed with soybean and sunflower (6 genes each), followed by cowpea (4 genes), sesame (2 genes), Arabidopsis (2 genes), greengram (2 genes), rice (2 genes), and barley (1 gene). Within Cluster-I, subcluster-Ia consists of four linseed TPS genes (LuTPS1.1, LuTPS1.2, LuTPS1.3, and LuTPS1.4). Syntenic relationships were observed between LuTPS1.1 & LuTPS1.2, and between LuTPS1.3 & LuTPS1.4, though no direct connections were found between the two pairs. However, connections were observed with TPS genes from other plants, suggesting an ancient duplication event that led to the divergence of these gene pairs. Subcluster-Ia and subcluster-Ib were connected through a syntenic relationship between LuTPS1.2 and LuTPS7.5, facilitated by a TPS gene from greengram (XP_014493970.1). In subcluster-Ib, two linseed TPS genes, LuTPS7.5 and LuTPS7.6, displayed direct syntenic relationships. LuTPS7.5 also showed syntenic connections with TPS genes from cowpea and soybean. Subcluster-Ib was linked to Subcluster-Ic through syntenic relationships involving LuTPS7.5 and LuTPS7.6, both of which exhibited synteny with a TPS gene from sesame (XP_020550607.1). Subcluster-Ic comprised four linseed TPS genes (LuTPS7.1, LuTPS7.2, LuTPS7.3, and LuTPS7.4), all of which exhibited direct syntenic relationships with each other, indicating a high degree of conservation within this group. Cluster II was the smallest, with only 9 genes, including two linseed TPS genes, LuTPS6.1 and LuTPS6.2, which did not share direct syntenic interactions (Fig. 7b). Other genes in this cluster were from soybean, cowpea, greengram, sesame, and an Arabidopsis UDP-Glycosyltransferase/trehalose-phosphatase family protein (NP_001322467.1). LuTPS6.1 displayed direct syntenic connections with 7 genes, including the Arabidopsis gene, whereas LuTPS6.2 was connected with TPS genes from soybean, cowpea, greengram, and sesame. Interestingly, this cluster appears specific to dicot species, as no TPS genes from monocots (rice, barley, and wheat) were represented. Cluster III, containing 23 genes, featured four linseed TPS genes, LuTPS8.1, LuTPS8.2, LuTPS10.1, and LuTPS10.2 displaying direct syntenic relationships with one another (Fig. 7c). Other genes in the cluster are from soybean, cowpea, Arabidopsis, sunflower, sesame, greengram, and rice. Notably, wheat and barley TPS genes are absent from this cluster. LuTPS8.1 and LuTPS8.2 both interacted with 18 other TPS genes. The syntenic relationship with the sunflower TPS gene (XP_021976108.1) was specific to LuTPS8.1, while LuTPS8.2 uniquely showed interaction with the soybean TPS gene (XP_006578621.1). Additionally, both LuTPS10.1 and LuTPS10.2 demonstrate syntenic connections with 17 other TPS genes. Cluster IV consists of 17 genes, including two linseed TPS genes, LuTPS11.1 and LuTPS11.2, alongside TPS genes from other species (Fig. 7d). Notably, LuTPS11.1 and LuTPS11.2 exhibited a direct syntenic relationship with each other. Additionally, LuTPS11.1 displayed syntenic connections with all 16 other genes in the cluster, whereas LuTPS11.2 was syntenically linked to 14 genes, with the exceptions being the TPS genes from rice (XP_015610911.1) and soybean (XP_006593555.1). Notably, this cluster included TPS genes from all the ten plant species under study.
Fig. 7
Gene collinearity networks (GCNs) derived from conserved syntenic blocks (CSBs) containing TPS genes. Four GCN clusters (I–IV) are shown in panels (a–d). Each node represents a gene, annotated with the corresponding CSB, and edges indicate syntenic relationships between genes
To study if any of the genes in the linseed TPS specific CSBs also show any molecular interactions with TPS, we studied protein–protein interaction (PPI) network of TPS using the STRING database. The potentially interacting partners of each linseed TPS have been given in Table S4. There were a total of 27 unique interacting proteins identified for all 18 linseed TPS. Most linseed TPS paralogues shared the same interacting partners. Three of the interacting proteins, Lus10017984 (Uncharacterized protein), Lus10038739 (Hexosyltransferase), and Lus10041979 (Sucrose synthase) were part of the linseed TPS specific CSBs. Of which, Lus10017984 (Uncharacterized protein) showed PPI with LuTPS1.1, LuTPS1.2, LuTPS11.2. The other proteins, Lus10041979 (Sucrose synthase) showed PPI with 6 linseed TPS (LuTPS1.1, LuTPS1.2, LuTPS1.3, LuTPS1.4, LuTPS6.1, LuTPS6.2), whereas Lus10038739 (Hexosyltransferase) showed PPI specifically with LuTPS6.1, LuTPS6.2 (Table S4, Fig. 8a). From the 18 LuTPS, for the top ten expressing TPS genes (LuTPS6.1, LuTPS6.2, LuTPS10.1, LuTPS10.2, LuTPS7.1, LuTPS7.2, LuTPS7.3, LuTPS7.4, LuTPS8.1, LuTPS8.2) (Fig. 3), PPI network was drawn (Fig. 8a). For these 10 TPS, there were 20 unique interacting proteins, consisting mainly, trehalose 6-phosphate phosphatases, glucose-1-phosphate adenylyltransferase, sucrose-phosphate synthase, hexosyltransferase etc. (Table S5). The co-expression analysis of these TPS genes with the interacting partners was done using the transcriptome data of two early flowering linseed accessions in floral buds at two stages, flowers, leaves and stem (Fig. 8b). Correlation analysis of LuTPS and their respective interacting partners showed significant positive correlation of Lus10038739 (Hexosyltransferase) with six TPS genes, LuTPS6.1, LuTPS6.2, LuTPS10.2, LuTPS7.1, LuTPS7.2, and LuTPS8.2 (Fig. 8c). Interestingly, Lus10041979 (Sucrose synthase) showed significant positive and negative correlation with LuTPS7.1 and LuTPS10.1, respectively. Five of the ten potential interacting partners of LuTPS6.1 and LuTPS6.2 showed positive correlation with them, which included hexosyltransferases (Lus10038739, Lus10003045), starch synthases (Lus1003324, Lus10008279), and glucose-1-phosphate adenylyltransferase (Lus10023553). It is interesting to note that all linseed TPS, except LuTPS6.1 and LuTPS6.2 showed at least one of the interacting partners as trehalose 6-phosphate phosphatase.
Fig. 8
LuTPS protein–protein interactions and co-expression with the potential interacting genes. a Protein–protein interaction network of linseed TPS as identified using string database. The central node with red color is TPS protein, other nodes with different colors indicate the interacting protein and edges indicate their interactions. b Co-expression of TPS genes and respective potential interacting partners in floral buds at two developmental stages, flower, leaf and stem in two biological replicates of early flowering linseed genotypes IC0523807 and IC0525939 based on transcriptome data. The gene expression value is in TPM. c Correlation of gene expression of linseed TPS genes and their potential interacting partners. Size of the circle indicates the strength of p value and color gradient of the circle from blue to red denotes positive to negative correlation
Islam MS, Peng SB, Visperas RM, Ereful N, Bhuiya MSU, Julfiquar AW. Lodging-related morphological traits of hybrid rice in a tropical irrigated ecosystem. Field Crop Res. 2007;101(2):240–8.
Article
Google Scholar
Ma DL, Xie RZ, Liu X, Niu XK, Hou P, Wang KR, Lu YL, Li SK. Lodging-Related stalk characteristics of maize varieties in China since the 1950s. Crop Sci. 2014;54(6):2805–14.
Article
Google Scholar
Zhao B, Li K, Wang M, Liu Z, Yin P, Wang W, Li Z, Li X, Zhang L, Han Y, et al. Genetic basis of maize stalk strength decoded via linkage and association mapping. Plant J. 2024;117(5):1558–73.
Article
CAS
PubMed
Google Scholar
Pinthus MJ. Lodging in wheat, barley, and oats: the phenomenon, its causes, and preventive measures. Adv Agron. 1974;25:209–63.
Article
Google Scholar
Xue J, Gao S, Hou LY, Li LL, Ming B, Xie RZ, Wang KR, Hou P, Li SK. Physiological influence of stalk rot on maize lodging after physiological maturity. Agronomy-Basel. 2021;11(11):2271.
Article
CAS
Google Scholar
Shah AN, Tanveer M, Anjum SA, Iqbal J, Ahmad R. Lodging stress in cereal—effects and management: an overview. Environ Sci Pollut R. 2017;24(6):5222–37.
Article
Google Scholar
Li Q, Fu CF, Liang CL, Ni XJ, Zhao XH, Chen M, Ou LJ. Crop lodging and the roles of Lignin, Cellulose, and hemicellulose in lodging resistance. Agronomy-Basel. 2022;12(8):1795.
Article
CAS
Google Scholar
Rehman M, Luo D, Mubeen S, Pan J, Cao S, Saeed W, Chen P. Progress in agronomic crops lodging resistance and prevention: A review. J Agro Crop Sci. 2024;210(6):e12785.
Yang J, Li M, Yin Y, Liu Y, Gan X, Mu X, Li H, Li J, Li H, Zheng J, et al. Spatial accumulation of lignin monomers and cellulose underlying stalk strength in maize. Plant Physiol Bioch. 2024;214:108918.
Zhang Z, Zhang X, Lin Z, Wang J, Liu H, Zhou L, Zhong S, Li Y, Zhu C, Lai J, et al. A large transposon insertion in the stiff1 promoter increases stalk strength in maize. Plant Cell. 2020;32(1):152–65.
Article
CAS
PubMed
Google Scholar
Wang B, Yang M, Guo H, Wang J, Wang Z, Lu H, Qin G, Chen J. Genome-wide association study for stalk lodging resistance related traits in maize (Zea Mays L). BMC Genomics. 2024;25(1):19.
Sekhon RS, Joyner CN, Ackerman AJ, McMahan CS, Cook DD, Robertson DJ. Stalk bending strength is strongly associated with maize stalk lodging incidence across multiple environments. Field Crop Res. 2020;249:107737.
Article
Google Scholar
Xu SH, Tang X, Zhang XM, Wang HM, Ji WD, Xu CW, Yang ZF, Li PC. Genome-wide association study identifies novel candidate loci or genes stalk in maize. Crop J. 2023;11(1):220–7.
Article
CAS
Google Scholar
Hu H, Meng Y, Wang H, Liu H, Chen S. Identifying quantitative trait loci and determining closely related stalk traits for rind penetrometer resistance in a high-oil maize population. Theor Appl Genet. 2012;124(8):1439–47.
Article
CAS
PubMed
Google Scholar
Zhang YL, Liang TH, Chen M, Zhang YC, Wang T, Lin HJ, Rong TZ, Zou CY, Liu P, Lee M, et al. Genetic dissection of stalk lodging-related traits using an IBM Syn10 DH population in maize across three environments (Zea Mays L). Mol Genet Genomics. 2019;294(5):1277–88.
Article
CAS
PubMed
Google Scholar
Liu XG, Hu XJ, Li K, Liu ZF, Wu YJ, Wang HW, Huang CL. Genetic mapping and genomic selection for maize stalk strength. BMC Plant Biol. 2020;20(1):196.
Sun Q, Liu X, Yang J, Liu W, Du Q, Wang H, Fu C, Li WX. MicroRNA528 affects lodging resistance of maize by regulating lignin biosynthesis under Nitrogen-Luxury conditions. Mol Plant. 2018;11(6):806–14.
Article
CAS
PubMed
Google Scholar
Zhao BB, Xu MY, Zhao YP, Li YY, Xu H, Li CY, Kong DX, Xie YR, Zheng ZG, Wang BB, et al. Overexpression of ZmSPL12 confers enhanced lodging resistance through transcriptional regulation of D1 in maize. Plant Biotechnol J. 2022;20(4):622–4.
Article
CAS
PubMed
PubMed Central
Google Scholar
Chen S, Fan X, Song M, Yao S, Liu T, Ding W, Liu L, Zhang M, Zhan W, Yan L, et al. Cryptochrome 1b represses Gibberellin signaling to enhance lodging resistance in maize. Plant Physiol. 2024;194(2):902–17.
Article
CAS
PubMed
Google Scholar
Landi P, Sanguineti M, Darrah L, Giuliani M, Salvi S, Conti S, Tuberosa RJM. Detection of QTLs forvertical root pulling resistance in maize and overlap with QTLs for root traits in hydroponics. Maydica. 2002;47:233–43.
Google Scholar
Landi P, Sanguineti M, Liu C, Li Y, Wang T, Giuliani S, Bellotti M, Salvi S, Tuberosa R. Root-ABA1 QTL affects root lodging, grain yield, and other agronomic traits in maize grown under well-watered and water-stressed conditions. J Exp Bot. 2006;58(2):319–26.
Article
PubMed
Google Scholar
Farkhari M, Krivanek A, Xu Y, Rong T, Naghavi MR, Samadi BY, Lu Y, Lübberstedt T. Root-lodging resistance in maize as an example for high‐throughput genetic mapping via single nucleotide polymorphism‐based selective genotyping. Plant Breeding. 2012;132(1):90–8.
Article
Google Scholar
Zheng Z, Wang B, Zhuo C, Xie Y, Zhang X, Liu Y, Zhang G, Ding H, Zhao B, Tian M, et al. Local auxin biosynthesis regulates Brace root angle and lodging resistance in maize. New Phytol. 2023;238:142–54.
Article
CAS
PubMed
Google Scholar
Xie J, Guo G, Wang Y, Hu T, Wang L, Li J, Qiu D, Li Y, Wu Q, Lu P, et al. A rare single nucleotide variant in Pm5e confers powdery mildew resistance in common wheat. New Phytol. 2020;228(3):1011–26.
Article
CAS
PubMed
Google Scholar
Lin G, Chen H, Tian B, Sehgal SK, Singh L, Xie J, Rawat N, Juliana P, Singh N, Shrestha S, et al. Cloning of the broadly effective wheat leaf rust resistance gene Lr42 transferred from Aegilops Tauschii. Nat Commun. 2022;13(1):3044.
Wang Z, Niu Y, Xie Y, Huang C, Yung W-S, Li M-W, Wong F-L, Lam H-M. QTL mapping and BSR-seq revealed loci and candidate genes associated with the sporadic multifoliolate phenotype in soybean (Glycine max). Theor Appl Genet. 2024;137(12):262.
Shi L, Jiang C, He Q, Habekuß A, Ordon F, Luan H, Shen H, Liu J, Feng Z, Zhang J, et al. Bulked Segregant RNA-sequencing (BSR-seq) identified a novel rare allele of eIF4E effective against multiple isolates of BaYMV/BaMMV. Theor Appl Genet. 2019;132(6):1777–88.
Article
CAS
PubMed
Google Scholar
Kim D, Landmead B, Salzberg SL. HISAT: a fast spliced aligner with low memory requirements. Nat Methods. 2015;12(4):357–U121.
Article
CAS
PubMed
PubMed Central
Google Scholar
McKenna A, Hanna M, Banks E, Sivachenko A, Cibulskis K, Kernytsky A, Garimella K, Altshuler D, Gabriel S, Daly M, et al. The genome analysis toolkit: A mapreduce framework for analyzing next-generation DNA sequencing data. Genome Res. 2010;20(9):1297–303.
Article
CAS
PubMed
PubMed Central
Google Scholar
Mansfeld BN, Grumet R. QTLseqr: an R package for bulk Segregant analysis with Next-Generation sequencing. Plant Genome. 2018;11(2):180006.
Schenk JJ, Becklund LE, Carey SJ, Fabre PP. What is the modified CTAB protocol? Characterizing modifications to the CTAB DNA extraction protocol. Appl Plant Sci. 2023;11(3):e11517.
Article
CAS
PubMed
PubMed Central
Google Scholar
Meng L, Li H, Zhang L, Wang J. QTL icimapping: integrated software for genetic linkage map construction and quantitative trait locus mapping in biparental populations. Crop J. 2015;3(3):269–83.
Article
Google Scholar
Chen L, Luo J, Jin M, Yang N, Liu X, Peng Y, Li W, Phillips A, Cameron B, Bernal JS, et al. Genome sequencing reveals evidence of adaptive variation in the genus Zea. Nat Genet. 2022;54(11):1736–45.
Article
CAS
PubMed
Google Scholar
Langmead B, Salzberg SLJN. Fast gapped-read alignment with bowtie 2. Nat Methods. 2012;9(4):357–9.
Article
CAS
PubMed
PubMed Central
Google Scholar
Li H, Peng Z, Yang X, Wang W, Fu J, Wang J, Han Y, Chai Y, Guo T, Yang N. Genome-wide association study dissects the genetic architecture of oil biosynthesis in maize kernels. Nat Genet. 2013;45(1):43–50.
Article
CAS
PubMed
Google Scholar
Liu S, Yeh CT, Tang HM, Nettleton D, Schnable PS. Gene mapping via bulked Segregant RNA-Seq (BSR-Seq). PLoS ONE. 2012;7(5):e36406.
Article
CAS
PubMed
PubMed Central
Google Scholar
Mounier E, Pervent M, Ljung K, Gojon A, Nacry P. Auxin-mediated nitrate signalling by NRT1.1 participates in the adaptive response of Arabidopsis root architecture to the Spatial heterogeneity of nitrate availability. Plant Cell Environ. 2013;37(1):162–74.
Article
PubMed
Google Scholar
Cao H, Liu Z, Guo J, Jia Z, Shi Y, Kang K, Peng W, Wang Z, Chen L, Neuhaeuser B, et al. ZmNRT1.1B (ZmNPF6.6) determines nitrogen use efficiency via regulation of nitrate transport and signalling in maize. Plant Biotechnol J. 2024;22(2):316–29.
Article
CAS
PubMed
Google Scholar
Hostetler AN, Erndwein L, Reneau JW, Stager A, Tanner HG, Cook D, Sparks EE. Multiple Brace root phenotypes promote anchorage and limit root lodging in maize. Plant Cell Environ. 2022;45(5):1573–83.
Article
CAS
PubMed
Google Scholar
Imran M, Sun X, Hussain S, Rana MS, Saleem MH, Riaz M, Tang X, Khan I, Hu C. Molybdenum supply increases root system growth of winter wheat by enhancing nitric oxide accumulation and expression of NRT genes. Plant Soil. 2020;459(1–2):235–48.
Google Scholar
Hu B, Wang W, Ou S, Tang J, Li H, Che R, Zhang Z, Chai X, Wang H, Wang YJNG. Variation in NRT1. 1B contributes to nitrate-use divergence between rice subspecies. Nat Genet. 2015;47(7):834–8.
Article
CAS
PubMed
Google Scholar
Fan X, Feng H, Tan Y, Xu Y, Miao Q, Xu GJJIPB. A putative 6-transmembrane nitrate transporter OsNRT1. 1b plays a key role in rice under low nitrogen. J Integr Plant Biol. 2016;58(6):590–9.
Article
CAS
PubMed
Google Scholar
Yin NW, Li B, Liu X, Liang Y, Lian JP, Xue YF, Qu CM, Lu K, Wei LJ, Wang R, et al. Two types of cinnamoyl-CoA reductase function divergently in accumulation of lignins, flavonoids and glucosinolates and enhance lodging resistance in brassica Napus. Crop J. 2022;10(3):647–60.
Article
CAS
Google Scholar
Sakamoto S, Somssich M, Nakata MT, Unda F, Atsuzawa K, Kaneko Y, Wang T, Bagman AM, Gaudinier A, Yoshida K, et al. Complete substitution of a secondary cell wall with a primary cell wall in Arabidopsis. Nat Plants. 2018;4(10):777–83.
Article
CAS
PubMed
Google Scholar
Xiao C, Barnes WJ, Zamil MS, Yi H, Puri VM, Anderson CT. Activation tagging of arabidopsispolygalacturonase INVOLVED IN EXPANSION2promotes hypocotyl elongation, leaf expansion, stem lignification, mechanical stiffening, and lodging. Plant J. 2017;89(6):1159–73.
Article
CAS
PubMed
Google Scholar
Safran J, Tabi W, Ung V, Lemaire A, Habrylo O, Bouckaert J, Rouffle M, Voxeur A, Pongrac P, Bassard S, et al. Plant polygalacturonase structures specify enzyme dynamics and processivities to fine-tune cell wall pectins. Plant Cell. 2023;35(8):3073–91.