Unlock the Editor’s Digest for free
Roula Khalaf, Editor of the FT, selects her favourite stories in this weekly newsletter.
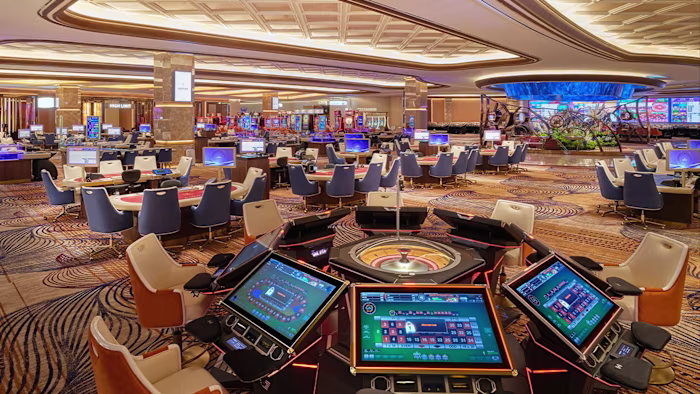
One of the world’s largest private equity groups is embroiled in an unusual tug of war with a Native American tribe over the future of a sprawling casino complex in Asia.
The Inspire Resort, with three five-star hotels, a 15,000-seat K-pop arena and a foreigners-only casino, had its grand opening in 2024 by the Mohegan tribe. The development on an island near South Korea’s Incheon international airport was the first outside North America for the tribe, which has a 600-acre reservation in Connecticut.
But in February Bain Capital, which provided $275mn of financing for the project, called the loan two years early and took control of the project after Mohegan failed to hit covenants related to growth targets.
The decision shut Mohegan out of a project it had been developing for almost a decade, and led to Bain taking ownership of a foreign casino and gaming licence complete with billions of dollars in refinancing and investment obligations.
Now Bain is back in talks with Mohegan over a possible return to the $1.6bn project, according to the new leadership of the tribe, which wants to continue to play a role in its flagship overseas venture.
“Mohegan has put a lot of effort, time and commitment into this project going back 10 years, so we obviously have a keen interest in seeing it through,” said Bobby Soper, Mohegan’s international president.
“We have had continued discussions with Bain, and I think they understand our position in that regard,” he added. “It’s our hope that we’ll have a resolution that achieves our goals and makes both parties happy, but not at any price and it has to make sense.”
People familiar with Bain confirmed that it was talking to Mohegan over a possible return to the project, after taking over running the resort itself while exploring bringing on operating partners over the past few months.
In a statement the private equity firm said: “Bain Capital and Inspire’s management team have worked closely to strengthen operations and enhance the overall guest experience. We remain focused on the resort’s long-term success and continue to have a strong relationship with all stakeholders.”
Only one South Korean casino is open to domestic customers and so the sector relies almost entirely on foreign tourists, especially from China.
Although the country’s casino revenues are still a fraction of those generated in the Chinese territory of Macau, industry executives expect booming demand this year. Growing China-Japan tension could drive more Chinese tourists to South Korea instead, while Seoul has also recently restored a visa-free travel policy for Chinese group tourists.
The Inspire Resort in Incheon competes with domestic rivals such as Paradise, GKL and Lotte Tour.
The resort initially appeared a success following its soft opening in November 2023, helping Mohegan Gaming to achieve record revenues for the second quarter of 2024.
But its performance deteriorated by early 2025 as it struggled to attract and retain return visitors.
Soper said the resort had also suffered from a dramatic decline in foreign tourism in the wake of then-president Yoon Suk Yeol’s botched attempt at imposing martial law in South Korea in December 2024.
He added that even accounting for the fact that such resorts tend to face challenges in their early stages, the business “did not grow as quickly as anticipated”.
Soper also said the casino had even had an unhelpful string of winning customers.
“The players [at the casino] were very lucky,” said Soper. “That’s fine, it’s the nature of the business, but when you’re growing at the beginning and you’re building your customer database it creates further challenges.”
A person familiar with Mohegan’s operations in South Korea said the casino operator had also struggled to cater to a different customer base in Asia, including by neglecting provisions for guests to arrive by public transport.
A second person familiar with the talks between the two companies said Bain had been concerned about its exposure but “ended up with more on their plate than they bargained for”.
The person also said Bain could have found itself in a “legal grey area” over the casino licence, although other people close to Bain rejected this as a concern.
Soper said Mohegan had been that surprised Bain had called the loan. “It’s one thing if you miss an interest payment or a principal payment, but in this case it was simply missing a covenant,” he said.
Mohegan “still believes that Korea represents a long-term opportunity”, he added. “North America has a limited supply of opportunities.”
The resort has returned to operating profit and visitor numbers and gaming revenue have been rising this year, the people close to Bain said.
Soper said Mohegan had invested more than $300mn in equity in the casino project and said any terms for its re-entry to the project remained to be negotiated.
“There’s outstanding claims on both sides, and perhaps a solution could be to participate back in the project whether as an owner or a manager or both — but those are discussions we still need to have,” he said.
Additional reporting by Song Jung-a in Seoul