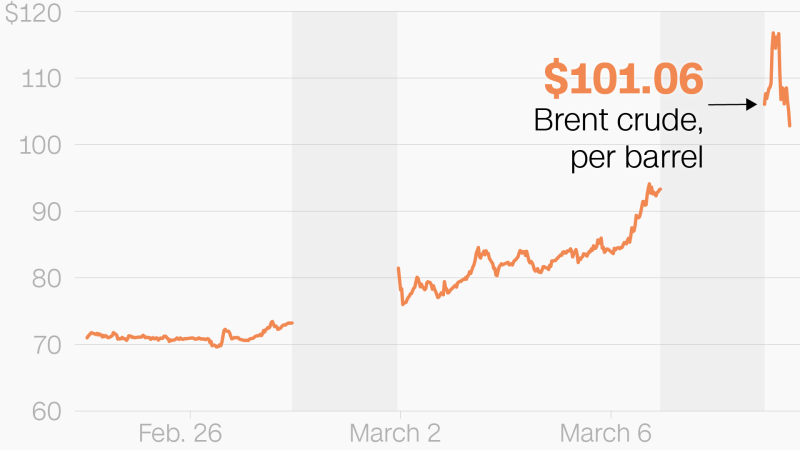
Fears over the global economy have been stoked by the oil price soaring past $100 a barrel as a result of the US-Israel war with Iran.
Economists say the increasing likelihood of a prolonged conflict in the vital energy exporting region could have serious consequences for living standards around the world amid the threat of a renewed inflation shock.
Against a highly uncertain backdrop, financial markets are under heavy selling pressure, consumers are facing rising prices, central banks could be forced to increase borrowing costs and governments will come under pressure to support households and businesses.
How high could oil prices go?
Oil prices passed $119 a barrel on Monday, the highest level since Russia’s full-scale invasion of Ukraine in February 2022. Analysts say the continued closure of the strait of Hormuz could drive the price close to $150 a barrel, above the record high of $145.29 set in July 2008.
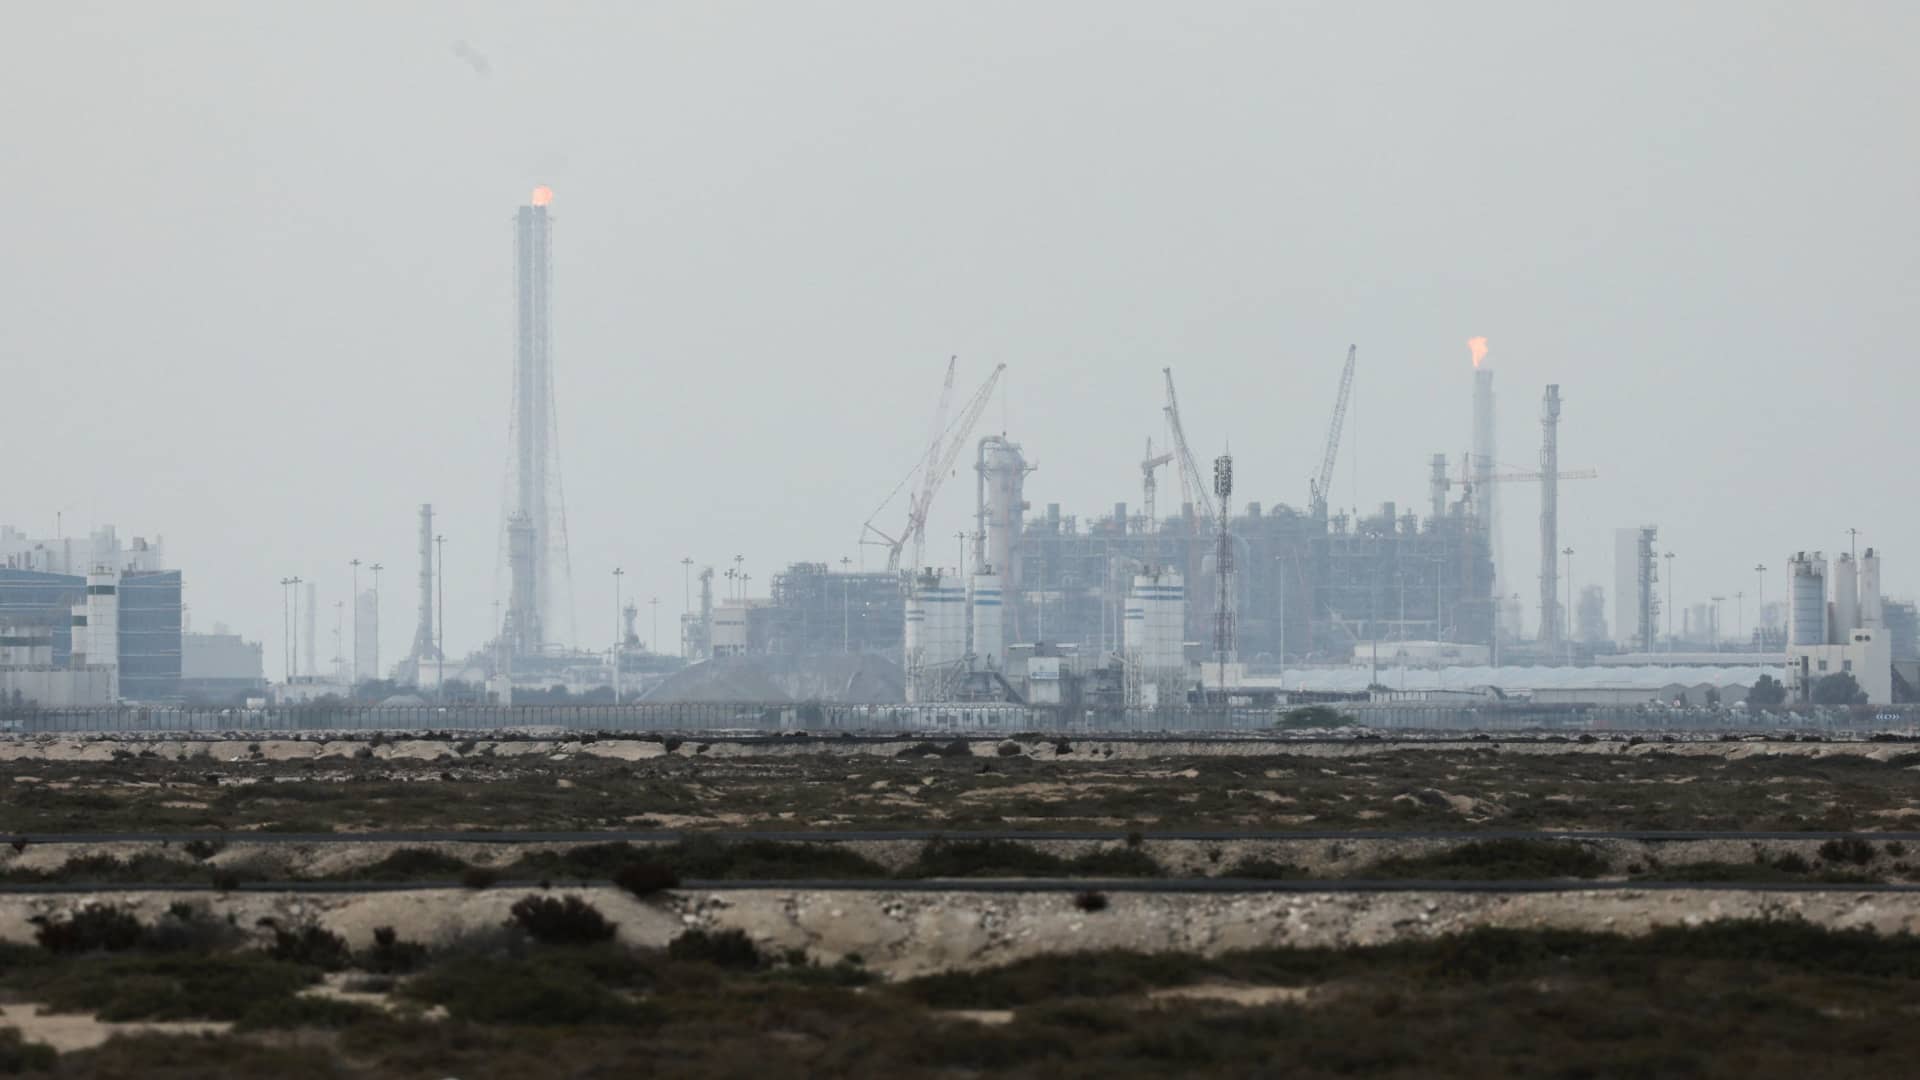
The narrow shipping route on Iran’s southern border carries a fifth of global seaborne crude oil and liquified natural gas, and a third of the most widely used fertiliser.
Goldman Sachs has said Iran’s effective blockade of the waterway has had an impact 17 times larger than the peak April 2022 hit to Russian oil production after the Ukraine invasion, which pushed the oil price to about $139 a barrel.
What happens next hinges on how long the strait is effectively closed and the ability to divert exports. Saudi Arabia has begun routing crude to its Red Sea ports, but most exporters are trapped behind bottlenecks. Gulf oil and gas storage facilities are reaching their limits as a result, meaning large oilfields may need to be shut down. Returning production to previous levels would take time, adding further to the energy crisis.
Analysts say a short, sharp conflict that allowed Hormuz exports to resume would help to cool energy prices. Prolonged uncertainty could linger, however, over the safety of the waterway. Capital Economics has said a longer-lasting conflict could keep the oil price above $100 a barrel throughout this year.
How much could inflation be affected?
The soaring oil price comes at a delicate moment for the global economy. Central banks had been nearing the end of a process of normalising interest rates after the most aggressive tightening cycle in decades in response to Russia’s invasion of Ukraine. Further rate cuts had been anticipated, but experts say the Iran conflict could prompt the opposite, a renewed rise in borrowing costs.
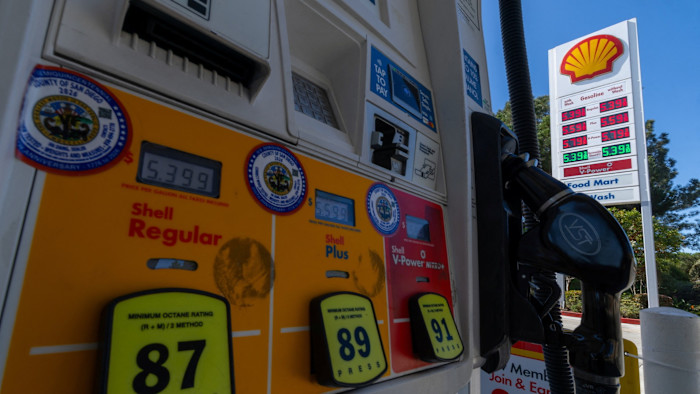
After the 2022 experience, the way higher energy costs and logistical bottlenecks bleed into consumer prices is well known. Fuel prices for motorists are already rising, households’ energy bills could increase sharply and higher costs for businesses will ripple through global supply chains. These costs will ultimately be passed on to consumers.
There are hopes that a re-run of the inflation spikes of the 1970s, when oil price shocks emanating from the Middle East rippled through the world economy, can be avoided.
Analysts highlight the fact that long-term inflation expectations have remained relatively grounded in recent years, even after Russia’s invasion of Ukraine, suggesting that central banks have helped to maintain confidence that prices can be brought back under control.
“The global economy is less sensitive to energy shocks than half a century ago,” said Jim Reid of Deutsche Bank. “Economies are much less energy-intensive today, and labour markets have far lower unionisation and wage indexation, reducing the risk of a 1970s-style wage-price spiral.”
Could the crisis trigger a global recession?
The inflation increases triggered by the Covid pandemic and Russia’s invasion of Ukraine mean households and businesses have already stomached years of sharp price increases. Many are stretched to breaking point.
Economists say a renewed inflationary burst would damage consumer demand and hit economic activity. Fears of stagflation, where growth stagnates but inflation increases, are mounting.
“Talk of recession is back,” said the accountancy firm Deloitte’s chief economist in the UK, Ian Stewart.
“Surging oil and gas prices are harbingers of economic trouble. Higher energy prices, triggered by war or revolution in the Middle East, were major factors in western recessions in 1973, 1979 and 1990. The surge in energy prices in the wake of Russia’s invasion of Ukraine collapsed Europe’s growth rate in 2023.”
Higher borrowing costs and heightened geopolitical uncertainty are likely to hit business investment and global trade, meaning countries where the growth outlook is already fragile could tip closer to recession.
How might governments respond?
G7 countries have said they stand ready to release emergency oil reserves to soothe global supply concerns. Having increased domestic production in recent years, the US is largely energy-independent despite depleting its domestic strategic oil reserve. China has amassed vast oil stockpiles. European countries are likely to be hit hardest by the fallout. Most are net energy importers, and rely heavily on oil and gas.
Governments will come under renewed pressure to boost their energy security. Much of the focus will be on accelerating the switch to a low-carbon economy and investment in renewable energy. A political battle over the pace of transition is also likely though, as happened after Russia’s invasion of Ukraine.
Politicians are also facing calls to provide emergency financial support to help struggling households and businesses with higher energy bills. EU countries and the UK stepped in with costly schemes four years ago.
Borrowing and debt levels are already stretched for many western governments, however, limiting capacity to unfurl expensive new programmes without testing fragile global bond market appetite.
“The problem now is how much this will cost governments, with energy support packages being floated as ideas,” said Jordan Rochester of the Japanese bank Mizuho.
“This may be a war, but it’s also perhaps the biggest energy supply/logistics crisis we’ve ever seen in modern history.”