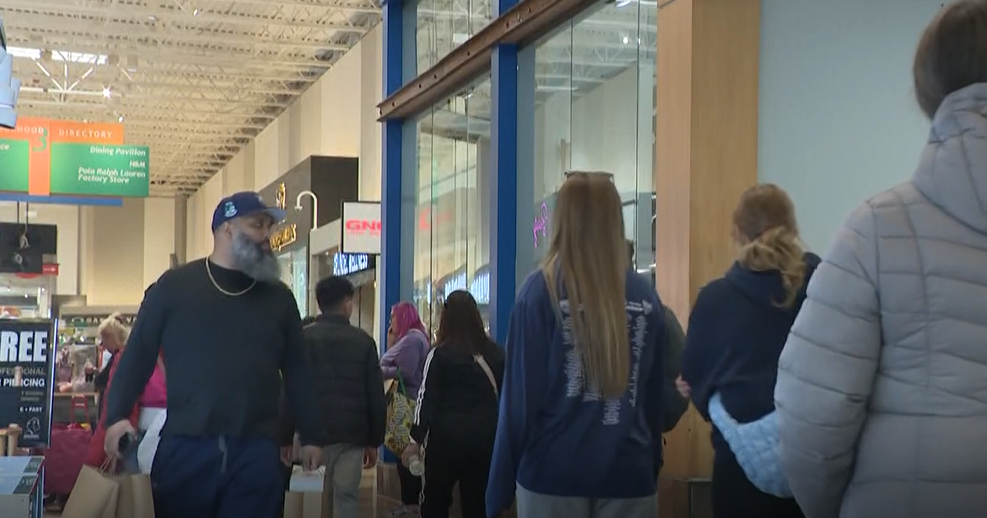
The shopping rush leading up to Christmas is over and in its place, like every year, another has begun as millions of people hunt for post-holiday deals and get in line to return gifts that didn’t fit, or didn’t hit quite right.
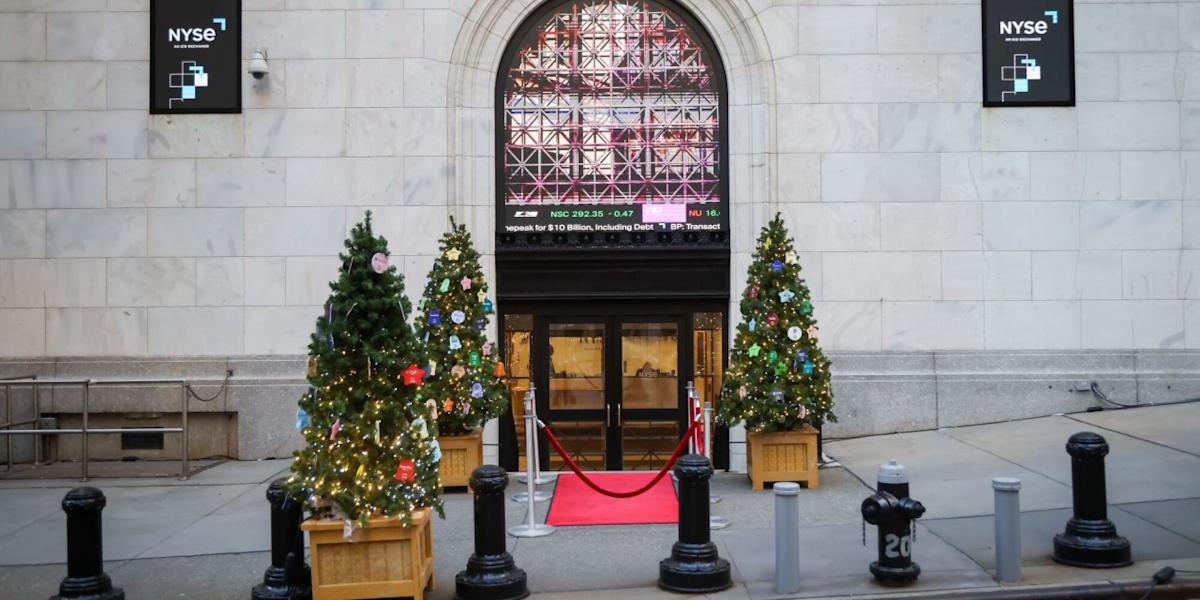
Holiday spending using cash or cards through Sunday has topped last year’s haul, according to data released this week by Visa’s Consulting & Analytics division and Mastercard SpendingPulse.
But growing unease over the U.S. economy and higher prices in part due to President Donald Trump’s tariffs have altered the behavior of some Americans. More are hitting thrift stores or other discounters in place of malls, according to data from Placer.ai. The firm tracks people’s movements based on cellphone usage.
And they’re sticking more closely to shopping lists and doing more research before buying. That may explain why returns so far are down compared with last year, according to data from Adobe Analytics.
Here are three trends that defined the holiday shopping season so far:
Americans are still spending on gifts, yet increasingly that shopping is taking place at thrift and discount stores, according to data from Placer.ai.
That’s likely forcing traditional retailers such as department stores to fight harder for customers, Placer.ai said.
Clothing and electronics that traditionally dominate holiday sales did have a surge but struggled to grow, according to Placer.ai. Both goods are dominated by imports and thus, vulnerable to tariffs.
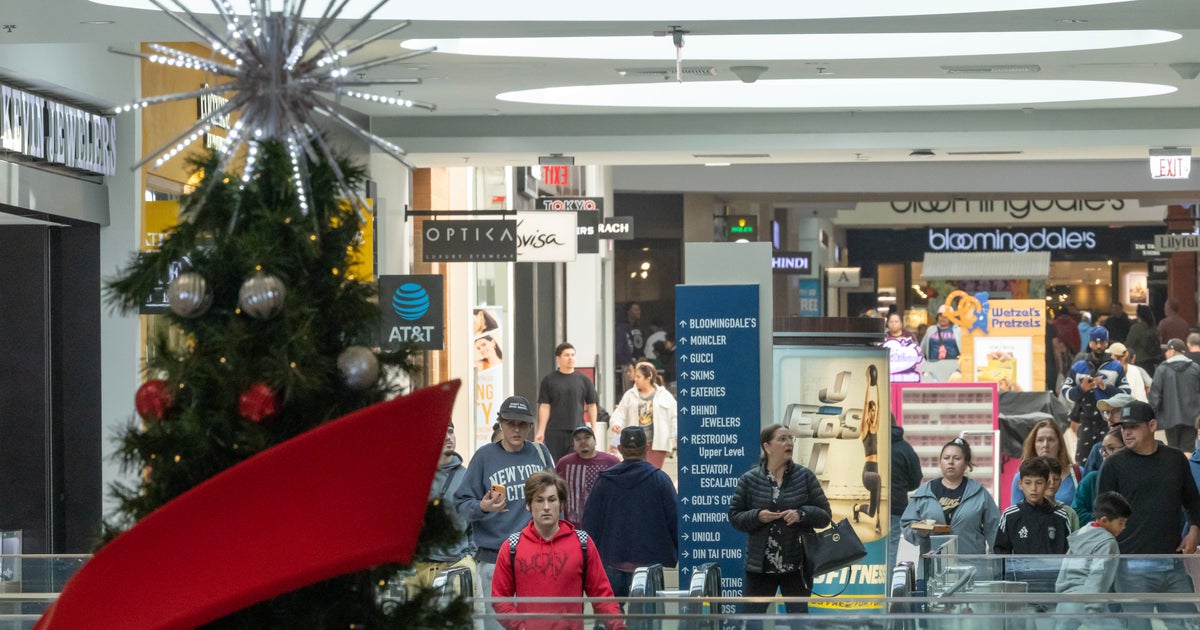
For example, traffic doubled in department stores during the week before Christmas, from Dec. 15 through Sunday, compared with the average shopping week this year. But traffic in the week before Christmas this year fell 13.2% compared with 2024.
Traffic surged 61% at traditional sellers of only clothing in the week before the holiday compared with the rest of the year. But again, compared with the runup to Christmas last year, sales slid 9%.
Some of that lost traffic may have migrated to the so-called off-price stores— chains like TJ Maxx. That sector had a sharp seasonal traffic bump of 85.1% and a gain of 1.2% in the week before the holiday.
But it was thrift stores that were red hot, with traffic jumping nearly 11% in the week before Christmas compared with last year.
“Whether hunting for a designer deal or uncovering a one-of-a-kind vintage piece, consumers increasingly favored discovery-driven experiences over the standardized assortments of traditional retail,” Shira Petrack, head of content at Placer.ai, said in a blog post Friday.
In the past it may have seemed gauche to gift your mother a gently used sweater or a pair of pants from a local thrift store, but seemingly not so amid all of the economic uncertainty and rising prices, according to Placer.ai.
Through the second half of 2025, thrift stores have seen at least a 10% increases in traffic compared with last year. That suggests that environmental concerns as well as economic issues are luring more Americans to second-hand stores, Placer.ai said. Visits to thrift stores generally do not take off during the holidays, yet in the most recent Black Friday weekend, sales jumped 5.5%, Placer.ai. reported.
In November, as customer traffic in traditional apparel stores fell more than 3%, traffic in thrift stores soared 12.7%, according to Placer.ai.
The thrift migration has altered the demographics of second-hand stores. The average household income of thrift customers hit $75,000 during October and November of this year, a slight uptick from $74,900 last year, $74,600 in 2023 well above the average income of 74,100 in 2022, based on demographic data from STI:PopStats combined with Placer.ai data.
U.S. sales at thrift chain Savers Value Village’s rose 10.5% in the three months ended Sept. 27 and the momentum continued through October, store executives said in late October.
“High household income cohort continues to become a larger portion of our consumer mix,” CEO Mark Walsh told analysts. “It’s trade down for sure, and our younger cohort also continues to grow in numbers. “
For the first six weeks of the holiday season, return rates have dipped from the same period a year ago, according to Adobe Analytics.
That suggests that shoppers are doing more research before adding something to their shopping list, and they’re being more disciplined in sticking to the lists they create, according to Vivek Pandya, lead analyst at Adobe Digital Insights.
“I think it’s very indicative of consumers and how conscientiously they’ve purchased,” Pandya said. “Many of them are being very specific with how they spend their budget.”
From Nov. 1 to Dec. 12, returns fell 2.5% compared with last year, Adobe reported. In the seven days following Cyber Week — the five shopping days between Thanksgiving and Cyber Monday, returns fell 0.1%.
From the Nov. 1 through Dec. 12, online sales rose 6% to $187.3 billion, on track to surpass its outlook for the season, Adobe reported.
Between Dec. 26 to Dec. 31, returns are expected to rise by 25% to 35% compared with returns between Nov. 1 through Dec. 12, Adobe said, and it expects returns to remain elevated through the first two weeks of January, up 8% to 15%.
This is the first year that Adobe has tracked returns.
Still, the last week of December sees the greatest concentration of returns: one out of every eight returns in the 2024 holiday season took place between Dec. 26 and Dec 31, a trend expected to persist this year, Adobe said.