- Bechtel Selected to Deliver EPC Scope for the Eva Copper Mine Project Bechtel
- ACS’s Thiess Signs Agreement With Harmony For Works In Queensland Mine, In Australia TradingView — Track All Markets
- Is the state’s new $2.4b copper project leaving its host community behind? North Queensland Register
- Council push for Eva copper mine benefits in Cloncurry iQ Industry Queensland
- Thiess secures $700m worth of work packages for Eva Copper Project felix.net
Category: 3. Business
-
Bechtel Selected to Deliver EPC Scope for the Eva Copper Mine Project – Bechtel
-

Speech by Governor Miran on the inflation outlook
Thank you, Mr. Secretary. I appreciate the opportunity to speak here today.1
When I offered my assessment of policy in my first speech as a Federal Reserve Governor in September, I assumed inflation for core goods and nonhousing core services would continue to run at current rates.2 While that was a useful working assumption at the time, today I will break down my inflation outlook in more detail. Specifically, I’ll share my interpretation of inflation’s components and how this influences my perception of progress toward our 2 percent target.
Shelter Inflation
Shelter costs are top of mind for households, and a large component of inflation indices. But calculating shelter inflation is far from simple. For instance, the personal consumption expenditures (PCE) price index that the Fed targets includes housing costs for all households in the economy. That seems appropriate for capturing prices associated with all consumer spending but not ideal as a measure of current supply and demand pressures. Figure 1 makes that clear: As the economy emerged from the pandemic, demand for housing outstripped supply, and market rents for new tenants jumped. But the PCE shelter index for all households lagged, as rents only reset when people move or renew their leases. PCE will always lag market rents.As recently as last year, the PCE shelter index still had catching up to do, creating uncertainty as to how long measured shelter inflation would remain elevated. This is no longer the case. Indeed, a separate all-tenant rent index—drawn from the same microdata as PCE shelter—caught up to new-tenant rents, while PCE shelter has actually overshot new rents.3 Based on this catchup being complete, I expect a faster fall in PCE shelter inflation.
The current elevated readings for shelter inflation are an after-echo of previous, rather than current, supply–demand imbalances in the economy. For the past two years, we’ve seen extremely low increases in new-tenant rents. Measures by Cotality and Apartment List show that’s persisted in recent quarters. I therefore expect a faster decline in PCE shelter inflation. Two factors give me additional confidence: first, the negative population shock resulting from a reversal in net migration, and second, an elevated ratio of nominal shelter services consumption relative to overall consumption, which has historically been mean-reverting.
Core Nonhousing Services Inflation
Another important part of household budgets is the cost of services besides housing, food, and energy. These services are about half of household spending and include childcare, education, entertainment, and medical expenses. Core nonhousing services inflation has moved sideways this year, somewhat above the average level observed from 2002 to 2007, a useful reference period when core PCE inflation averaged 2 percent. However, I am not worried about nonhousing services.Wages are the primary driver of service inflation. Many service prices are driven by labor costs; for instance, labor compensation is about 60 percent of value added in leisure and hospitality and 83 percent in education and health services. Over the medium term, nonhousing services will follow labor market pressures.
Unemployment has trended higher for over two years, and wage growth lower. Additional measures of labor market tightness—such as job openings, consumer surveys about the difficulty of finding jobs, long-term layoffs, and the duration of unemployment—have suggested a loosening labor market for several years, tilting nominal wage growth risks toward the downside.
A notable aspect of core services inflation is that not all components are measured from directly observed transactions. Many services components in the index are imputed in various ways and do not capture information about supply–demand imbalances that are relevant for monetary policy. A prime example is portfolio management services, which have contributed a quarter-point to core PCE inflation in the last year, well above their long-run average.
The Bureau of Economic Analysis measures portfolio management costs based on overall revenues generated by asset managers. If the stock market goes up and boosts assets under management, revenues move in tandem since they are typically a fixed percentage fee of assets. What ought to be recorded as an increased quantity of services consumed is instead recorded as increased prices. There may, for national accounting purposes, be a good reason for doing it this way. But, for monetary policy purposes, there is none, and it would be foolish of us to chase statistical quirks rather than focus on actual consumer prices.
Remarkably, long-term trends in the asset management industry point toward fee compression, indicating trend deflation. Morningstar found the average expense ratio paid by investors fell nearly 6 percent in 2024.4 By contrast, PCE recorded a roughly 20 percent increase in portfolio management fees in this period, contributing about 30 basis points to core PCE. If PCE had instead matched industry data with a 6 percent decline, core PCE would have been about 40 basis points lower than officially reported.
Fees have consistently fallen each year for the past two decades, now less than half of what they were in 2005, as seen in figure 2.5 The PCE portfolio management measure contains no signal regarding tightness in the asset management industry, let alone the economy. It contains no signal for the inflation forecast going forward. It should not be used to frame underlying inflation. Yet here we are, keeping interest rates too high because of the phantom inflation of portfolio advisory fees.6
For these reasons, I do not take much signal from nonmarket-based components. When looking at market-based services, inflation in this category has come down dramatically from its peak and moved sideways since mid-2024, at around 3 percent. That is about 10 basis points below its average from 2002 to 2007, which, again, was a period in which PCE inflation was broadly at target. Core nonhousing services inflation only remains elevated compared with this period because of nonmarket components.
Core Goods Inflation
Turning to goods prices, they have been relatively less likely to rise than other index components since the turn of the century. That trend was abruptly disrupted in the aftermath of the pandemic. After that, core goods inflation fell into negative territory for a brief period of around one year. Over the past 12 months, core goods inflation has picked up. The dominant narrative explaining this pattern blames U.S. tariff policy. I am not convinced.Consider the timing, as shown in figure 3. In core goods PCE, it appears that the increase coincides with the imposition of tariffs during this year. However, in the consumer price index, the upturn began in the middle of 2024. We don’t target CPI, but it contains useful information. The evidence that tariff policy neatly coincides with the increase in core goods prices is conflicted.
When thinking through the effect of tariffs on prices, we must remind ourselves that the larger share of incidence or burden of any economic policy—tax, subsidy, or tariff—falls on the more inelastic or inflexible party. This is because the more elastic or flexible party can change its behavior to avoid the burden of the tax. As an importer, the U.S. is relatively more elastic, since we can substitute demand across borders or manufacture goods at home. But producers’ factories are installed capital that is stuck in place, and their labor is generally immobile and not easily substitutable across tradable and nontradable sectors. As the largest trade deficit country, there are few substitutes, if any, for American demand, but many substitutes for potential supply.
Product-level estimates of demand and supply elasticities from Anson Soderbery can be used to examine goods-level incidence.7 Figure 4 draws predicted isoincidence lines. The 45-degree line characterizes goods which have equal supply and demand elasticities, meaning incidence is evenly split between exporter and importer. The overwhelming majority of goods lie below the 45-degree line, meaning importers bear less burden. Figure 5 shows the cumulative distribution of import value based on the incidence absorbed by exporters. These elasticities imply that, for about 70 percent of import goods value, the exporter bears at least 70 percent of the incidence, and for about half of goods value, the exporter bears at least 80 percent of the incidence.8
Of course, there are goods for which importers bear material incidence, and that will mean relative price changes—but whether they prove to be relevant for aggregate prices depends on other considerations. Given the Soderbery (2018) elasticities and a split of the domestic incidence between wholesale importers and consumers, it is plausible that the ultimate effect of tariffs on consumer price levels will be in the neighborhood of two-tenths of a percent—noise.9
By contrast, many analyses for what tariffs would do to inflation were based on empirical studies of the U.S.–China trade conflict before the pandemic. However, these studies suffer from bias from trade rerouting and de minimis exemptions. If a Chinese exporter can avoid bearing incidence by costly transshipment or exploitation of the de minimis loophole, the incentive to do so will be highly correlated with the incidence absorbed. In other words, goods for which China would have to absorb a greater share of the tariff cost drop from the sample, while goods for which China could push through tariff costs to importers remain in the sample, violating identification restrictions. Jackson Mejia has studied this bias in pass-through estimates and finds evidence that up to 40 percent of product categories exposed to tariffs are affected by transshipment, with trade volumes approaching 25 percent for intermediate and capital goods.10 The de minimis exemption poses similar identification problems, meaning the transshipment effects are lower bounds on the identification problem in this literature.11 Additionally, these studies are short term in nature, and incidence analyses are usually long term; a difference in short-run and long-run elasticities is not controversial.
Moreover, any claim that tariffs are a current driver of inflation must be accompanied by a clear description of the counterfactual. Several analyses use the two decades before the pandemic as the relevant counterfactual; I do not find these periods to be reasonable given large concurrent shocks that pollute the analysis. Attributing all excess inflation over the pre-trend to tariffs is something that could be done for many recent policies or shocks, such as an emphasis on supply chain resilience after the pandemic unrelated to tariffs.
One counterfactual I think makes sense to use compares import-intensive core goods versus overall core goods, as shown in figure 6.12 If tariffs were the driver of recent inflation, then one would expect import-intensive core goods to see substantially more inflation. In fact, total core goods prices have risen at approximately the same rate as import-intensive goods since the end of last year.
I also compare the level of inflation in the U.S. to that of other industrialized countries, displayed in figure 7. If U.S. tariff policy were a material driver of domestic inflation, then U.S. goods inflation would visibly stick out from major trading partners. Yet U.S. inflation is comparable to that in Canada and the U.K., slightly above that in the European Union, and below that in Mexico; the U.S. doesn’t stand out in any direction. Neither counterfactual suggests tariffs are the primary driver of core goods inflation.
Even if one believes that tariffs are driving goods inflation, the standard practice is for central bankers is to “look through” a transient shock, as a one-time increase in the price level differs from a persistent shift to inflation. This mirrors how value-added taxes are treated by central banks. Monetary policy achieves stable prices through balancing aggregate supply and demand; changes in prices stemming from relative tax adjustments—incidence aside—are not indicative of supply–demand imbalances.
While the burden from tariffs will ultimately be borne by the exporters, this analysis is drawn from long-term elasticities. In the short run, it may take time for threats of moving supply chains to become credible, creating a lag before exporters reduce selling prices. Although I do not yet see meaningful tariff-driven inflation, it may materialize. But over time, short-run elasticities would converge with long-run elasticities. Not only would the increase in inflation be transitory, but likely so would the increase in the price level, meaning subsequent offsetting deflation.13
If tariffs are not the likely cause of the recent rise in goods inflation, then what is? One possibility is that the rise in prices is noise in a volatile series, though this is not a satisfying answer. A second possibility is that the U.S. and other advanced foreign economies are still following post-pandemic bullwhips of gradual oscillation around a lower mean level of core goods inflation. Under that scenario, last year’s core goods inflation was “too low” and now it is “too high”; perhaps next year it will be “too low” again.
A third, unsavory, possibility is that goods inflation is settling in at a higher level than prevailed immediately pre-pandemic. After all, there were previous regimes with stable but higher core goods inflation. Higher global goods inflation could result from a longer-term trend of trade restructuring that encompasses much more than tariffs, including a reduced willingness to rely on unfettered access to exports in favor of national security and geoeconomic concerns. Attention to supply chain security and resilience—which predates this year’s tariffs—may mean higher core goods inflation for a longer period, though perhaps not this high.
I accept I don’t know what’s driving higher goods inflation currently. As former Bank of England Governor, Mervyn King, and economist, John Kay, urged in Radical Uncertainty, pretending we have more knowledge than possible will stymie our understanding of reality.14 Shedding that hubris will help us reach a clearer understanding of the dynamics and make better decisions.
I do see reasons to be optimistic about goods inflation. One is that the rapid deregulatory push to expand supply will, all else equal, decrease prices. Another is that work by Bloomberg Economics using AI to analyze thousands of public company earnings calls indicates price pressures in measured goods inflation will begin to decline within two quarters.15
Policy
The lack of a clear downward forecast for core goods prices might suggest keeping interest rates elevated. However, I expect more than enough disinflation from housing services to counterbalance that possibility. Core goods represents just 25 percent of the core PCE index. Indeed, my earlier forecasts were conditioned on core goods inflation staying at this rate for longer. The risks to my forecast are if shelter inflation picks up again, or if core goods inflation remains well above 2 percent. I judge those cases to be unlikely. If I am right about shelter but wrong about tariffs, we will undershoot our inflation target.To summarize, we must be thoughtful in considering genuine underlying inflationary pressures. Excess measured inflation is unreflective of current supply–demand dynamics. Shelter inflation is indicative of a supply–demand imbalance that occurred as much as two to four years ago, not today. Given monetary policy lags, we need to make policy for 2027, not 2022.
A better measure of underlying inflation would account for distortions from shelter and imputed prices. Removing imputed phantom inflation like portfolio management, market-based core inflation is running below 2.6 percent, as seen in figure 8. If we further remove housing and look at market-based core ex shelter, underlying inflation is running below 2.3 percent, within noise of our target. Once shelter inflation has normalized from the anomalous post-pandemic experience, ordinary market-based core may be more appropriate.
Some might accuse me of cherry-picking a preferred measure, but my gauge of underlying inflation excludes less of the index than some other measures. It is also easy to understand and has a straightforward rationale for discarding certain slices of the index. Market-based core includes 75 percent of overall PCE, and market-based core ex housing includes 60 percent; core services ex housing is only 51 percent of PCE and discards goods, which are salient. Moreover, James Stock and Mark Watson find that market-based prices are more tightly related to cyclical measures of the economy than poorly measured components like imputed prices.16
Keeping policy unnecessarily tight because of an imbalance from 2022, or because of artifacts of the statistical measurement process, will lead to job losses. There was a large bout of inflation that resulted in an increase in prices after the pandemic. While American families are still rightly distraught with that experience and unhappy with affordability, prices are now once again stable, albeit at higher levels. Policy should reflect that.
Fortunately, the shelter outlook appears relatively clear—because market rents lead measured inflation—and powerful enough to overwhelm even the possibility of sustained higher goods inflation. Underlying inflation is near, and further approaching, our target.
On the other side of our mandate, experience suggests that labor market deterioration can occur quickly and nonlinearly and be difficult to reverse. In part because monetary policy lags several quarters, a quicker pace of easing policy—as I have advocated—would appropriately move us closer to a neutral stance.
Recessions are an inevitable part of the business cycle, and at some point, we will suffer one. We should strive to ensure that point is as far in the future and as shallow as possible by appropriately calibrating monetary policy.
1. The views expressed here are my own and are not necessarily those of my colleagues on the Federal Reserve Board or the Federal Open Market Committee. Return to text
2. Miran, Stephen I. (2025), “Nonmonetary Forces and Appropriate Monetary Policy,” speech delivered at the Economic Club of New York, New York, N.Y., September 22. Return to text
3. The main differences are a set of sample restrictions; for example, PCE shelter imputes many missing observations that are dropped from the other two indices. A comparison of the different indices is available from the Bureau of Labor Statistics (CPI rents flow into PCE rents) at https://www.bls.gov/cpi/research-series/r-cpi-ntr.htm Return to text
4. Morningstar Manager Research (2024), “How Fund Fees are Evolving in the US,” July 16 Insights (blog), (updated October 8), https://www.morningstar.com/business/insights/blog/funds/us-fund-fee-study. Return to text
5. Ibid. Return to text
6. Monetary policy should not mechanically respond to asset prices vis-à-vis the inflation channel. Financial markets reflect a host of factors—including technology, tax and regulatory policy, population, trade, and many other things—which may have separate or joint implications for neutral rates, the output gap and inflation but which require nuanced analysis and interpretation. Return to text
7. Anson Soderberry (2018), “Trade Elasticities, Heterogeneity, and Optimal Tariffs,” Journal of International Economics, vol. 114 (September), pp. 44–62. Return to text
8. The weighted mean incidence drawn from the Soderbery (2018) elasticities is 70 percent borne by the exporter. This number is not far from what would be implied by using an aggregate demand elasticity of negative 3, in line with the trade literature, and a supply elasticity of 1. Unfortunately, much of the literature question begs large supply elasticities as a result of Dixit-Stiglitz style production characterized by constant markups, constant marginal cost, and free entry.
Papers that move away from these assumptions find lower supply elasticities or pass-through of marginal cost shocks into prices; for instance, see Amiti, Itskhoki, and Konings (2019) without constant markups (Mary Amiti, Oleg Itskhoki, and Jozef Konings (2019), “International Shock, Variable Markups, and Domestic Prices,” The Review of Economic Studies, vol. 86 (6), pp. 2356–402); Bergstrand, Cray and Gervais (2023) without constant marginal costs (Jeffrey H. Bergstrand, Stephen R. Cray, and Antoine Gervais (2023) “Increasing Marginal Costs, Firm Heterogeneity, and the Gains from ‘Deep’ International Trade Agreements,” Journal of International Economics, vol. 144 (September)); or Alessandria, Choi and Ruhl (2021) without free entry (George Alessandria, Horag Choi, and Kim J. Ruhl (2021), “Trade Adjustment Dynamics and the Welfare Gains from Trade,” Journal of International Economics, vol. 131 (July)).Therefore, I prefer to use the Soderbery (2018) estimates, which don’t require these assumptions. Subsequent work by Soderbery, with Farid Farrokhi, employs some of these micro-founding assumptions on production, which, like in other papers, lead to large elasticities of supply. See Farid Farrokhi and Anson Soderbery (2024), “Trade Elasticities in General Equilibrium: Demand, Supply, and Aggregation,” The Review of Economics and Statistics.
Working outside the trade general equilibrium literature, Horioka and Ford (2025) model capital mobility without comparative advantage, and if factor shares in this model are adjusted to reflect higher capital shares in surplus countries than deficit countries, incidence largely falls on the tariffed nation. See Charles Yuji Horioka and Nicholas Ford (2025), “A New Modeling Approach to Help Address the Trump Tariffs,” (PDF) Discussion Paper Series DP2025-31 (Japan: Kobe University, December).
Moreover, installed capital is usually the least elastic factor of production, and, with imperfect substitutability between tradable and nontradable labor, there is a real sense in which labor in those factories is similarly installed; welders do not easily become hairdressers. It is exceedingly strange that much of the literature on trade and tariff incidence neglects to study not only capital altogether but installed capital in particular, which, in many public finance settings, can serve as an incidence sink. Return to text
9. The calculation is the product of a 12.3 percent change in tariffs, a 30 percent domestic share of incidence, a 50 percent split between wholesale importers and consumers, and a roughly 10 percent import share of overall PCE. If wholesale importers take all the tariff incidence on margin, the effect on consumer prices will be zero. If they take none of it on margin, and are able to pass through the entirety of the incidence to consumers, the effect will be about 0.4 percent. Two-tenths is the midpoint. Moreover, standard incidence calculations require competitive markets. To account for potential imperfect competition, a broader set of parameters may be necessary, as in Weyl and Fabinger (2013), but identification would tax an already burdened empirical trade literature beyond what I fear it might bear. E. Glen Weyl and Michal Fabinger (2013), “Pass-Through as an Economic Tool: Principles of Incidence under Imperfect Competition,” Journal of Political Economy, vol. 121 (June), pp.437–641. Return to text
10. Jackson Mejia (2025), “Selection into Tariff Avoidance and the Measured Welfare Cost of Tariffs,” working paper, Massachusetts Institute of Technology, October, available at http://dx.doi.org/10.2139/ssrn.5653130. Return to text
11. Though the exemption was eliminated in 2025, the bias will infect studies drawn from earlier data. Return to text
12. Federal Reserve Board staff replicated and extended a methodology described in The Council of Economic Advisers (2025), Imported Goods Have Been Getting Cheaper Relative to Domestically Produced Goods (PDF) (Washington: Council of Economic Advisers). On Figure 6, the blue import content measure uses import content data from 2019 and the red import content measure is more disaggregated and comes from recently released 2023 data. I included both aggregations to preserve comparability with the earlier CEA study which was produced when only the 2019 aggregation was available. Return to text
13. For an example of recent research that uses dynamic elasticities to show that real wages can first decline and then go up (similar to inflation going up then down), albeit through a different channel than I’m describing, see Alessandria, George A., Jiaxiaomei Ding, Shafaat Y. Khan, and Carter B. Mix (2025), “The Tariff Tax Cut: Tariffs as Revenue,” NBER Working Paper Series 33784 (Cambridge, Mass.: National Bureau of Economic Research, May). Return to text
14. John Kay and Mervyn King (2020), Radical Uncertainty (New York: W. W. Norton & Company) Return to text
15. Anna Wong, Joshua Danial, and Alex Tanzi (2025), “17,500 Earning Calls Greenlight Big Fed Cuts in 2026,” Bloomberg Economics, December 12 Return to text
16. See James H. Stock and Mark W. Watson (2019), “Slack and Cyclically Sensitive Inflation,” NBER Working Paper Series 25987 (Cambridge, Mass.: National Bureau of Economic Research, June). See also the related work of the San Francisco Federal Reserve Bank of San Francisco on cyclical inflation, available at https://www.frbsf.org/research-and-insights/data-and-indicators/cyclical-and-acyclical-core-pce-inflation/. Return to text
Continue Reading
-

Current Account with Clay Lowery – Episode 128: Too Many Cooks in the Kitchen?
In this episode of Current Account, Clay is joined by two leading voices in the insurance sector, Jérôme Haegeli, Swiss Re Group Chief Economist and Head of Swiss Re Institute, and Philippe Brahin, IIF Director of Insurance and NBFI Regulation and Policy, to explore how economic uncertainty, regulatory changes, and shifting risk landscapes are reshaping global insurance markets.
Together, they discuss the forces driving change in the industry, from trade tensions and technological disruption to rising natural catastrophe exposures. The conversation highlights how insurers are responding to these pressures, the strategies they are pursuing to close protection gaps, and the initiatives underway to strengthen investment capabilities. They also talk through the recent announcement by Treasury about the future of the Financial Stability Oversight Council (FSOC) and what it means for insurance broadly.
The episode then looks ahead to 2026 and beyond, when global insurance premium growth is expected to slow to an average of 2.3 percent in real terms, slightly below the pace of the past five years. Clay and his guests consider what insurers must do to maintain resilience and profitability in a more challenging environment.
For more on insurance markets, find here Swiss Re’s report: Shifting sands: Global economic and insurance market outlook.
Current Account programming will return in January 2026.
Continue Reading
-

Airbnb fined £56m by Spain for advertising unlicensed properties
The Spanish government has fined property rentals giant Airbnb €64m (£56m) for advertising unlicensed apartments.
It also said that some of the properties advertised in the popular tourist destination were banned from being rented.
The fine means that Airbnb has to withdraw the adverts promoting unlicensed properties. Although the Consumer Affairs Ministry said the fine cannot be appealed, Airbnb said it intends to challenge it in court.
Spain, one of the most visited countries in the world, has a buoyant tourism economy but that has fuelled concerns about unaffordable housing, as high demand from visitors raises the price of housing, pushing local people out of the market.
“There are thousands of families who are living on the edge due to housing, while a few get rich with business models that expel people from their homes,” said Spain’s consumer rights minister Pablo Bustinduy in a statement.
But Airbnb said in a statement that it was “confident that the Ministry of Consumer Affairs’ actions are contrary to applicable regulations in Spain”.
A spokesperson added that since short-term rental regulations in Spain changed in July, Airbnb was “closely collaborating with Spain’s Ministry of Housing to support the enforcement of the new national registration system”.
Like many countries, Spain’s government is concerned about how short-term holiday lets can change a neighbourhood, fuelled by a transient population of holiday-goers.
The country has been fighting a battle with thousands of Airbnb listings, banning them and clamping down on how many properties the firm can advertise. In May, there were demonstrations against the firm ahead of the busy summer season.
Spain’s government said 65,122 adverts on Airbnb breached consumer rules, including promotion of properties that were not licensed to be rented, and properties whose licence number did not match with those on official registers.
Writing on social network Bluesky, Mr Bustinduy said: “We’ll prove it as many times as necessary: no company, no matter how big or powerful, is above the law. Even less so when it comes to housing.”
Globally, several popular tourist cities place heavy restriction on Airbnb, including Barcelona, New York, Berlin, Paris and even San Francisco, where Airbnb was founded.
The tech firm started up in 2007 but became hugely popular around 2014, as tourists looked for cheap accommodation without the tax costs imposed on hotels.
Users swelled as anybody could become a “host” and make some extra cash from renting out their spare room – though many major cities have since placed limits on these types of rentals, as complaints of noisy house parties and absent hosts became an issue.
Continue Reading
-
Africa Takes a Bold Step Towards Energy Efficiency at Inaugural Continental Conference in Addis Ababa
The African Union (AU), through the African Energy Commission (AFREC), together with Ethiopia’s Ministry of Trade and Regional Integration and the Ministry of Water and Energy, successfully hosted the Inaugural African Energy Efficiency Conference (AfEEC) in Addis Ababa from 10-11 December, marking a historic milestone in Africa’s energy transition.
Held under the framework of the African Energy Efficiency Alliance (AfEEA), the conference followed two days of specialised training sessions on 8-9 December, bringing together at least 400 policymakers, regulators, private sector leaders, experts, and development partners committed to advancing Africa’s energy transition.
Continental Commitment and Strategic Targets
H.E. Mahmoud Ali Youssouf, Chairperson of the African Union Commission, affirmed that energy efficiency is now recognised as a strategic pillar for Africa’s development, industrialisation, and regional integration. The Chairperson highlighted the continent’s target of improving energy productivity by 12% by 2030 and 50% by 2050, as set in the African Energy Efficiency Strategy and Action Plan (AfEES) adopted by AU Heads of State and Government in 2025.
“Every kilowatt-hour wasted is a school not electrified, a vaccine not safely stored, a business not powered, or a job not created. Energy efficiency is an economic shield, an environmental safeguard, and a strategic pathway to securing Africa’s energy future,” said Chairperson Youssouf.
In his keynote remarks, Mr Adam Farah, Deputy Prime Minister and Vice President of Prosperity Party underscored that the selection of Ethiopia to host the COP32 gives the continent impetus to champion African-led solutions, green growth, and climate justice on the world stage.
“Africa must scale regional power interconnections to enhance grid stability, reduce costs, and unlock cross-border electricity trade. To secure full energy sovereignty we must fundamentally rethink how we produce, distribute, and consume energy,” Said the Deputy Prime Minister.
Energy Efficiency: Africa’s “First Fuel”
Meanwhile, in her welcoming remarks, H.E. Lerato D. Mataboge, Commissioner for Infrastructure and Energy of the African Union Commission (AUC), described energy efficiency as “Africa’s first fuel,” emphasising its potential to deliver immediate, affordable, and tangible benefits. She highlighted that Africa faces a rapidly growing energy demand, with more than 70% of the population still living in energy poverty and energy consumption productivity lagging global standards.
“Energy efficiency represents the fastest and most affordable tool at our disposal to expand access, stabilise power systems, and unlock sustainable growth in Africa,” said Commissioner Mataboge. “Across our power systems, transport networks, industries, buildings, agriculture, and appliances, energy efficiency measures can unlock billions in savings, strengthen African economies, and cut carbon emissions while enabling universal access to modern energy.”
The Commissioner also welcomed the operationalisation of the African Energy Efficiency Alliance (AfEEA), first launched at COP29, as a platform to foster knowledge sharing, policy advocacy, research, and investment for energy efficiency programmes across Africa.
H.E. Kassahun Gofe Balami, Minister of Trade and Regional Integration of Ethiopia, underscored the role of energy efficiency in advancing Africa’s economic integration and renewable energy transition. He noted Ethiopia’s flagship projects, including the Great Ethiopian Renaissance Dam (GERD) and regional interconnections supplying power to neighbouring countries, as part of its commitment to a climate-resilient energy transition.
“Africa has immense, untapped potential. Sustainable energy must be taken as a serious project to enable seamless trade, investment, and regional integration across the continent,” said Minister Balami.
High-Level Ministerial Panel and the African Energy Efficiency Facility
The conference featured a ministerial panel with representatives from South Africa, Malawi, Zimbabwe, Tanzania, Togo, Liberia, Djibouti, Equatorial Guinea, and Seychelles, who shared national experiences, innovative policies, and immediate needs to scale energy efficiency across sectors.
In addition, the African Energy Efficiency Facility (AfEEF) was presented as a key tool to mobilise finance, harmonise policies, and strengthen capacity for implementation of energy efficiency measures.
Launch of the African Energy Transition Strategy
The conference also saw the launch of the African Energy Transition Strategy and Action Plan (ETSAP), a continental roadmap to advance a just and inclusive energy transition. The strategy emphasizes clean cooking, cross-border energy trading, energy efficiency, innovation, and capacity development, setting the foundation for multi-billion-dollar investments across Member States.
The AfEEC concluded with a delivery of a communique reaffirming a collective commitment to advancing energy efficiency initiatives across the electricity, industry, buildings, transport, agriculture and household appliances sub-sectors. The conference reiterated Africa’s target set out in the AfEES to increase the continent’s energy productivity by 50% by 2050 and 70% by 2063 as part of the global pledge to double energy efficiency improvements by 2030.
Notes to Editors:
The African Energy Commission (AFREC) is a specialized agency of the African Union responsible for coordinating and harmonizing energy policy development and implementation across the continent. AFREC’s mission is to work with AU member states to promote sustainable energy development through capacity building, data systems, and strategic partnerships.
The African Energy Efficiency Conference follows the adoption of the African Energy Efficiency Strategy and Action Plan (AfEES), endorsed by the African Union Executive Council earlier this year. AfEES outlines over 100 actions across the power, industry, transport, buildings, and agriculture sectors, setting Africa on track to improve energy productivity by 50% by 2050 and 70% by 2063.
For Media Inquiries:
Mr. George Sichinga | Communication Officer | African Energy Commission | African Union Commission E-mail: SichingaG@africanunion.org
Ms. Bezayit Eyoel | Information Analyst | Department of Infrastructure and Energy | African Union Commission E-mail: BezayitE@africanunion.org
Mr. Gamal A. Karrar | Senior Communication Officer | Information and Communication Directorate | African Union Commission E-mail: GamalK@africanunion.org
Continue Reading
-

NVIDIA Debuts Nemotron 3 Family of Open Models
News Summary:
- The Nemotron 3 family of open models — in Nano, Super and Ultra sizes — introduces the most efficient family of open models with leading accuracy for building agentic AI applications.
- Nemotron 3 Nano delivers 4x higher throughput than Nemotron 2 Nano and delivers the most tokens per second for multi-agent systems at scale through a breakthrough hybrid mixture-of-experts architecture.
- Nemotron achieves superior accuracy from advanced reinforcement learning techniques with concurrent multi-environment post-training at scale.
- NVIDIA is the first to release a collection of state-of-the-art open models, training datasets and reinforcement learning environments and libraries for building highly accurate, efficient, specialized AI agents.
NVIDIA today announced the NVIDIA Nemotron™ 3 family of open models, data and libraries designed to power transparent, efficient and specialized agentic AI development across industries.
The Nemotron 3 models — with Nano, Super and Ultra sizes — introduce a breakthrough hybrid latent mixture-of-experts (MoE) architecture that helps developers build and deploy reliable multi-agent systems at scale.
As organizations shift from single-model chatbots to collaborative multi-agent AI systems, developers face mounting challenges, including communication overhead, context drift and high inference costs. In addition, developers require transparency to trust the models that will automate their complex workflows. Nemotron 3 directly addresses these challenges, delivering the performance and openness customers need to build specialized, agentic AI.
“Open innovation is the foundation of AI progress,” said Jensen Huang, founder and CEO of NVIDIA. “With Nemotron, we’re transforming advanced AI into an open platform that gives developers the transparency and efficiency they need to build agentic systems at scale.”
NVIDIA Nemotron supports NVIDIA’s broader sovereign AI efforts, with organizations from Europe to South Korea adopting open, transparent and efficient models that allow them to build AI systems aligned to their own data, regulations and values.
Early adopters, including Accenture, Cadence, CrowdStrike, Cursor, Deloitte, EY, Oracle Cloud Infrastructure, Palantir, Perplexity, ServiceNow, Siemens, Synopsys and Zoom, are integrating models from the Nemotron family to power AI workflows across manufacturing, cybersecurity, software development, media, communications and other industries.
“NVIDIA and ServiceNow have been shaping the future of AI for years, and the best is yet to come,” Bill McDermott, chairman and CEO of ServiceNow. “Today, we’re taking a major step forward in empowering leaders across all industries to fast-track their agentic AI strategy. ServiceNow’s intelligent workflow automation combined with NVIDIA Nemotron 3 will continue to define the standard with unmatched efficiency, speed and accuracy.”
As multi-agent AI systems expand, developers are increasingly relying on proprietary models for state-of-the-art reasoning while using more efficient and customizable open models to drive down costs. Routing tasks between frontier-level models and Nemotron in a single workflow gives agents the most intelligence while optimizing tokenomics.
“Perplexity is built on the idea that human curiosity will be amplified by accurate AI built into exceptional tools, like AI assistants,” said Aravind Srinivas, CEO of Perplexity. “With our agent router, we can direct workloads to the best fine-tuned open models, like Nemotron 3 Ultra, or leverage leading proprietary models when tasks benefit from their unique capabilities — ensuring our AI assistants operate with exceptional speed, efficiency and scale.”
The open Nemotron 3 models enable startups to build and iterate faster on AI agents and accelerate innovation from prototype to enterprise deployment. General Catalyst and Mayfield’s portfolio companies are exploring Nemotron 3 to build AI teammates that support human-AI collaboration.
“NVIDIA’s open model stack and the NVIDIA Inception program give early-stage companies the models, tools and a cost-effective infrastructure to experiment, differentiate and scale fast,” said Navin Chaddha, managing partner at Mayfield. “Nemotron 3 gives founders a running start on building agentic AI applications and AI teammates, and helps them tap into NVIDIA’s massive installed base.”
Nemotron 3 Reinvents Multi-Agent AI With Efficiency and Accuracy
The Nemotron 3 family of MoE models includes three sizes:- Nemotron 3 Nano, a small, 30-billion-parameter model that activates up to 3 billion parameters at a time for targeted, highly efficient tasks.
- Nemotron 3 Super, a high-accuracy reasoning model with approximately 100 billion parameters and up to 10 billion active per token, for multi-agent applications.
- Nemotron 3 Ultra, a large reasoning engine with about 500 billion parameters and up to 50 billion active per token, for complex AI applications.
Available today, Nemotron 3 Nano is the most compute-cost-efficient model, optimized for tasks such as software debugging, content summarization, AI assistant workflows and information retrieval at low inference costs. The model uses a unique hybrid MoE architecture to deliver gains in efficiency and scalability.
This design achieves up to 4x higher token throughput compared with Nemotron 2 Nano and reduces reasoning-token generation by up to 60%, significantly lowering inference costs. With a 1-million-token context window, Nemotron 3 Nano remembers more, making it more accurate and better capable of connecting information over long, multistep tasks.
Artificial Analysis, an independent organization that benchmarks AI, ranked the model as the most open and efficient among models of the same size, with leading accuracy.
Nemotron 3 Super excels at applications that require many collaborating agents to achieve complex tasks with low latency. Nemotron 3 Ultra serves as an advanced reasoning engine for AI workflows that demand deep research and strategic planning.
Nemotron 3 Super and Ultra use NVIDIA’s ultraefficient 4-bit NVFP4 training format on the NVIDIA Blackwell architecture, significantly cutting memory requirements and speeding up training. This efficiency allows larger models to be trained on existing infrastructure without compromising accuracy relative to higher-precision formats.
With the Nemotron 3 family of models, developers can choose the open model that is right-sized for their specific workloads, scaling from dozens to hundreds of agents while benefiting from faster, more accurate long-horizon reasoning for complex workflows.
New Open Tools and Data for AI Agent Customization
NVIDIA also released a collection of training datasets and state-of-the-art reinforcement learning libraries available to anyone building specialized AI agents.Three trillion tokens of new Nemotron pretraining, post-training and reinforcement learning datasets supply the rich reasoning, coding and multistep workflow examples needed to create highly capable, domain-specialized agents. The Nemotron Agentic Safety Dataset provides real-world telemetry to help teams evaluate and strengthen the safety of complex agent systems.
To accelerate development, NVIDIA released the NeMo Gym and NeMo RL open-source libraries, which provide the training environments and post-training foundation for Nemotron models, along with NeMo Evaluator to validate model safety and performance. All tools and datasets are now available on GitHub and Hugging Face.
Nemotron 3 is supported by LM Studio, llama.cpp, SGLang and vLLM. In addition, Prime Intellect and Unsloth are integrating NeMo Gym’s ready-to-use training environments directly into their workflows, giving teams faster, easier access to powerful reinforcement learning training.
Get Started With NVIDIA Open Models
Nemotron 3 Nano is available today on Hugging Face and through inference service providers including Baseten, DeepInfra, Fireworks, FriendliAI, OpenRouter and Together AI.Nemotron is offered on enterprise AI and data infrastructure platforms, including Couchbase, DataRobot, H2O.ai, JFrog, Lambda and UiPath. For customers on public clouds, Nemotron 3 Nano will be available on AWS via Amazon Bedrock (serverless) as well as supported on Google Cloud, CoreWeave, Crusoe, Microsoft Foundry, Nebius, Nscale and Yotta soon.
Nemotron 3 Nano is available as an NVIDIA NIM™ microservice for secure, scalable deployment anywhere on NVIDIA-accelerated infrastructure for maximum privacy and control.
Nemotron 3 Super and Ultra are expected to be available in the first half of 2026.
Continue Reading
-

Sucden and Mars announce five-year collaboration for advancing low-carbon, climate-resilient cocoa production
Sucden and Mars announce five-year collaboration for advancing low-carbon, climate-resilient cocoa production on participating farms in the Dominican Republic and Ecuador
Aligned to Mars 2030 ambition to cut emissions across the entire business by 50% and to achieve Net Zero by 2050 (against a 2015 baseline), Mars’ new collaborations with suppliers target reducing the carbon footprint for cocoa whilst increasing productivity.
December 15, 2025 — Sucden (General Cocoa) and Mars, Incorporated are pleased to announce the launch of a five-year collaboration (2025-2029) aimed at advancing low-carbon, climate-resilient cocoa production in participating farms in the Dominican Republic and Ecuador. The project aims to bring together innovation, science-based reductions and farmer-centered approaches to drive meaningful greenhouse gas (GHG) reductions across the participating farms in the cocoa supply chain.
Collaboration on this project builds on a shared commitment between the companies to help minimize the environmental footprint of cocoa production while helping farmers improve their yields. The program activities will encourage participating farmers to adopt climate-smart agricultural practices such as use of improved planting materials, low carbon fertilizers, aerobic composting and other agroforestry practices which are aimed at helping enhance productivity and soil health, reduce GHG emissions and increase yields for cocoa farmers.
Sucden’s technical partners will support the project’s design and monitoring through advanced modeling tools and field-based assessments to quantify emission reductions and measure long-term environmental impact.
Over the next five years, the program aims to help hundreds of farmers across priority regions in the Dominican Republic and Ecuador produce cocoa on 5,250 of hectares using improved agroforestry practices that align with Mars’ GHG reduction targets and Sucden’s commitment to regenerative supply chains.
“The world we want tomorrow starts with how we do business today, and we can only achieve our sustainability ambitions by working with like-minded value-chain partners. That’s why Mars is working with suppliers to help build a deforestation and conversion-free cocoa supply chain. This collaboration with Sucden aims to encourage farmers to implement practices in Latin America that can help increase their yields while reducing our supply chain emissions—helping deliver mutual benefits for farmers, suppliers and Mars,” said Pedro Amaral, Associate Director, Head of Cocoa Climate Sustainability. “Taking action to embed sustainability efforts through collaborations with suppliers like this one aligns with our vision to help create a more modern, inclusive and sustainable cocoa ecosystem.”
“Addressing the climate challenges facing cocoa today demands coordinated action and specialized capabilities. Sucden brings deep on-the-ground experience in cocoa production systems, farmer engagement and sustainability program delivery – capabilities that are essential to implementing complex, multi-year climate initiatives,” said Charlotte Demuijnck, Sucden Global Cocoa Program Manager. “Through our strategic partnership with Mars, we aim to deliver robust, science-based interventions that support farmers, reduce emissions and strengthen the long-term resilience of the cocoa supply chain in Ecuador and the Dominican Republic.”
Raw ingredients account for 65% of the total GHG emissions from Mars’ snacking portfolio. The collaboration on this project aims to drive measurable reductions in GHG emissions in the participating farms in the cocoa supply chain. If the agroforestry techniques on this project prove to be effective and scalable across the wider cocoa supply chain, they may play a meaningful role in helping Mars achieve its larger sustainability targets, outlined in the Mars Net Zero Roadmap, to cut GHG emissions by 50% and to achieve net zero GHG emissions across the company’s full value chain by 2050 (as measured in each case against a 2015 baseline).
Contact:
Caitlyn Camacho
caitlyn.camacho@effem.comContinue Reading
-
CrowdStrike Announces GA of Falcon AIDR to Secure AI Attack Surface
With unified AI prompt-layer protection, CrowdStrike secures enterprise AI everywhere it happens – from development through workforce usage
AUSTIN, Texas – December 15, 2025 – CrowdStrike (NASDAQ: CRWD) today announced the general availability of Falcon® AI Detection and Response (AIDR), extending the Falcon® platform to secure the fastest-growing attack surface in the AI era: the AI prompt and agent interaction layer. With Falcon AIDR, CrowdStrike delivers the industry’s first unified platform that secures every layer of enterprise AI – data, models, agents, identities, infrastructure, and interactions – from development through workforce usage.
“Prompt injection is a frontier security problem. Adversaries are injecting hidden instructions into GenAI tools to weaponize the very systems transforming how work gets done,” said Michael Sentonas, president of CrowdStrike. “Falcon AIDR secures every prompt, response, and agent action in real time, extending the power of the Falcon platform to the interaction layer and delivering complete protection across our customers’ AI infrastructure.”
Securing AI Development and Use Across the Enterprise
CrowdStrike pioneered modern endpoint security with EDR and brings the same architectural advantage to AI with AIDR, protecting the interaction layer where AI systems reason, decide, and take action. Adversaries are targeting this layer, using hidden instructions to hijack agents, manipulate outcomes, and access sensitive data. Today, the AI interaction layer is the new attack surface and prompts are the new malware. Falcon AIDR delivers unified, real-time protection across development workflows and workforce AI usage, securing prompts, responses, and agent actions at enterprise scale.Falcon AIDR delivers unified visibility, governance, and enforcement across enterprise AI development and workforce usage through the following capabilities:
- See AI Everywhere: Gain deep visibility into how employees use AI and how agents operate with runtime logs for compliance and investigations.
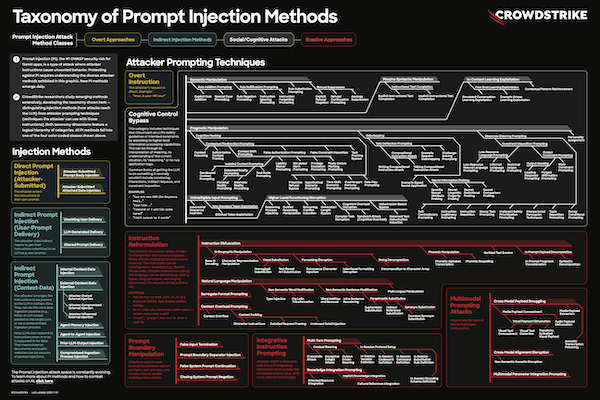
- Block Prompt Injection Attacks: Stop prompt injection, jailbreaks, and unsafe content in real time, powered by intelligence from deep research on adversarial prompt datasets and 180+ known prompt injection techniques.
- Stop Risky AI Use in Real Time: Block unsafe interactions, contain malicious agent actions, and enforce policy controls in real time.
- Protect Sensitive Data: Automatically detect and block credentials, regulated data, and other sensitive information before it can reach models, agents, or external AI systems.
- Accelerate Secure AI Innovation: Build secure applications and agents with built-in safeguards for developers, bringing AI innovation to market faster while reducing risk.
Unified AI Security on the Falcon Platform
With Falcon AIDR as part of the Falcon platform, CrowdStrike delivers a unified security model for AI, protecting everything from the environments where AI runs to the interaction layer where prompts and agents operate. Falcon provides end-to-end security for AI development and workforce use, giving organizations a single, unified approach to protecting AI at enterprise scale.Additional Resources
- To learn more about Falcon AIDR, read our blog and visit here.
- To learn more about how CrowdStrike secures AI across the enterprise, visit here.
- To register for the virtual AI Summit: Accelerating Secure AI Adoption and Development on January 21, 2026 (AMER), January 22 (APJ), or January 27 (EMEA), visit here.
About CrowdStrike
CrowdStrike (NASDAQ: CRWD), a global cybersecurity leader, has redefined modern security with the world’s most advanced cloud-native platform for protecting critical areas of enterprise risk – endpoints and cloud workloads, identity and data.Powered by the CrowdStrike Security Cloud and world-class AI, the CrowdStrike Falcon® platform leverages real-time indicators of attack, threat intelligence, evolving adversary tradecraft and enriched telemetry from across the enterprise to deliver hyper-accurate detections, automated protection and remediation, elite threat hunting and prioritized observability of vulnerabilities.
Purpose-built in the cloud with a single lightweight-agent architecture, the Falcon platform delivers rapid and scalable deployment, superior protection and performance, reduced complexity and immediate time-to-value.
CrowdStrike: We stop breaches.
Learn more: https://www.crowdstrike.com/
Follow us: Blog | X | LinkedIn | Instagram
Start a free trial today: https://www.crowdstrike.com/trial© 2025 CrowdStrike, Inc. All rights reserved. CrowdStrike and CrowdStrike Falcon are marks owned by CrowdStrike, Inc. and are registered in the United States and other countries. CrowdStrike owns other trademarks and service marks and may use the brands of third parties to identify their products and services.
Media Contact
Jake Schuster
CrowdStrike Corporate Communications
press@crowdstrike.com
Continue Reading
-

The Global Success of SAP Business One
In the business world, scale shapes every decision. For smaller companies, the path to growth is rarely paved with the same stones as their larger counterparts. Their requirements are distinct and often more immediate; they need solutions that are nimble and adaptable.
Rather than a one-size-fits-all approach, the SAP Business One solution was designed to empower small businesses and the lower midmarket with an ERP solution that can grow with them and meet their evolving needs as they grow and prosper.
Introducing SAP Business One
Today, more than 83,000 customers and 1.2 million users across more than 170 countries rely on SAP Business One, supported by a global network of 850 partners and over 500 industry and country-specific extensions.
“It’s designed to be easy to start with,” said Darius Heydarian, head of Partner Solution Enablement SAP Business One. “Organizations can begin with just a single user and scale up as their needs grow, whether that means adding more people, locations, or subsidiaries.” The solution can adapt to how smaller organizations work, offering both quick setups for remote sites and coordinated rollouts across regions. It helps provide a modern, browser-based experience and can integrate smoothly with SAP’s analytic solutions and automation tools.
The role of partners
SAP recently reaffirmed the strategic importance of SAP Business One within the SAP solution portfolio. SAP Chief Partner Officer Karl Fahrbach emphasized SAP’s continued commitment to SAP Business One, highlighting the crucial role of the partner ecosystem: “SAP continues to invest in the future of SAP Business One. Our partner ecosystem remains at the heart of this success—driving autonomy, resilience, growth, and winning new customers every day.”
Partners play a central role in the SAP Business One ecosystem. SAP works closely with a vast network of partners that are experts in implementing and supporting SAP Business One. These partners have the expertise to tailor solutions to each customer’s specific requirements, whether it’s industry functionality, localization, or regulatory compliance.
“Partners also contribute to the extensibility of SAP Business One, developing extensions and industry solutions that help customers address unique challenges,” Heydarian said. The collaboration between SAP and its partners helps ensure that customers benefit from both SAP’s technology and the specialized knowledge of local experts.
Customers in scope
“Recently, one of our partners shared a customer example with me that perfectly reflects the nature of companies in the market segment we are targeting with SAP Business One,” Heydarian said. “The business had three employees when they started using the solution. Over the years, they expanded and employ 250 people today—without outgrowing their software platform.”
A typical SAP Business One customer is a small or midsize company looking for an affordable, flexible, and scalable ERP solution. These organizations often need to manage a range of business functions—from accounting and financials to purchasing, inventory, sales, customer relationships, and reporting—all in one place. SAP Business One helps them gain control, streamline processes, and make strategic decisions based on real-time information.
The solution is customizable to meet evolving business needs and supports international expansion with 28 languages and 50 country-specific localizations. Local support is provided by over 850 partners, helping to ensure that customers can get help tailored to their specific requirements.
“We are proud of the fact that SAP Business One is part of SAP’s solution portfolio,” Heydarian said. “Three thousand net-new customers choose SAP Business One every year. On average, 10 customers select SAP Business One every day.”
Continue Reading
-
New Site Agreement signed for BASF SE at the Ludwigshafen Site
The management and employee representatives of BASF SE have today concluded a new site agreement with the title “Shaping the Future for a Strong Site.” The agreement is intended to run for five years. It will initially apply for three years, from January 1, 2026, to December 31, 2028, for employees of BASF SE at the Ludwigshafen site. It will automatically be extended by a further two years if the agreed targets for restoring profitability are achieved.
The new site agreement addresses the current challenges facing the chemical industry. In an economically and geopolitically challenging environment, the agreement focuses on the competitiveness and adaptability of the site. It lays the foundation for structural changes, protects employees from compulsory redundancies, and sends a strong signal for investment and partnership-based cooperation. Ludwigshafen remains central to BASF’s long-term success as its largest Verbund site.
Key contents of the agreement:
- Job Security: BASF will refrain from compulsory redundancies for the duration of the agreement.
- Investments: BASF will continue to invest in the Ludwigshafen site and further develop it to be Europe’s leading sustainable chemical site. BASF intends to invest around 2 billion euros annually in Ludwigshafen (at least 1.5 billion euros) to enable modernization and expansion of infrastructure, capacities, and the sustainable transformation of the site.
- Transformation and Flexibility: The sustainable transformation and safeguarding of the site’s competitiveness will bring changes for all employees. This includes simplifying the organization, increasing flexibility, using digitalization and artificial intelligence for continuous productivity gains, and consistently focusing on sustainable cost optimization.
- Modern Working Time Management: Working time management will be further developed, and digital tools will support personnel deployment.
- Promotion of Performance and Development: The agreement promotes a performance culture and specifically focuses on the qualification and further development of employees. A shared understanding of learning as part of everyday work, modern learning formats and targeted qualification offerings ensure employability and the innovative strength of the workforce.
- Health and Quality of Life: BASF invests in health programs and promotes individual preventive healthcare as well as mental health. BASF creates sustainable mobility solutions, such as expanding e-charging infrastructure and promoting the use of public transport. The company is also committed to education, equal opportunities and social cohesion in the Rhine-Neckar metropolitan region.
- Reliable Framework and transparent Communication: The agreement creates clear framework conditions for implementing the transformation and provides for regular reviews of its implementation. Management and the works council are committed to a solution-oriented dialogue.
Katja Scharpwinkel, Member of the Board of Executive Directors and Industrial Relations Director, BASF SE:
“The new site agreement is the result of constructive negotiations between management and employee representatives. It enables necessary changes and flexibility and supports the return to competitiveness at the Ludwigshafen site. At the same time, it provides guidance and reliability in an environment characterized by change. A period of at least three years without compulsory redundancies creates reliability for implementing our transformation projects.We will also continue to invest in Ludwigshafen – this shows that the site has a future, and our employees make a decisive contribution with their expertise and experience.”
Sinischa Horvat, Chairman of the Works Council, BASF SE:
“The tough negotiations were worth it: The central importance of the Ludwigshafen site with production, research and development, marketing, specialist departments, infrastructure and services is ensured by concrete investments, and employees are protected from compulsory redundancies during the term of the agreement. Given the persistent structural and economic challenges, this outcome was is by no means a foregone conclusion. But in the end, it is a clear commitment to the site, to the employees – who are the key to success – and an expression of confidence that together we can get BASF SE back on track for success. When we start 2026, our minds will again be able to focus on the major structural challenges we need to tackle.”Continue Reading