LONDON/NEW YORK, Dec 12 (Reuters) – The U.S. dollar drifted higher against major currencies on Friday after falling in recent sessions, but was still set for its third straight weekly drop amid the prospect of interest rate cuts by the Federal Reserve next year. Sterling also eased after data showed the UK economy unexpectedly shrank in the three months to October.
The euro was flat at $1.1738 after hitting a more than two-month high on Thursday.
The dollar index , which measures the U.S. currency against six others, rose 0.1% to 98.39, recovering from a two-month low hit on Thursday but still on track for its third weekly decline with a 0.6% fall. For the month of December, the greenback has been 1.1% weaker so far.
The index is also down more than 9% this year, on pace for its steepest annual drop since 2017.
“It’s Friday fatigue. The dollar is down on the week and it’s pretty much down the whole month,” said Bob Savage, head of markets macro strategy at BNY in New York. “And is it because the Fed cut rates? Yes partially.”
Against the yen, the dollar rose 0.3% to 155.98 yen ahead of next week’s Bank of Japan meeting, where the broad expectation is for a rate hike. Markets are focused on comments from policymakers on how the rate path will look in 2026.
Reuters reported that the BoJ would likely maintain a pledge next week to keep raising interest rates, but stress that the pace of further hikes would depend on how the economy reacts to each increase.
The pound edged down 0.1% against the dollar to $1.3375, but was trading near a seven-week high hit on Thursday, after economic data that was likely to boost expectations for Bank of England interest rate cuts.
Both sterling and the euro are poised for their third straight week of gains against the dollar.
UNCERTAINTY OVER U.S. MONETARY POLICY NEXT YEAR
The Fed cut rates as expected this week but comments from Chair Jerome Powell and the accompanying statement were viewed by investors as less hawkish than expected and reinforced dollar-selling momentum.
“That was a neutral cut. Yes, the board is divided and we saw that in the dissents,” said BNY’s Savage. “But it’s not fair to say that the Fed is going to raise rates like what the other central banks are talking about like the ECB (European Central Bank) and RBA (Reserve Bank of Australia).”
Investors face uncertainty over the path of U.S. monetary policy next year as inflation trends and labor market strength remain unclear, with traders pricing in two rate cuts in 2026 in contrast with policymakers who see only one cut next year and one in 2027.
Fed officials who voted against the U.S. central bank’s interest rate cut this week said on Friday they are worried that inflation remains too high to warrant lower borrowing costs, particularly given the lack of recent official data about the pace of price increases.
How monetary policy evolves will hinge on economic data that is still lagging from the impact of the 43-day federal government shutdown in October and November. The U.S. is heading into a midterm-election year that is likely to focus on economic performance, with President Donald Trump urging sharper rate reductions.
Also in the spotlight for markets is the question of who will become the next Fed chair and how that will affect the growing worries about the central bank’s independence under Trump.
Across the Atlantic, sterling slipped on the back of data showing gross domestic product contracted by 0.1% in the August-to-October period. Economists polled by Reuters had forecast a flat reading.
“At this stage it is not totally clear whether the recent weakness of the economy marks a fundamental downturn or whether it reflects a pre-Budget dip in spending and whether any such moves are temporary,” said Philip Shaw, chief economist at Investec.
Finance minister Rachel Reeves delivered a tax-raising budget on November 26.
The latest data cemented bets that the BoE will cut rates next week, though such a move has been nearly fully priced in for weeks.
In other currencies, the Swiss franc steadied at 0.7951 per U.S. dollar, after rising to an almost one-month high on Thursday after the Swiss National Bank left its policy rate unchanged at 0% and said a recent agreement to reduce U.S. tariffs on Swiss goods had improved the economic outlook, even as inflation has somewhat undershot expectations.
Reporting by Joice Alves in London and Gertrude Chavez-Dreyfuss in New York; Additional reporting by Ankur Banerjee in Singapore; Editing by Alison Williams, Kirsten Donovan and Nia Williams
Disclaimer: The views expressed in this article are those of the author and may not reflect those of Kitco Metals Inc. The author has made every effort to ensure accuracy of information provided; however, neither Kitco Metals Inc. nor the author can guarantee such accuracy. This article is strictly for informational purposes only. It is not a solicitation to make any exchange in commodities, securities or other financial instruments. Kitco Metals Inc. and the author of this article do not accept culpability for losses and/ or damages arising from the use of this publication.
Giulio Cartoni, Head of Site Management & Field Support, and Luigi Pierno, Climate and Environment Strategy & Projects and certified Sustainability Manager, are a highly synergistic duo who have brought to life OnLife, Leonardo’s project designed to give corporate PCs and monitors a new purpose. Through a structured process of reuse, donation and material recovery, the initiative applies circular-economy principles to end-of-life digital devices. Giulio and Luigi form a team born from close cooperation between Leonardo’s Sustainability and Digital Solutions departments. They have successfully tackled a new project: transforming the management of end-of-life devices into a process that combines resilience, social impact and a reduced environmental footprint.
“It was an exciting challenge. There was no existing model within the company, so we created new procedures and strengthened our collaborative network,” explains Giulio Cartoni, who holds a Master’s degree in Political Science and International Relations and joined Leonardo eight years ago after holding senior positions in the TLC and IT sectors.
“Driving this project has been a great adventure, allowing me to work simultaneously on all three pillars of sustainability – Prosperity, People and Planet – and to contribute concretely to the circular transition,” adds Luigi Pierno, an electronic engineer who has been with the Leonardo Group since 2000, working for many years in research and innovation.
Giulio and Luigi give concrete form to the three pillars of the OnLife project. The first line of action focuses on reusing digital devices within the secondary market (Prosperity): in this initial phase, 275 PCs and monitors were collected, securely wiped and made available through online sales channels at an accessible price point. The second area (People) promotes digital inclusion: part of the decommissioned equipment is donated to non-profit organisations operating in areas with limited digital access, supporting technology uptake and promote interest in STEM subjects among the new generation. Finally, the third pillar (Planet) adopts an urban-mining approach, activating advanced recycling processes for non-reusable devices to recover critical raw materials.
Delivering a circular-economy project that generates measurable competitive value for business, society and the environment reflects Leonardo’s long-term strategic commitment to sustainability. For Giulio and Luigi, the success of OnLife represents both a professional and personal milestone, achieved together with a strong sense of purpose and great satisfaction.
NIH clinical trial shows promise for people with treatment-limited, life-threatening disorder.
A clinical trial at the National Institutes of Health (NIH) has shown that an experimental treatment for patients with severe aplastic anemia resulted in a 94% survival rate without complications following transplantation. The treatment, which deploys an expanded umbilical cord blood approach known as omidubicel, was recently approved by the U.S. Food and Drug Administration for use against severe aplastic anemia for patients without options to receive donor hematopoietic stem cell (HSC) transplantation.
Nearly all (94%) of patients had rapid neutrophil engraftment, meaning that their white blood cell count had recovered, at median of eight days, dramatically faster than standard umbilical cord transplants. By 100 days post-transplant, most patients had experienced sustained cord engraftment, which means that the transplanted donor stem cells were established in the patient’s bone marrow and able to produce healthy new blood cells long term.
“The results of this ongoing study are extremely encouraging and indicate a significant advancement in the treatment options for patients with a high unmet medical need. Patients in the study were high-risk but had significantly better than expected outcomes,” said Richard Childs, M.D., assistant U.S. Surgeon General, NIH study lead, and scientific director of NIH’s National Heart, Lung, and Blood Institute.
Severe aplastic anemia causes bone marrow to stop producing adequate blood cells, which leads to infections, bleeding, and ongoing dependence on blood transfusions. If left untreated, the disease can be fatal. Conventional treatment typically involves immunosuppressive therapy and/or HSC transplantation. However, while immunosuppressive therapy can help prolong survival, not all patients respond to it, and many relapse. Lack of a tissue-matched sibling or related donor match remains a major barrier to successful HSC transplantation. In the absence of a donor, patients can undergo umbilical cord blood transplantation, but such transplants often contain low stem-cell numbers, prolonging the time to immune recovery and substantially increasing the risk of infection and rejection of the transplant.
Omidubicel stem cell therapy involves taking limited numbers of donated umbilical cord blood stem cells, and culturing them in a lab, where they multiply and are enhanced with a form of vitamin B3, known as nicotinamide, which provides a larger, more effective stem cell dose for restoring the patient’s blood and immune system.
The clinical trial enrolled 18 patients (aged 4-60 years) with severe aplastic anemia who were unresponsive to standard immunosuppressive therapy and without an available donor.
Results from two additional study participants have yet to be analyzed. Publication of the complete trial findings are expected next year.
The promising trial results prompted the U.S. Food and Drug Administration to approve the novel transplantation approach for refractory severe aplastic anemia. The therapy’s brand name is Omisirge by Gamida Cell Ltd., Israel.
“The approval of a therapy for patients who were lacking therapeutic options is a prime example of how NIH advances patient care and helps shape the future of medicine through the development of new therapeutics,” said Childs.
The trial is ongoing. For more information, visit clincialtrials.gov and search for identifier NCT03173937.
About the National Heart, Lung, and Blood Institute (NHLBI): NHLBI is the global leader in conducting and supporting research in heart, lung, and blood diseases and sleep disorders that advances scientific knowledge, improves public health, and saves lives. For more information, visit https://www.nhlbi.nih.gov.
About the National Institutes of Health (NIH): NIH, the nation’s medical research agency, includes 27 Institutes and Centers and is a component of the U.S. Department of Health and Human Services. NIH is the primary federal agency conducting and supporting basic, clinical, and translational medical research, and is investigating the causes, treatments, and cures for both common and rare diseases. For more information about NIH and its programs, visit www.nih.gov.
LANSING – Michigan Attorney General Dana Nessel has sent a notice of intended action (PDF) to Recollections, Inc., a Michigan-based company that designs and customizes historically themed clothing. The notice urges the business to address repeated allegations that it violated the Michigan Consumer Protection Act by failing to timely fill online orders or refund customers whose orders remain unfilled.
“Online shoppers deserve timely deliveries and quick refunds when a company cannot fulfill an order,” Nessel said. “When buying anything online, remember to take steps to protect yourself and only shop at businesses you trust. My office will continue to act when companies fail to uphold their obligations to consumers.”
The Attorney General’s notice follows a review of more than 50 complaints with the Department of Attorney General’s Consumer Protection Team and the Better Business Bureau. Recent complaints reviewed by the Department include:
A customer who ordered Victorian-era clothing in February 2025 for $229 and Edwardian-era clothing in March 2025 for $124.80. It is alleged that neither item was delivered due to back orders, and no refund was issued.
A customer who ordered two skirts totaling $188.68 in November 2024, and allegedly never received the items due to back orders or never received a refund.
A customer who ordered a dress in October 2024 that was allegedly never delivered and has yet to receive a refund, even after the company stated it was processing refunds as quickly as possible.
The notice contends that most of the more than 50 complaints follow similar patterns of alleged unfilled orders and refunds that were never processed.
Recollections, Inc. has until December 22, 2025, to confer with the Department’s Consumer Protection Team regarding an assurance agreement to resolve the concerns expressed in the Notice.
Attorney General Nessel is also reissuing her consumer alert on online shopping. When online shopping, consumers should:
Avoid online retailers if they cannot verify the company’s listed physical locations and customer service phone numbers. Anyone can set up an online shop and list a physical location and phone number, but that does not guarantee the business is legitimate. Research unfamiliar companies before placing an order.
Do an online image search of the product and any other images the seller has posted to see where the product is coming from, how much it really costs, and who else is selling it.
Pay with a credit card when making online purchases. Credit cards provide protections that allow consumers to dispute charges if an item is not delivered or is not as promised.
Protect their personal information by never sharing financial details or social security numbers via text or email, unchecking any box that allows the seller to share any of their information, and reading privacy policies. If the policy is unclear, consumers should consider ordering from a more user-friendly site.
To file a complaint with the Attorney General, or get additional information, contact:
Consumer Protection Team P.O. Box 30213 Lansing, MI 48909 517-335-7599 Fax: 517-241-3771 Toll-free: 877-765-8388 Online complaint form
MOUNTAIN VIEW, Calif. — Robots have long been seen as a bad bet for Silicon Valley investors — too complicated, capital-intensive and “boring, honestly,” says venture capitalist Modar Alaoui.
But the commercial boom in artificial intelligence has lit a spark under long-simmering visions to build humanoid robots that can move their mechanical bodies like humans and do things that people do.
Alaoui, founder of the Humanoids Summit, gathered more than 2,000 people this week, including top robotics engineers from Disney, Google and dozens of startups, to showcase their technology and debate what it will take to accelerate a nascent industry.
Alaoui says many researchers now believe humanoids or some other kind of physical embodiment of AI are “going to become the norm.”
“The question is really just how long it will take,” he said.
Disney’s contribution to the field, a walking robotic version of “Frozen” character Olaf, will be roaming on its own through Disneyland theme parks in Hong Kong and Paris early next year. Entertaining and highly complex robots that resemble a human — or a snowman — are already here, but the timeline for “general purpose” robots that are a productive member of a workplace or household is farther away.
Even at a conference designed to build enthusiasm for the technology, held at a Computer History Museum that’s a temple to Silicon Valley’s previous breakthroughs, skepticism remained high that truly humanlike robots will take root anytime soon.
“The humanoid space has a very, very big hill to climb,” said Cosima du Pasquier, founder and CEO of Haptica Robotics, which works to give robots a sense of touch. “There’s a lot of research that still needs to be solved.”
The Stanford University postdoctoral researcher came to the conference in Mountain View, California, just a week after incorporating her startup.
“The first customers are really the people here,” she said.
Researchers at the consultancy McKinsey & Company have counted about 50 companies around the world that have raised at least $100 million to develop humanoids, led by about 20 in China and 15 in North America.
China is leading in part due to government incentives for component production and robot adoption and a mandate last year “to have a humanoid ecosystem established by 2025,” said McKinsey partner Ani Kelkar. Displays by Chinese firms dominated the expo section of this week’s summit, held Thursday and Friday.
In the U.S., the advent of generative AI chatbots like OpenAI’s ChatGPT and Google’s Gemini has jolted the decades-old robotics industry in different ways. Investor excitement has poured money into ambitious startups aiming to build hardware that will bring a physical presence to the latest AI.
But it’s not just crossover hype — the same technical advances that made AI chatbots so good at language have played a role in teaching robots how to get better at performing tasks. Paired with computer vision, robots powered by “visual-language” models are trained to learn about their surroundings.
One of the most prominent skeptics is robotics pioneer Rodney Brooks, a co-founder of Roomba vacuum maker iRobot who wrote in September that “today’s humanoid robots will not learn how to be dexterous despite the hundreds of millions, or perhaps many billions of dollars, being donated by VCs and major tech companies to pay for their training.” Brooks didn’t attend but his essay was frequently mentioned.
Also missing was anyone speaking for Tesla CEO Elon Musk’s development of a humanoid called Optimus, a project that the billionaire is designing to be “extremely capable” and sold in high volumes. Musk said three years ago that people can probably buy an Optimus “within three to five years.”
The conference’s organizer, Alaoui, founder and general partner of ALM Ventures, previously worked on driver attention systems for the automotive industry and sees parallels between humanoids and the early years of self-driving cars.
Near the entrance to the summit venue, just blocks from Google’s headquarters, is a museum exhibit showing Google’s bubble-shaped 2014 prototype of a self-driving car. Eleven years later, self-driving cars full of passengers operated by Google affiliate Waymo are constantly plying the streets nearby.
Some robots with human elements are already being tested in workplaces. Oregon-based Agility Robotics announced shortly before the conference that it is bringing its tote-carrying warehouse robot Digit to a Texas distribution facility run by Mercado Libre, the Latin American e-commerce giant. Much like the Olaf robot, it has inverted legs that are more birdlike than human.
Industrial robots performing single tasks are already commonplace in car assembly and other manufacturing. They work with a level of speed and precision that’s difficult for today’s humanoids — or humans themselves — to match.
The head of a robotics trade group founded in 1974 is now lobbying the U.S. government to develop a stronger national strategy to advance the development of homegrown robots, be they humanoids or otherwise.
“We have a lot of strong technology, we have the AI expertise here in the U.S.,” said Jeff Burnstein, president of the Association for Advancing Automation, after touring the expo Thursday. “So I think it remains to be seen who is the ultimate leader in this. But right now, China has certainly a lot more momentum on humanoids.”
Gait monitoring via digital health technologies, such as wearable inertial sensors, continues to grow in prevalence and acceptance. Especially given the ability of these digital health technologies to enable remote and continuous monitoring, these quantitative data have provided key insights for clinicians, including the ability to monitor or diagnose a variety of diseases and populations []. This increased acceptance is highlighted by the recent approval of the 95th percentile of gait speed as a primary end point in Duchenne Muscular Dystrophy trials []. Gait has also been referred to as a “functional sixth vital sign” [,], and, along with previous research showing relationships with all-cause mortality, disability status, age, and more [-], highlights the importance of continuous gait monitoring. With patient centricity as the main objective, remote and continuous gait monitoring provides opportunities for trial sponsors to consider decentralized clinical trials, which can reduce patient burden and increase patient diversity [].
Researchers have developed algorithms to extract spatial and temporal gait metrics using data collected by sensors at various body locations, such as the wrist, hip, and lower trunk, which has enhanced the understanding of human locomotion dynamics [-].
Beyond the lumbar and wrist, numerous other sensor placements have been investigated. Foot- and shank-mounted inertial sensors have long been regarded as reference-standard placements, as they directly capture ground contact events and enable accurate stride length and speed estimation [,]. However, their use in large-scale or decentralized studies is limited by setup burden, footwear dependence, and reduced patient compliance compared with lumbar or wrist-worn devices. More recently, innovative placements such as head- and ear-worn sensors have been explored, leveraging hearing aids, earbuds, or headbands to unobtrusively capture gait dynamics [-]. These approaches demonstrate the diversity of wearable configurations under study, though many face challenges in patient compliance, real-world wearability, or algorithm generalizability.
To increase overall compliance and reduce participant burden, it is of great interest to use a single sensor to monitor bilateral gait. The lumbar location is the most popular choice, though it has its drawbacks. Namely, accuracy can sometimes suffer due to its distal location relative to the feet and ground contact points. This is especially true for spatial metrics, which rely on modeling steps as pendulum swings [,], as opposed to direct integration (which has its own numerical problems) or the location and trajectory estimation methods typically used for sensors placed on the feet or legs. This lower accuracy is generally the result of a relatively constant bias in spatial metric estimation, such as stride length and gait speed [,,], even when algorithm precision remains high. Some previous works have addressed this drawback with personalized constants requiring calibration []; however, this potentially adds significant participant burden and limits the ability to conduct fully remote trials. Other remedies include using a relation between step frequency and step length [], machine/deep learning approaches, or employing different sensor locations []. However, these may suffer from a lack of generalizability, as nonphysical models or relationships were employed in the estimation procedure. Therefore, it is of interest to address these drawbacks within the current physical inverted pendulum model and improve accuracy.
While the lumbar site has technical limitations due to reliance on pendulum modeling for spatial metrics, it also offers practical advantages. Compared with placements such as the feet, chest, or head, the lumbar sensor is generally easier for participants to wear consistently, less intrusive in daily activities, and less affected by soft tissue or motion artifacts. Previous work has highlighted the lumbar site as a practical compromise between accuracy and wearability, supporting its use in both older adults and patient populations where long-term compliance is critical [,]. These attributes, coupled with its ability to capture bilateral gait from a single device, make the lumbar location particularly appealing for large-scale monitoring and decentralized trial settings, thereby reinforcing the rationale for optimizing algorithms at this site.
While several algorithms have been developed to estimate gait parameters from sensors placed at various body locations, the options for a comprehensive solution that can be implemented in clinical trials remain limited. One such option is our open-source SciKit Digital Health (SKDH) [], a Python package that includes various digital health algorithms (eg, sleep, physical activity, gait), data ingestion tools, and preprocessing methods. The gait module in SKDH, that is, SKDH-gait, evolved from GaitPy, a stand-alone open-source package [] that provided an interface for estimating gait metrics within a fixed framework. While the majority of the gait implementation remained the same, additional options were added, such as a dynamic relation between step frequency and wavelet scale [], which has already improved overall accuracy. Validation results for both the original GaitPy [] and the SKDH-gait implementation [,] have been previously published. However, a direct comparison between the 2 versions has never been officially reported. Another issue with these implementations is that a population-specific parameter specification is required, depending on factors such as age, which can create an additional operational burden. Other gait algorithms include the recently published Mobilise-D gait algorithm [,] and the gaitmap project []. While the gaitmap project focuses primarily on foot-placed devices—requiring 2 sensors for bilateral assessment in addition to the drawbacks noted above—the Mobilise-D gait algorithm utilizes a single lumbar device and has been released as an open-source package on GitHub, MobGap []. The Mobilise-D gait algorithm, therefore, occupies a similar space to SKDH’s gait algorithm as an alternative processing package.
As a matter of fact, at-home gait monitoring has already been implemented in clinical trials, for example, in cancer cachexia phase 1 and 2 studies, as end points designed to support clinical interpretation and decision-making in decentralized trials [,]. However, improving accuracy has concrete benefits for clinical translation. In patient populations, small but clinically meaningful changes in gait—such as reductions in stride length in multiple sclerosis [] or subtle slowing that predicts conversion to Parkinson disease []—can be obscured by algorithmic bias or variability, as even small gait deviations can be clinically meaningful. By reducing measurement error, more accurate algorithms increase sensitivity to detect disease progression and treatment response. In clinical trials, this enhanced sensitivity translates into stronger statistical power and potentially smaller required sample sizes. Finally, in the context of real-world monitoring and regulatory acceptance, reliable gait metrics are essential to ensure that longitudinal changes reflect true functional decline or improvement rather than artifacts of the analytic method. This aligns with Food and Drug Administration (FDA) guidance emphasizing the need for trustworthy digital end points in patient-focused drug development [].
To address the technical challenges mentioned above, reduce bias in the estimation of spatial metrics, and improve overall accuracy, the SKDH-gait algorithm has been overhauled and updated. These updates are significant enough to require new validation beyond what has been previously presented. This work aims to provide a step-by-step overview of the improvements and their validation using data collected from healthy adults and pediatric populations. We first consider each of the constituent blocks of the gait algorithm and examine areas requiring improvement, and then assess these proposed changes. Next, we combine all individual improvements in the full algorithm implementation and validate the updated approach and its effect on the final gait metrics compared with a reference system. Finally, we assess the test-retest reliability of the gait metrics. This paper serves as the first part of the validation work, beginning with healthy participants before transitioning to patient populations in future studies.
Methods
Participants and Procedures
Data used in this work for validating the gait algorithm were drawn from the In-Clinic and Natural Gait Observations (ICANGO) [] and the Monitoring Activity and Gait in Children (MAGIC) [] studies completed at the Pfizer Innovation Research Lab in Cambridge, Massachusetts.
In MAGIC, a total of 40 healthy ambulatory participants aged 3-17 years were enrolled. Participants were recruited equally from 3 independent age groups as follows: 3-5 years, 6-11 years, and 12-17 years. Informed consent was obtained from the parents or legally acceptable representatives of all participants. Assent was obtained in an age-appropriate manner (verbal assent for children 3-5 years; written assent for children 6-17 years). The study was conducted at the Pfizer Innovation Research Lab in Cambridge, Massachusetts, from 2021 to 2022.
In ICANGO, 2 cohorts of 20 healthy individuals each (40 participants total) over 18 years old (range 25-82 years) were enrolled. Participants did not have any significant health problems, as determined by a medically qualified study doctor during initial intake.
Details of the 2 studies have been previously published [,]. Only study procedures relevant to this validation are further elaborated here.
For both studies, participants completed in-laboratory and at-home portions; however, only the in-laboratory portions are considered for this work. Participants in the ICANGO study completed 2 in-laboratory visits spaced approximately 7-14 days apart, while those in the MAGIC study completed only 1 in-laboratory visit. During the in-laboratory visits, participants completed several walking tasks on an instrumented walkway (GAITRite, CIR Systems Inc) while also wearing a set of 6 wearable inertial sensors (OPAL v2, APDM Inc). Only the lumbar-mounted Opal sensor is considered for this work. Pressure data from the GAITRite system were collected at 100 Hz, while acceleration data from the Opal sensors were recorded at 128 Hz. A motion tracking system (SIMI, SIMI Motion Reality Systems) was also used during these in-laboratory walks; however, not all participants had analyzable data from this system. All 3 systems were synchronized via an electronic trigger to ensure precise time alignment.
For the in-laboratory walking tasks, participants completed 3 laps of the 20-foot GAITRite walkway at self-selected natural, slow, and fast walking speeds. Participants in the ICANGO study additionally completed a natural-speed walking task in which a carpet was placed over the GAITRite mat. This walk is considered only in the gait subblock analysis, as it was not included in either study.
Reference Algorithms
Data provided by the GAITRite mat were analyzed using the ProtoKinetics Movement Analysis Software (PKMAS) to obtain both gait subblock metrics and final gait metrics. Gait subblock metrics were those derived from the intermediate blocks of the gait algorithm, including but not limited to initial contact (IC) and final contact (FC) times. The final gait metrics of interest were limited to cadence, stride time, stride length, and gait speed, as these cover the majority of the temporal and spatial gait metric space.
Center of mass (CoM) displacement can often be used to simplify locomotion trajectories, as in walking, where modeling the CoM as an inverted pendulum aids in estimating spatial gait parameters such as stride length []. Reference data for CoM height change were provided by the SIMI system for those participants whose SIMI data were processed; these participants represented only a subset of those in the ICANGO study. Time points (ie, IC and FC events) used to calculate CoM height change were extracted from the PKMAS data.
The Comparison Gait Algorithm, Gait v2
In this work, the updated SKDH-gait, ie, gait v3, was compared with the last major version of the algorithm implemented in SKDH-gait, named gait v2. As a side note, the original GaitPy implementation is considered gait v1 [,], which is not included in the comparison, as it has already been sunset due to obsolescence.
Gait v2 uses continuous wavelet transforms (CWTs) and the inverted pendulum model to analyze the lumbar acceleration signal and generate gait metric estimates. Moving through the algorithm:
Acceleration was first down-sampled to 50 Hz [].
Acceleration frame orientation was corrected to better align with participant’s anatomical vertical, anterior-posterior (AP), and medial-lateral axes using a small-angle accelerometer tilt correction [].
Following this orientation correction, a smoothed vertical acceleration signal was obtained by first integrating the vertical acceleration using the cumulative trapezoid rule and then applying the CWT with a Gaussian first-derivative wavelet [].
Peaks in this smoothed vertical acceleration with a height above 50% of the SD of the signal were selected as first-pass estimates of the IC events (ie, heel strikes) [].
The CWT was then applied to the smoothed vertical acceleration a second time to obtain an estimate of the smoothed jerk [].
Peaks in this signal (again with a height >50% of the signal SD) were taken as first-pass estimates of the FC events (ie, toe-offs) [].
This first step for estimating IC and FC events will be referred to as the “m” method. The scales for the CWT were estimated from step frequency-CWT scale relations derived in previous work []. For this relation, an estimate of the step frequency was required, which was obtained using a pass of the algorithm at the scale from the original work [], defined by a frequency of 1.25 Hz (at 50 Hz, this scale is 8).
Using these first-pass estimates of ICs and FCs, steps are defined by applying the following quality control (QC) rules:
Loading time (initial double support) should be less than C loading t max stride.
Stance time should be less than half of t max stride plus the maximum initial double support from the first check.
Strides should be less than the t max stride.
tmax stride is the maximum stride time and Cloading is a loading factor. tmax stride and Cloading were set to 2.25 seconds and 0.2, respectively, for the ICANGO study following previous work in gait “v1” []. For the MAGIC study, tmax stride was set to 1.75 seconds and the wavelet scale frequency was set to 1.35 Hz following previous internal work in pediatric populations.
Following the step construction from the ICs and FCs, the CoM height change between consecutive ICs was estimated by double-integrating the vertical acceleration. This CoM height change was then used in the inverted pendulum model to estimate step length [], as described below.
where Sstep is the step length, lleg is the leg length estimated from 0.53 × height [], and Δh is the CoM change in height. Step time was defined as the interval between consecutive ICs, and stride time as the sum of 2 consecutive step times. Stride length was defined as the sum of consecutive step lengths. Gait speed was calculated as stride length divided by stride time, and cadence was defined as the number of steps taken per minute.
Cadence = (60/tStep)
where tStep is the step time.
Comparison Contact Event Algorithms
In addition to the full comparison algorithm (gait v2), we implemented several previously published methods for estimating IC and FC events to provide additional benchmarks for our proposed method. These comparator methods are summarized in .
Table 1. Additional contact event methods implemented to compare the original method used in gait v2 (“m” method) and the method proposed in this work.
Method
Events
Description
Reference
m (gait v2)
ICa/FCb
Peaks in CWTc-smoothed vertical acceleration and jerk
[]
B
IC
Peaks in filtered APd acceleration data
[]
G
IC/FC
Zero-crossings in FIRe-filtered AP acceleration data with heuristic rules
[]
z-cross
IC
Zero-crossings in the filtered AP acceleration data
[]
z-peak
IC
Peaks preceding zero-crossings in the filtered AP acceleration data
[]
Pe
IC/FC
Stationary wavelet transform and identification using AP and vertical acceleration
[,]
Sk
IC
CWT of acceleration magnitude; peaks in CWT coefficients accounting for varying step frequency
Building on gait v2, we improved key components for estimating gait metrics from lumbar acceleration, resulting in the updated gait v3 algorithm. Although all data from the ICANGO and MAGIC studies were used in the final analysis of gait metrics, the subblock improvements were developed using a random ≈50% train-test split within each study. This yielded a training set of n=33 (14/19 from ICANGO/MAGIC) and a test set of n=47 (26/21 from ICANGO/MAGIC). Note that, in gait v3, acceleration data are not downsampled. presents the updated gait algorithm.
Figure 1. Simplified diagram showing the full updated gait algorithm. AP: anterior-posterior; CoM: center of mass; CWT: continuous wavelet transform; FC: final contact; IC: initial contact.
Accelerometer Axis and Mean Step Frequency Estimation
The first major subblock in the proposed gait algorithm estimates (1) the accelerometer axis most closely aligned with the participant’s AP axis and (2) the mean step frequency for the entire walking bout. Identifying the AP axis is essential for applying the small-angle orientation correction and for subsequent contact event detection, which relies on the AP signal. Estimating the mean step frequency is also important, as it informs the dynamic QC thresholds based on walking speed and determines the appropriate CWT scale for smoothing the acceleration signal.
To estimate the AP axis, we first identified the vertical axis as the one with the largest absolute mean acceleration value. The acceleration signal was then filtered using a fourth-order band-pass Butterworth filter (0.25-7.5 Hz) to isolate walking-related components. After filtering, the AP axis was defined as the axis showing the highest cross-correlation with the vertical axis.
To estimate the mean step frequency, we computed CWTs of the AP-axis acceleration across 10 scales spanning 0.5-5.0 Hz using a Gaussian first-derivative wavelet. These 10 CWT coefficients were summed to produce a single signal representing the “CWT power” in that frequency range. A windowed (5 seconds, 50% overlap) autocovariance was then calculated, and for each window, the first peak was extracted. The median of these first peaks was defined as the mean step time, which was inverted to obtain the mean step frequency.
Foot Contact Event Detection
While the “m” method (The Comparison Gait Algorithm, Gait v2 []) for estimating contact events is generally reliable and yields good agreement for temporal gait metrics (ie, stride time), it is not the most accurate for determining the exact timing of these events []. shows the vertical and AP acceleration from a lumbar device, with several key points labeled.
Figure 2. Synthetic example acceleration traces for the vertical (V) and anterior-posterior (AP) axes. Several key points in both traces are labeled following previous convention [].
The issue arises from the smoothing of the vertical acceleration, which is very effective at locating point “V3” of the vertical acceleration []. However, this point does not correspond to the actual moment of IC, which is instead point “AP5” [,]. Therefore, we propose a new method that utilizes the AP-axis acceleration and dynamically adjusts the wavelet scale based on the mean step frequency for the walking bout.
First, we calculated the CWT scales based on the estimated mean step frequency per
where fCWT is the Gaussian first derivative wavelet central frequency for the IC and FC detection, and is the estimated mean step frequency. The relations were obtained by performing a scale sweep on the training data and optimizing both the F1-score and the root-mean-square error using a cost function []. We note that the generalizability of these relations to pathological cohorts should be further explored in future work. Although the step frequency-wavelet frequency relation only informs the CWT-based filtering based on walking speed, and therefore should not be affected by pathologies, this assumption should be confirmed.
To remove any very high-frequency noise, acceleration was filtered with a 20 Hz cutoff using a fourth-order Butterworth filter. Next, FC events were obtained by first integrating the filtered AP acceleration to compute the AP velocity, and then applying the CWT (Gaussian first-derivative wavelet) using the scale corresponding to the central frequency from the above equations. Peaks in the resulting CWT coefficients correspond to FC events. To minimize false positives, we applied 2 constraints to the peak detection: first, the prominence had to be greater than 0.6σWn, and second, the peak distance had to be greater than , where σWn is the SD of the CWT coefficients and is the estimated mean step time. These constraints were added after exploration of the training dataset during method development, based on visual inspection and experience, to ensure physiologically reasonable detections.
To obtain IC estimates, we first applied the CWT to the filtered AP acceleration using the scale corresponding to the estimated frequency, producing a smoothed AP jerk signal. Local minima and maxima were then identified using a prominence constraint of 0.6σWn and a distance constraint . Finally, for each FC event, we searched backward to locate the corresponding IC event, defined as the point halfway between the preceding zero-crossing (positive to negative) and the preceding local minimum. This approach—rather than relying solely on local extrema—helps account for signal perturbations and flatter peaks that can occur during slow walking.
Step Creation and Physiological Thresholds
With the IC and FC event estimates obtained, we proceeded to stride creation and QC using physiological thresholds. The same basic rules as in gait v2, described above in “The Comparison Gait Algorithm, Gait v2” section, were applied.
These rules require defining 2 parameters: tmax stride and Cloading. While gait v2 uses static thresholds for these values, we explored dynamic functions based on the estimated mean step time. shows the relationship between mean step time and stride time from the reference data, which generally follows the expected 1:2 relation. From this plot, we observed that the original static threshold of 2.25 seconds did not adequately cover the full range of walking speeds, particularly during fast walking, where several strides could occur before reaching 2.25 seconds. Examining the SD of stride times, we found a maximum of approximately 0.5 25 seconds. Therefore, we set a new dynamic threshold based on the following:
This provides a threshold set at least 2 SDs above the expected mean stride time.
Figure 3. GAITRite/PKMAS reference data from the training data set (N=33), where each ICANGO participant completed each of the 4 walks, and MAGIC participants completed the fast, normal, and slow walks. (A) Relationship between mean step time and mean stride time. The original quality control threshold is the dashed line, y=2.25, the new dynamic threshold is y=2x+1. (right) Stride time SD per walking task. ICANGO: In-Clinic and Natural Gait Observations; MAGIC: Monitoring Activity and Gait in Children; PKMAS: ProtoKinetics Movement Analysis Software.
illustrates the relationship between mean step time and the loading factor derived from the reference PKMAS gait data. The data show that the loading factor is not constant across walking speeds, decreasing noticeably as walking speed increases. To account for this, we implemented the following relation to calculate the loading factor:
Figure 4. GAITRite/PKMAS reference data from the training data set (N=33), where each ICANGO participant completed each of the 4 walks, and MAGIC participants completed the fast, normal, and slow walks. (A) Relationship between mean step time and mean loading factor across various walking speeds. Original factor of 0.2 is the dashed line. The new dynamic relation for loading factor, y=0.17x+0.05, is the blue line. (B) Relationship between mean step time and mean initial double support time. The dashed line is the original threshold of 0.2(2.25)=0.45. The blue line is the new threshold based on the maximum stride time and loading factor dynamic relationships. ICANGO: In-Clinic and Natural Gait Observations; MAGIC: Monitoring Activity and Gait in Children; PKMAS: ProtoKinetics Movement Analysis Software.
The coefficients for this relation were obtained using simple linear regression on the reference data. This approach provided a much-improved limit for initial double support times compared with the original threshold (), producing a more consistent gap between the mean initial double support time and the threshold across walking speeds. The blue line in represents the upper limit for allowable initial double support values and is therefore positioned above the mean to accommodate the variability of initial double support times within a walking bout.
Using these new threshold calculations, steps were created by identifying groups consisting of 1 IC and 2 FCs (opposite and same side) that satisfied the dynamic QC thresholds. We also ensured continuity, such that the same-side FC of one step served as the opposite-side FC for the subsequent step. Once steps were allocated in this manner, temporal gait metrics were computed for each step or for continuous steps, as appropriate.
Inverted Pendulum Model and Spatial Gait Metrics
Two inverted pendulum models are depicted in . Model 1 consists of a single inverted pendulum, whereas model 2 incorporates both a normal and an inverted pendulum. To improve spatial metric estimation in the proposed gait algorithm, we utilized the inverted pendulum model 2 []. This model can be described by the following equations [,]:
Figure 5. Inverted pendulum models []. (A) Inverted pendulum model 1, where there is only an inverted pendulum. The only unknown is S_step, which allows for easy solving. Used in gait v2. (B) Inverted pendulum model 2, where there is both a normal and inverted pendulum. S_bip is the step length during initial double support, S_sup is the step length during single support. This model has 3 unknowns: S_bip, l_2, and S_sup.
One unknown remained on the right-hand side, l2. To address this, we used the available temporal metrics to establish a relationship between the length ratio and the time ratio of these 2 gait phases, as follows:
where tbip and tsup represent the initial double support and single support durations for a step, respectively.
illustrates the experimental relationship described by the above equations, derived from reference PKMAS and SIMI data. From this training data, we obtained C=1.1 such that . Using this relationship, we estimated l2 as follows:
l2 = 1.1lleg(tbip/tsup)
which enabled the calculation of the step length estimate using model 2. To minimize the variability in per-step estimations of the length-to-time ratio, we computed l2 using the median tbip and tsup values across individual bouts of gait.
Figure 6. Relationship between the time and length ratios.
Data and Statistical Analysis
Overview of the Analysis
The analyses were conducted in 2 parts: first, we computed values for each gait subblock described above and compared them with ground truth as well as the comparison algorithms; second, we computed final gait metrics for the proposed method (gait v3) and the comparison method (gait v2) and compared these with the reference.
For all analyses, when summarizing values across a walking task, the median value across all steps was used. When summarizing values across visits (for ICANGO), the average of the 2 visits was used. Intraclass correlation coefficients (ICCs) were used to evaluate agreement, with ICC≤0.4 indicating “poor,” <0.4-0.59 indicating “moderate,” 0.6-0.74 indicating “good,” and 0.75-1.0 indicating “excellent” agreement [].
Gait Subblock Performance Analysis
For the first part of the analysis, ICANGO and MAGIC participants were randomly divided into training and testing sets within each study (without accounting for age, gender, or other covariates) to develop the proposed method. This resulted in n=33 in the training set (14/19 from ICANGO/MAGIC), and n=47 in the test set (26/21 from ICANGO/MAGIC). Results for the gait subblocks are presented using the test set data. Additional results are provided in . Where appropriate, these results used outputs from the ground truth methods to isolate the effects of individual subblocks—for example, CoM height change estimation used reference method contact events as bounds for integrating acceleration.
For the comparison of mean step time estimation, we used ICC (2-way random effects, absolute agreement), Pearson correlation coefficients (Pearson ), and repeated measures correlation coefficients (RMCCs) to account for within-participant correlation (ie, multiple walking speed tasks per participant). Analysis of covariance was used to statistically adjust for interindividual variability [,].
To assess the performance of the gait subblock values, we considered both per-step values and median values across walking tasks. For IC and FC detection, performance was evaluated using sensitivity, precision, F1-score, and mean absolute error (MAE) relative to the reference system. To determine true and false positives and negatives, each contact event in the reference system was matched to a corresponding event within a 0.3-second window (ie, 0.15 seconds on each side). Previous studies have used smaller windows (eg, 50 ms []), but such narrow windows would have excluded many events and artificially increased MAE. Events occurring outside the GAITRite mat area were not counted as false positives. MAE was computed only for contact events corresponding to a reference contact event. Performance metrics were assessed both visually and using linear mixed-effects regression (LMER) models to account for interactions between method, walking task, and age group, while controlling for within-participant correlation using a participant-specific random effect.
Gait Metric Performance Analysis
For the second part of the analysis, the full set of ICANGO and MAGIC participants was used, and gait metrics were compared between the 2 algorithm versions and the reference results. Gait v2 and gait v3 were computed using SKDH version 0.13.0. The SKDH code is available on GitHub []. The analysis focused on 4 common gait metrics—cadence, stride time, stride length, and gait speed—which together cover both temporal and spatial gait parameters.
To comprehensively evaluate the accuracy of gait metrics derived from gait v3 against both the reference system (PKMAS) and gait v2, we applied a hierarchical statistical framework to distinguish primary and secondary outcomes. Primary analyses were defined as agreement with reference values across walking speeds and were assessed using (1) Pearson correlation coefficients (r) to evaluate whether the algorithm preserved the relative ranking of individuals, and (2) ICC (2-way random effects, absolute agreement) to evaluate whether algorithm outputs were in absolute agreement with the reference. These measures directly capture the clinical interpretability of gait v3 relative to gold-standard assessments. Secondary analyses focused on evaluating whether gait v3 reduced systematic bias relative to gait v2. To this end, LMER models were used to compare PKMAS, gait v2, and gait v3 across walking speeds and age groups (>18, 12-17, and <12 years) within a comprehensive modeling framework. The 4 gait metrics (cadence, stride time, stride length, and gait speed) were modeled as outcomes, with algorithm, walk type, age group, and the interactions algorithm × walk type and algorithm × age group included as fixed effects. Participant-specific random intercepts were included to account for repeated measures. Pairwise contrasts of estimated means were calculated, with P values adjusted for multiple comparisons using the false discovery rate.
In the ICANGO study, where participants had 2 in-laboratory visits, we additionally assessed test-retest reliability using ICC (2-way random effects, absolute agreement), Pearson correlation coefficients, and RMCCs.
The following R packages (R Foundation) were used: rmcorr (version 0.6.0), lme4 (version 1.1-35.3), lmerTest (version 3.1.3), emmeans (version 1.10.1), rstatix (version 0.7.2), psych (version 2.4.3), and BlandAltmanLeh (version 0.3.1). R version 4.3.3 was used.
Ethics Considerations
Ethics approval for the MAGIC protocol was obtained from the Advarra Institutional Review Board (protocol number: Pro00047861). All participants provided informed consent. The ICANGO study was reviewed and approved by the Advarra Institutional Review Board (protocol number: Pro00043100).
Results
Mean Step Time Estimation
The agreement between the gait v3 mean step-time estimates and the reference method is presented in . The overall agreement was excellent, with all ICC values exceeding 0.91 and Pearson r values above 0.92. Repeated-measures analysis yielded similar findings, demonstrating a high RMCC of 0.98.
Table 2. Agreement for mean step frequency estimation between gait v3 and PKMASa across different walking tasksb.
Walk
PKMAS (Hz), mean (SD)
Gait v3 (Hz), mean (SD)
rc (95% CI)
ICCd (95% CI)
RMCCe (95% CI)
Normal
1.86 (0.23)
1.84 (0.23)
0.98 (0.97-0.99)
0.98 (0.95-0.99)
0.98 (0.97-0.99)
Fast
2.08 (0.28)
2.12 (0.29)
0.92 (0.86-0.96)
0.91 (0.83-0.95)
0.98 (0.97-0.99)
Slow
1.40 (0.26)
1.39 (0.25)
0.99 (0.97-0.99)
0.98 (0.97-0.99)
0.98 (0.97-0.99)
Carpet
1.69 (0.13)
1.69 (0.14)
0.94 (0.87-0.97)
0.94 (0.87-0.97)
0.98 (0.97-0.99)
aPKMAS: ProtoKinetics Movement Analysis Software.
bThis analysis is based on the test set.
cPearson correlation coefficient.
dICC: intraclass correlation coefficient.
eRMCC: repeated measures correlation coefficient.
Initial and Final Contact Estimation
The accuracy of the proposed and comparison methods for IC/FC estimation relative to the reference methods—along with several additional literature-based methods (see )—is shown in A. The gait v3 method achieved among the highest F1-scores, with median values above 0.9; the only comparable approach was the “m” method (gait v2). When comparing MAE across methods (B), gait v3 again performed among the best for IC estimation, with only the “g” method showing similar MAE values. The “pe” method approached this performance but generally produced higher errors. Notably, gait v3 showed an approximately 50% reduction in MAE compared with the “m” (gait v2) method. Full LMER model results comparing each algorithm with the gait v3 method are provided in .
Figure 7. Test-set accuracy results for various initial and final contact estimation methods from data across visits and walking tasks (N=47). See Table 1 for the list of algorithms and references. (A) Initial contact F1-score results. (B) Initial contact mean absolute error (MAE) results. (C) Final contact F1-score results. (D) Final contact MAE.
When comparing FC method F1-scores (C), none of the literature-based methods approached the performance of either the “m” (gait v2) or gait v3 methods. Although both “m” and gait v3 exhibited some low F1-score outliers, gait v3 had noticeably fewer outliers, and those that did occur were generally higher than the outliers observed for the “m” method. For MAE (D), the gait v3 method had the lowest values, with median MAE typically about 50% lower than any of the other methods.
Exploring the outliers reveals that most are not consistent across methods for either IC or FC estimation; rather, the outliers for different methods arise from different participant-walk tasks. Notably, for the gait v3 method, all F1-score outliers remain above 0.81 for IC events and above 0.65 for FC events.
Gait Metrics
Using data from the ICANGO and MAGIC studies, we evaluated the performance of the gait v2 and v3 algorithms against reference PKMAS values. summarizes the algorithm and reference metrics, along with agreement statistics (Pearson correlation coefficients and ICCs) for each gait variable and walking task. Correlation coefficients were generally high and comparable between gait v2 and gait v3, with the lowest Pearson correlation of 0.73 for stride time during the slow walk using gait v2, and 0.82 for stride length during the slow walk using gait v3. By contrast, ICC values showed a consistent improvement with gait v3: while gait v2 exhibited a minimum ICC of 0.50 (gait speed, fast walk), gait v3’s lowest ICC was 0.81 (stride length, slow walk) across all metrics and walking tasks. The most notable improvements in ICC values were observed for the spatial metrics—stride length and gait speed. Highlighting a few specific instances, stride time during the slow walk showed a substantial increase, with Pearson r improving from 0.73 in v2 to 1.00 in v3, and ICC increasing from 0.70 to 1.00. Similarly, gait speed showed marked gains: during the fast walk, ICC improved from 0.50 to 0.84, and during the slow walk, from 0.71 to 0.90. These examples illustrate the consistent enhancement in agreement achieved with the gait v3 algorithm.
Table 3. Comparison results for gait metrics across walking speed (N=80).
Metric and walk
PKMASa, mean (SD)
Gait v2, mean (SD)
Gait v3, mean (SD)
Gait v2, rb (95% CI)
Gait v3, r (95% CI)
Gait v2, r (95% CI)
Gait v3, ICCc
Cadence (step/minute)
Normal
111.45 (13.90)
109.70 (13.50)
110.22 (13.97)
0.99 (0.98-0.99)
0.99 (0.99-1.00)
0.98 (0.91-0.99)
0.99 (0.96-1.00)
Fast
129.25 (18.41)
123.76 (15.18)
127.83 (18.39)
0.85 (0.78-0.90)
0.99 (0.98-0.99)
0.80 (0.59-0.89)
0.98 (0.97-0.99)
Slow
83.15 (15.72)
84.65 (13.90)
82.26 (15.48)
0.93 (0.89-0.96)
1.00 (0.99-1.00)
0.93 (0.89-0.96)
1.00 (0.99-1.00)
Stride time (seconds)
Normal
1.10 (0.13)
1.11 (0.12)
1.10 (0.13)
0.99 (0.99-0.99)
1.00 (1.00-1.00)
0.99 (0.96-0.99)
1.00 (0.99-1.00)
Fast
0.95 (0.12)
0.98 (0.11)
0.96 (0.14)
0.89 (0.83-0.93)
0.89 (0.84-0.93)
0.86 (0.73-0.92)
0.88 (0.83-0.92)
Slow
1.50 (0.31)
1.41 (0.22)
1.52 (0.31)
0.73 (0.61-0.82)
1.00 (1.00-1.00)
0.75 (0.60-0.85)
1.00 (0.99-1.00)
Stride length (m)
Normal
1.24 (0.21)
1.11 (0.21)
1.22 (0.21)
0.89 (0.83-0.93)
0.85 (0.77-0.90)
0.74 (-0.01-0.91)
0.84 (0.77-0.90)
Fast
1.43 (0.25)
1.26 (0.24)
1.41 (0.25)
0.89 (0.83-0.93)
0.88 (0.82-0.92)
0.71 (-0.05-0.90)
0.88 (0.82-0.92)
Slow
1.00 (0.22)
0.87 (0.17)
1.03 (0.19)
0.85 (0.77-0.90)
0.82 (0.73-0.88)
0.68 (0.03-0.87)
0.81 (0.71-0.87)
Gait speed (m/s)
Normal
1.14 (0.19)
1.00 (0.19)
1.12 (0.20)
0.87 (0.81-0.92)
0.83 (0.74-0.88)
0.69 (-0.05-0.89)
0.82 (0.73-0.88)
Fast
1.51 (0.22)
1.28 (0.20)
1.48 (0.22)
0.79 (0.69-0.86)
0.84 (0.77-0.90)
0.50 (-0.10-0.80)
0.84 (0.76-0.89)
Slow
0.69 (0.21)
0.63 (0.16)
0.70 (0.18)
0.78 (0.67-0.85)
0.90 (0.85-0.94)
0.71 (0.49-0.83)
0.90 (0.85-0.93)
aPKMAS: ProtoKinetics Movement Analysis Software.
bPearson correlation coefficient.
cICC: intraclass correlation coefficient.
This improved agreement is illustrated in , where stride time results are generally consistent across methods and walking speeds. However, B shows that gait v2 aligns less closely with PKMAS results across all 3 gait speeds. Bland-Altman plots indicate that this difference reflects a mostly consistent bias, with gait v2 generally underestimating gait speed (see ).
Figure 8. Gait metric results across walking tasks from reference, comparison, and proposed algorithms (N=80). Median values are taken across steps per walking task and mean values across visits. (A) Stride time results. (B) Gait speed results. PKMAS: ProtoKinetics Movement Analysis Software.
presents the pairwise contrasts of estimated means from the LMER models across walking tasks. When comparing gait v2 with PKMAS, most metrics showed significant differences (P<.007), except for cadence during the normal and slow walks, and stride time during the normal and fast walks. By contrast, gait v3 showed no significant differences from PKMAS for any metric across all walking tasks (the smallest P value was .14). Direct comparison of v2 and v3 revealed that the metrics where v2 differed from PKMAS also exhibited significant differences between v2 and v3 (P<.009). These significant differences in gait speed indicate that v2 was 0.064-0.199 m/s slower than v3, and 0.065-0.230 m/s slower than PKMAS.
Table 4. Mixed-effects model contrast estimates (and 95% CIs) across walk types for gait metrics (N=80)a.
Metric and walk
PKMASb – gait v2
PKMAS – gait v3
Gait v2 – gait v3
Difference (95% CI)
P value
Difference (95% CI)
P value
Difference (95% CI)
P value
Cadence (step/minute)
Normal
1.839 (–1.80 to 5.48)
.65
1.182 (–2.46 to 4.82)
.65
–0.657 (–4.30 to 2.98)
.66
Fast
5.568 (1.93 to 9.21)
<.001
1.361 (–2.28 to 5.00)
.37
–4.207 (–7.85 to 0.57)
.009
Slow
–1.368 (–5.03 to 2.29)
.55
0.726 (–2.93 to 4.38)
.63
2.094 (–1.56 to 5.74)
.51
Stride time (seconds)
Normal
–0.006 (–0.06 to 0.05)
.98
–0.007 (–0.06 to 0.05)
.98
–0.001 (–0.06 to 0.06)
.98
Fast
–0.024 (–0.08 to 0.03)
.62
–0.012 (–0.07 to 0.04)
.62
0.011 (–0.04 to 0.07)
.62
Slow
0.092 (0.04 to 0.15)
<.001
–0.015 (–0.07 to 0.04)
.52
–0.107 (–0.16 to –0.05)
<.001
Stride length (m)
Normal
0.136 (0.10 to 0.18)
<.001
0.021 (–0.02 to 0.06)
.21
–0.115 (–0.16 to –0.07)
<.001
Fast
0.174 (0.13 to 0.22)
<.001
0.018 (–0.02 to 0.06)
.29
–0.156 (–0.20 to –0.12)
<.001
Slow
0.133 (0.09 to 0.17)
<.001
–0.025 (–0.07 to 0.02)
.14
–0.158 (–0.20 to –0.12)
<.001
Gait speed (m/s)
Normal
0.135 (0.08 to 0.19)
<.001
0.024 (–0.03 to 0.08)
.28
–0.111 (–0.16 to –0.06)
<.001
Fast
0.230 (0.18 to 0.28)
<.001
0.030 (–0.02 to 0.08)
.18
–0.199 (–0.25 to –0.15)
<.001
Slow
0.065 (0.01 to 0.12)
.007
0.000 (–0.05 to 0.05)
.99
–0.064 (–0.12 to –0.01)
.007
aP values <.05 are in italics. P values are corrected for multiple comparisons within each gait metric.
bPKMAS: ProtoKinetics Movement Analysis Software.
shows a similar pattern, with significant differences between v2 and PKMAS for all age groups in stride length and gait speed. While v3 also showed some differences from PKMAS in these metrics, the discrepancies were smaller than those observed for v2. Direct comparison between v2 and v3 revealed that v2 had shorter stride lengths and slower gait speeds, with differences ranging from 0.134 to 0.156 m for stride length and 0.098 to 0.162 m/s for gait speed.
Table 5. Mixed-effects model contrast estimates (and 95% CIs) across age groups for gait metrics (N=80).a
Metric and age group
PKMASb – gait v2
PKMAS – gait v3
Gait v2 – gait v3
Difference (95% CI)
P value
Difference (95% CI)
P value
Difference (95% CI)
P value
Cadence (step/minute)
>18
1.571 (–1.34 to 4.48)
.48
1.202 (–1.70 to 4.10)
.48
–0.368 (–3.27 to 2.53)
.76
<12
2.430 (–1.23 to 6.09)
.33
1.224 (–2.43 to 4.88)
.43
–1.206 (–4.86 to 2.45)
.43
12-17
2.039 (–2.68 to 6.76)
.67
0.843 (–3.88 to 5.57)
.67
–1.196 (–5.92 to 3.53)
.67
Stride time (seconds)
>18
0.001 (–0.04 to 0.05)
.94
–0.010 (–0.05 to 0.03)
.90
–0.011 (–0.06 to 0.03)
.90
<12
0.034 (–0.02 to 0.09)
.21
–0.010 (–0.07 to 0.05)
.66
–0.045 (–0.10 to 0.01)
.17
12-17
0.027 (–0.05 to 0.10)
.57
–0.014 (–0.09 to 0.06)
.63
–0.041 (–0.11 to 0.03)
.54
Stride length (m)
>18
0.161 (0.13 to 0.19)
<.001
0.023 (–0.01 to 0.06)
.09
–0.139 (–0.17 to –0.11)
<.001
<12
0.094 (0.05 to 0.14)
<.001
–0.062 (–0.10 to –0.02)
<.001
–0.156 (–0.20 to –0.12)
<.001
12-17
0.188 (0.13 to 0.24)
<.001
0.054 (0.00 to 0.11)
.01
–0.134 (–0.19 to –0.08)
<.001
Gait speed (m/s)
>18
0.149 (0.11 to 0.19)
<.001
0.035 (–0.01 to 0.08)
.05
–0.115 (–0.16 to –0.07)
<.001
<12
0.115 (0.06 to 0.17)
<.001
–0.047 (–0.10 to 0.01)
.04
–0.162 (–0.22 to –0.11)
<.001
12-17
0.165 (0.09 to 0.24)
<.001
0.067 (–0.00 to 0.14)
.02
–0.098 (–0.17 to –0.03)
<.001
aP values <.05 are in italics. P values are corrected for multiple comparisons within each gait metric.
bPKMAS: ProtoKinetics Movement Analysis Software.
Test-Retest Reliability
We assessed the test-retest reliability of the reference, comparison, and proposed methods across walking speeds and gait metrics. Overall, the results in show excellent ICC agreement, with similar values across methods. Nearly all ICCs exceeded 0.75, except for gait v2 slow-walk cadence and gait v3 fast-walk stride time. The lower agreement for gait v3 stride time during the fast walk was influenced by an outlier, likely caused by accelerometer misalignment affecting the AP acceleration during the task. By contrast, gait v2 was not impacted because it relies on vertical acceleration. Even after correction, the misalignment resulted in fewer steps being properly detected. Other metrics maintained higher agreement, as they were either aggregate measures (eg, gait speed) or based on estimates from a larger number of steps (eg, cadence).
Table 6. Test-retest ICCa results between visits 1 and 2 in the ICANGO study for reference, comparison, and proposed algorithms (N=40).
Metric and walk style
PKMASb, ICC (95% CI)
Gait v2, ICC (95% CI)
Gait v3, ICC (95% CI)
Cadence (step/minute)
Normal
0.85 (0.69-0.92)
0.82 (0.67-0.90)
0.84 (0.69-0.92)
Fast
0.86 (0.76-0.93)
0.85 (0.74-0.92)
0.86 (0.75-0.92)
Slow
0.84 (0.53-0.93)
0.58 (0.28-0.77)
0.83 (0.45-0.93)
Stride time (seconds)
Normal
0.82 (0.65-0.91)
0.82 (0.67-0.90)
0.81 (0.64-0.90)
Fast
0.89 (0.80-0.94)
0.87 (0.77-0.93)
0.71 (0.52-0.84)
Slow
0.85 (0.57-0.93)
0.75 (0.43-0.88)
0.84 (0.55-0.93)
Stride length (m)
Normal
0.91 (0.75-0.96)
0.86 (0.71-0.93)
0.91 (0.83-0.95)
Fast
0.85 (0.73-0.92)
0.87 (0.77-0.93)
0.85 (0.73-0.92)
Slow
0.80 (0.53-0.90)
0.78 (0.54-0.89)
0.81 (0.64-0.90)
Gait speed (m/s)
Normal
0.81 (0.57-0.91)
0.84 (0.67-0.92)
0.84 (0.66-0.92)
Fast
0.78 (0.62-0.88)
0.79 (0.64-0.88)
0.78 (0.62-0.88)
Slow
0.83 (0.42-0.93)
0.77 (0.31-0.90)
0.80 (0.39-0.92)
aICC: intraclass correlation coefficient.
bPKMAS: ProtoKinetics Movement Analysis Software.
Discussion
In this work, we presented a step-by-step description of the updates made to the SKDH [] gait module, both within the algorithm subblocks and in the overall algorithm performance relative to a ground-truth GAITRite/PKMAS system. By applying the updated algorithm to healthy adult and pediatric populations in the ICANGO and MAGIC studies, and evaluating it across multiple comparison methods, these updates demonstrated significant improvements over the previous version of the gait module. This work introduces a generalizable, regulatory-grade framework for remote gait estimation using a single lumbar sensor—incorporating dynamic QC, robust axis-adaptive gait detection, and deployment-ready processing pipelines. These innovations move the field from algorithm development toward validated clinical deployment.
Estimation of the mean step time for a gait bout showed strong agreement, with higher Pearson correlation coefficients, ICCs, and RMCC. While per-stride step time is estimated as a final output of the gait algorithm, having an a priori estimate of the mean step time for the walking bout allows for dynamic adjustment of the gait event detection method as well as stride QC. This, in turn, minimizes the need for manual adjustment of algorithm parameters by the end user, which should support generalizability as the algorithm is deployed in patient populations. With these parameters—and those used in peak detection (eg, minimum peak prominence)—setting them based on the training set, whether visually or using ground-truth data, and then validating them in the test set provides confidence in their generalizability. However, future work might explore a sensitivity analysis of these parameters to assess their impact on the final results.
Accurate estimation of initial and final foot contact events is the critical foundational block for all subsequent gait metric calculations. We implemented a new approach for locating foot contacts, alongside implementations of several previously proposed methods for comparison [,,-,]. Our method demonstrated superior F1-scores and MAE values compared with these methods across both IC and FC events. For IC events, the “g” (0.022 seconds) and “pe” (0.027 seconds) methods showed similar median MAE values; however, their F1-score performance was substantially worse (0.93 and 0.68, respectively) compared with the proposed method (MAE 0.023 seconds; F1-score of 0.98). FC results were even more favorable for the proposed method: only the “m” (gait v2) method achieved a comparable F1-score (median 0.98 vs 1.0), and none of the other methods approached its MAE performance (gait v3 median 0.018 seconds). A review paper compiling results from various IC/FC detection algorithms across multiple populations reported MAE values for IC events ranging from 0.013 to 0.148 seconds in healthy participants, and from 0.025 to 0.186 seconds in individuals with neurologic diseases, Parkinson disease, and hemiplegia []. Both the “g” and “pe” methods were among the best-performing algorithms in that review, aligning with the performance of existing methods observed in this work.
These improvements to the gait processing subblocks would, however, have limited value if they did not enhance the overall estimation of gait metrics. Across the 4 gait metrics presented, we observe consistently better results for the proposed gait v3 algorithm. Correlation values generally remain stable or show improvements, such as for cadence during slow and fast walks. ICC values further highlight these gains—particularly for spatial metrics, where stride length and gait speed ICCs increase from 0.50-0.74 in gait v2 to 0.81-0.90 across walking speeds. We also observe improvements in agreement for temporal metrics during slow and fast walking (eg, stride time ICC during slow walking increases from 0.75 in v2 to 1.00 in v3). These strengthened agreements are likely the result of both dynamic gait event detection and QC using the a priori estimation of mean step time, which eliminates the need to manually adjust parameters across different walking tasks. This should enable more reliable gait monitoring in at-home environments, where walking characteristics may vary depending on context. The improvements also result in a reduction of bias in gait metric estimation. These gains were observed and confirmed in the mixed-effects models used to evaluate performance across walking speeds and age groups. Specifically, the differences between gait v3 and the reference PKMAS values are consistently reduced or eliminated compared with gait v2, indicating reduced estimation bias across walking speeds. Moreover, estimation bias in younger age groups was also reduced, as shown in . Although some differences in gait speed and stride length remain in gait v3, these discrepancies are smaller.
The importance of the statistically significant improvements and bias reduction achieved by gait v3 becomes clearer when interpreted against meaningful change thresholds or minimal clinically important differences, which vary across pathological cohorts. Specifically, across walking speeds and age groups, gait v3 reduced bias in gait speed estimates by approximately 0.10-0.20 m/s compared with v2. This range aligns with the European Medical Agency’s qualification of the 95th percentile of gait speed, where changes of 0.10-0.20 m/s are considered clinically meaningful in Duchenne muscular dystrophy []. Similarly, in Parkinson disease, clinically important differences in gait speed have been reported up to ~0.20 m/s, depending on the assessment method []. The fact that the reductions in bias observed with gait v3 fall within these clinically meaningful ranges indicates that the updated algorithm enhances the ability to detect meaningful changes that gait v2 may have obscured. This improvement in accuracy is particularly important in clinical trial contexts, where misestimation at the level of clinically meaningful differences can inflate sample size requirements or mask therapeutic effects, and in real-world monitoring, where longitudinal changes must be confidently attributed to underlying clinical status rather than algorithmic error.
Beyond technical improvements, gait v3 also reflects a distinct design philosophy compared with conventional gait pipelines. Many existing approaches rely on multisensor fusion, subject-specific calibration, or data-driven modeling to optimize accuracy under controlled conditions—methods that can limit scalability and reduce compliance in real-world or decentralized settings. By contrast, gait v3 adopts a physically motivated, single-site lumbar design with embedded biomechanical constraints and dynamic QC, enabling calibration-free, interpretable, and robust performance across heterogeneous users and environments. This shift from calibration-dependent precision to calibration-free robustness emphasizes scalability, compliance, and longitudinal continuity—key requirements for home-based monitoring and decentralized clinical trials. By delivering reliable gait metrics from a single self-applied sensor, gait v3 reduces participant and site burden while maintaining regulatory-grade accuracy. Thus, its contribution extends beyond performance gains: it illustrates how biomechanically grounded, dynamically self-correcting algorithms can reconcile analytical rigor with real-world feasibility, advancing the broader adoption of digital gait end points in clinical research. In summary, gait v3 is well-suited to the emerging landscape of patient-centric, real-world digital health applications and decentralized clinical trials.
The most significant recent effort in gait algorithm design and validation was undertaken by the Mobilise-D collaboration, which recently published the technical validation of their gait platform in healthy adults as well as individuals with Parkinson disease, multiple sclerosis, chronic obstructive pulmonary disease, congestive heart failure, and proximal femur fracture. When evaluating multiple subblock algorithms, the best-performing method for IC detection demonstrated a sensitivity of 0.80 and absolute errors of 0.06 seconds in healthy participants, with similar performance across pathological cohorts []. Although the gait v2 algorithm implemented in SKDH has not been published in patient populations, the Mobilise-D results showed a wide range of ICC values for IC estimation (0.68-0.98) and step length (0.28-0.70) when validating the originally published algorithms on which gait v2 was based []. We report lower MAE (under 0.05 seconds) and higher F1-scores (over 0.95), although the values reported by Mobilise-D were obtained during simulated daily activities rather than prescripted tasks, which would likely contribute to the higher performance observed here. Following their gait subblock assessment and algorithm exploration, the Mobilise-D consortium also published full gait speed results based on the subblocks that performed best in their testing []. Within their full validation protocol—including simulated daily activities—algorithm performance during straight walking showed errors of –0.03 m/s (limits of agreement –0.18 to 0.11), with an absolute error of 0.07 m/s (limits of agreement 0.01 to 0.13) in healthy adults. This is very similar to our reported error of 0.024 m/s (95% CI –0.03 to 0.08) for normal straight-walk gait speed. Across all reported in-laboratory tasks, the Mobilise-D algorithm yielded an ICC of 0.74 (95% CI 0.66-0.81) for gait speed, slightly lower than our observed 0.82-0.90 across walking speeds, although the inclusion of simulated daily activities likely accounts for this difference. Overall, we report results that are comparable to, or better than, those from the Mobilise-D project, suggesting that SKDH may be a suitable alternative—pending further validation in pathological cohorts and in settings involving more simulated daily activities. This is particularly relevant for the dynamic thresholds used for QC checks. Although these thresholds were designed to be broad enough to encompass a wide range of physiological parameters, their underlying relationships may not always hold in pathological gait. Nevertheless, we maintain that dynamic, data-driven thresholds based on observed walking behavior are likely to outperform the original static thresholds in gait v2 when applied to pathological gait.
Assessing test-retest reliability across the 2 in-laboratory visits in the ICANGO study, ICC values were consistent for both the reference method and gait v3. This provides evidence to support its use as a reliable clinical outcome assessment and as a digital end point in clinical trials [].
There are several limitations to this work. First, because the study population consisted solely of healthy individuals, we cannot infer the generalizability of the algorithm updates to patient populations. Although the inclusion of children and adolescents provides some indication of broader applicability, it remains insufficient to establish generalizability to clinical cohorts. Second, validation was restricted to prescripted in-laboratory walking tasks, even though multiple walking speeds were included. To address these limitations, future work will evaluate the algorithm’s validity in patient cohorts with distinct gait signatures, assess performance during simulated daily living, examine the impact of sensor misplacement, and compare results with other clinical outcome measures.
No external financial support or grants were received from any public, commercial, or not-for-profit entities for the research, authorship, or publication of this article.
Upon request, and subject to review, Pfizer will provide the data that support the findings of this study. Subject to certain criteria, conditions, and exceptions, Pfizer may also provide access to the related individual deidentified participant data. See [] for more information.
All authors were employees and shareholders of Pfizer, Inc during the conduct and writing of the paper.
Edited by J Sarvestan; submitted 19.Feb.2025; peer-reviewed by D Alvarez, P Tasca; comments to author 22.Aug.2025; accepted 07.Nov.2025; published 12.Dec.2025.
This is an open-access article distributed under the terms of the Creative Commons Attribution License (https://creativecommons.org/licenses/by/4.0/), which permits unrestricted use, distribution, and reproduction in any medium, provided the original work, first published in the Journal of Medical Internet Research (ISSN 1438-8871), is properly cited. The complete bibliographic information, a link to the original publication on https://www.jmir.org/, as well as this copyright and license information must be included.
(Bloomberg) — US stocks extended losses as a selloff in the year’s biggest artificial intelligence winners dragged global gauges back from the brink of record highs. Longer-dated bond yields climbed.
A disappointing sales outlook from chipmaker Broadcom Inc. weighed on rivals and further fueled investor anxiety over AI wagers initially sparked by Oracle Corp. The AI bellwether’s stock drop started Thursday following a forecast for rising outlays and a longer timeline to a revenue payoff. The slump deepened on a report of delays to some of Oracle’s data center projects Friday. Shares of companies tied to the power infrastructure also slid.
The Nasdaq 100 fell as much as 2.3% while Broadcom Inc. sank 11%. The S&P 500 fell more than 1% after the index notched a record close in the previous session. The Dow Jones Industrial Average pulled back from record highs.
“The AI bubble is deflating but not popping,” said Louis Navellier, chief investment officer at Navellier & Associates. Friday’s profit-taking after stock benchmarks hit new highs is not unexpected, he added. “Heightened concerns on OpenAI agreements may make further gains challenging.”
Investors also had to contend with mixed messages from Federal Reserve officials after they delivered their third-straight interest rate cut this week.
Yields on Treasury 30-year bonds rose 6 basis points to a three-month high after Federal Reserve Bank of Cleveland President Beth Hammack said she would prefer interest rates to be slightly more restrictive to keep putting pressure on inflation, which is still running too high.
Kansas City Fed President Jeff Schmid also pointed to consumer pricing pressures. Schmid said he dissented against the central bank’s decision this week to lower interest rates because inflation remains too high and the economy continues to show momentum.
“Judging from the calendar, this could be a day Wall Street takes a breather from its recent feverish pace,” said Joe Mazzola, head trading and derivatives strategist at Charles Schwab. “Major earnings and data are scarce, the weekend beckons, and investors increasingly look ahead to next Tuesday’s jobs report.”
Diversification across geographies and themes is becoming a key consideration. After technology heavyweights drove equity gains for much of the year, concerns about stretched valuations and vast capital outlays have prompted investors to look for opportunities elsewhere.
“Given the set-up in markets, diversification is now the price worth paying to keep you fully invested in equities,” wrote Goldman Sachs’s Mark Wilson. He adds that there are compelling investment stories including Korea, Japan, China or the broader emerging markets.
Meanwhile, strategists at Goldman Sachs Group Inc. expect stocks to notch fresh records next year, citing resilient economic growth and broader adoption of artificial intelligence to support corporate earnings.
The team led by Ben Snider reaffirmed its target for the S&P 500 to reach around 7,600 points in 2026, implying gains of about 10% from current levels. Other forecasters and asset managers share the upbeat view, with strategists at firms including Morgan Stanley, Deutsche Bank AG and RBC Capital Markets LLC also calling for US stocks to rise more than 10%.
Market forecasters are broadly positive on Europe as well, with not a single one of the 17 strategists surveyed by Bloomberg expecting a major decline. Four strategists, including those at UBS Group AG and Deutsche Bank AG, project gains of nearly 13% from Wednesday’s close.
Some are eyeing gains on an even shorter horizon, betting on further advances before 2025 ends as investors rotate into stocks that have so far remained in tech’s shadow.
“Everyone is convincing themselves that there will be a Christmas rally, so it looks like there will be one, and to be honest, there’s no negative catalyst visible until the end of the year,” said Karen Georges, a fund manager at Ecofi Investissements in Paris. “Investors are keen to buy this year’s laggards, it’s a good time to diversify your portfolio at the moment.”
Bloomberg’s index of the dollar clinged to a gain after a two-day losing streak and was on track for a third weekly loss. In commodities, gold erased gains while silver pulled back from an all-time high.
What Bloomberg Strategists Say…
“Oracle is an outlier among the major AI stocks as it has run down its cash flow and taken on debt to finance capital spending. If the model is running into trouble already because of difficulties in getting data centers built, that’s bad news for all the companies selling shovels into this gold rush, as well as potentially the cloud giants themselves, which have valuations partly predicated on huge and growing order backlogs.”
—Sebastian Boyd, Macro Strategist, Markets Live
For the full analysis, click here.
Corporate News:
A group of influential Swiss lawmakers proposed watering down the capital demands that the country wants to impose on UBS Group AG, sending shares to a 17-year high. Broadcom Inc., a chip company vying with Nvidia Corp. for AI computing revenue, slumped after its sales outlook for the red-hot market failed to meet investors’ lofty expectations. Lululemon Athletica Inc. shares rallied after the pricey yoga-wear maker boosted its full-year outlook and announced that its chief executive officer would step down after a period of sluggish growth. SoftBank Group Corp. is studying potential acquisitions including data center operator Switch Inc., people with knowledge of the matter said, underscoring billionaire founder Masayoshi Son’s growing ambitions to ride an AI-fueled boom in digital infrastructure. Some of the main moves in markets:
Stocks
The S&P 500 fell 0.9% as of 1:03 p.m. New York time The Nasdaq 100 fell 1.6% The Dow Jones Industrial Average fell 0.3% The MSCI World Index fell 0.7% The Russell 2000 Index fell 1% Philadelphia Stock Exchange Semiconductor Index fell 4% Currencies
The Bloomberg Dollar Spot Index was little changed The euro was little changed at $1.1747 The British pound was little changed at $1.3375 The Japanese yen fell 0.1% to 155.79 per dollar Cryptocurrencies
Bitcoin fell 2.9% to $90,222.32 Ether fell 5.4% to $3,075.98 Bonds
The yield on 10-year Treasuries advanced four basis points to 4.19% Germany’s 10-year yield advanced one basis point to 2.86% Britain’s 10-year yield advanced three basis points to 4.52% The yield on 30-year Treasuries advanced six basis points to 4.86% Commodities
West Texas Intermediate crude rose 0.1% to $57.66 a barrel Spot gold rose 0.4% to $4,296.55 an ounce Silver Future Mar26 fell 4.1% to $61.92 This story was produced with the assistance of Bloomberg Automation.
–With assistance from Andre Janse van Vuuren, Levin Stamm, Julien Ponthus, Jan-Patrick Barnert, Michael Msika, Sagarika Jaisinghani and Ira Iosebashvili.
The future of work is changing fast. Future Focus cuts through the noise with three trends each week that matter most to HR and business leaders. When everything else is in flux, stay focused with Future Focus.
Longer Leash On Life: Inside The Dog Longevity Startup (Forbes)
What to Know: A biotech startup developing canine longevity drugs has raised $135 million, is pursuing FDA conditional approval, and is running the largest animal clinical trial with 1,300 dogs. Its first pill aims to mimic caloric restriction in senior dogs, with additional candidates targeting large-breed growth hormone pathways — potentially hitting the market as early as 2026.
Where to Focus: Pet-related benefits are increasingly part of total rewards packages. Breakthroughs in pet health and longevity — even in early biotech spaces — could further signal rising employee expectations around pet insurance, caregiving leave, and wellness supports.
Research: 2025 Employee Benefits Survey
Why Young People are Struggling to Communicate (Time)
What to Know: Educators report accelerating declines in teens’ writing and speaking skills, driven by reduced face-to-face interaction and heavy reliance on social media and generative AI. Research cited suggests chatbot use can reduce mental effort and creativity, further weakening original thinking and real-time communication.
Where to Focus: The next wave of early-career hires will have sharper access to tools but shallower practice in core human skills. Leaders should expect higher demand for structured communication training, more deliberate in-person collaboration, and clearer AI-use norms — because communication, not code, remains the backbone of decision-making, client trust, and leadership pipelines.
Related article: A Guide to Leading an Effective Multi-Generational Workforce
Vibe coding has come to Washington (Fast Company)
What to Know: Figma’s AI prototyping tool, Make, is now available to Figma for Government users. It aims to compress prototype cycles from weeks to hours as agencies race to improve services across more than 10,000 federal websites. With FedRAMP authorization and growing government adoption, AI-assisted “vibe coding” is set to influence how public-sector digital services are designed and delivered.
Where to Focus: When the public sector standardizes on AI design workflows, expectations for speed, accessibility, and usability may rise across the economy. Vendors and enterprises that serve regulated industries could experience shorter procurement and delivery windows, prioritize compliance-ready toolchains, and upskill product and design teams to work credibly with AI because the new baseline for service quality will be set in public view.
Be the first to know what’s next.
Get Future Focus delivered weekly through Tomorrowist — your shortcut to smarter decisions in a changing world of work.
The Government of Canada is committed to rebuilding, rearming and reinvesting in the Canadian Armed Forces (CAF). Today, the Honourable Stephen Fuhr, Secretary of State (Defence Procurement), the Honourable Rechie Valdez, Minister of Women and Gender Equality and Secretary of State (Small Business and Tourism), and Karim Bardeesy, Parliamentary Secretary to the Minister of Industry, announced that Canada has awarded a contract to Bombardier to acquire 6 Canadian-built Global 6500 aircraft for the Royal Canadian Air Force under the Airlift Capability Project – Multi-role Flight Service.
As one of the initial procurements under the new Defence Investment Agency (DIA), the investment in the Global 6500 will provide a modern, versatile replacement for the current CC-144 Challenger fleet to perform worldwide utility flights and support missions such as aeromedical evacuations, disaster relief, humanitarian aid and national security operations. The estimated value of the contract is approximately $753 million (CAD), with the first aircraft expected to be delivered by summer 2027, and initial operational capability achieved by the end of 2027, prioritizing a streamlined approach with the DIA. The contract also includes training for aircrew and maintenance personnel as well as military modifications.
The Government of Canada has selected a world-leading Canadian-based firm with global reach that will leverage its footprint across the country to help meet the needs of the CAF, and will invest in Canada’s industrial base. This includes the more than 60 Canadian suppliers who will support the production of the aircraft. Through this contract, Bombardier will support Canada’s aerospace ecosystem by working with small and medium-sized businesses and advancing research and development initiatives that benefit the domestic supply chain. This contract is also projected to create over 900 direct and indirect Canadian jobs associated to the aircraft manufacturing activities, including the supply chain.
Australia’s New Vehicle Efficiency Standard (NVES) began on January 1, 2025, setting CO2 emission targets for light-duty vehicles through 2029. While the NVES targets are based on the New European Driving Cycle (NEDC), Australia is also adopting Euro 6d-equivalent exhaust emissions standards that require vehicles to be tested using either the Worldwide harmonized Light vehicle Test Procedure (WLTP) or the U.S. 2-cycle tests.
To avoid requiring the auto industry to test vehicles under multiple protocols, the Australian Department of Infrastructure, Transport, Regional Development, Communications and the Arts engaged ICCT in December 2024 to develop conversion methods that translate the WLTP and U.S. 2-cycle CO2 values into NEDC-equivalent values for compliance determination with NVES.
ICCT developed detailed conversion algorithms covering the various Australian fleets, including petrol and diesel passenger cars, light commercial vehicles, and plug-in hybrids. This test cycle conversion protocol was adopted into Australia’s legislation as an option for the auto industry to use for type approval CO2 conversions instead of physical testing on multiple test cycles, if preferred.
The report can be viewed and downloaded from the Australian government website.


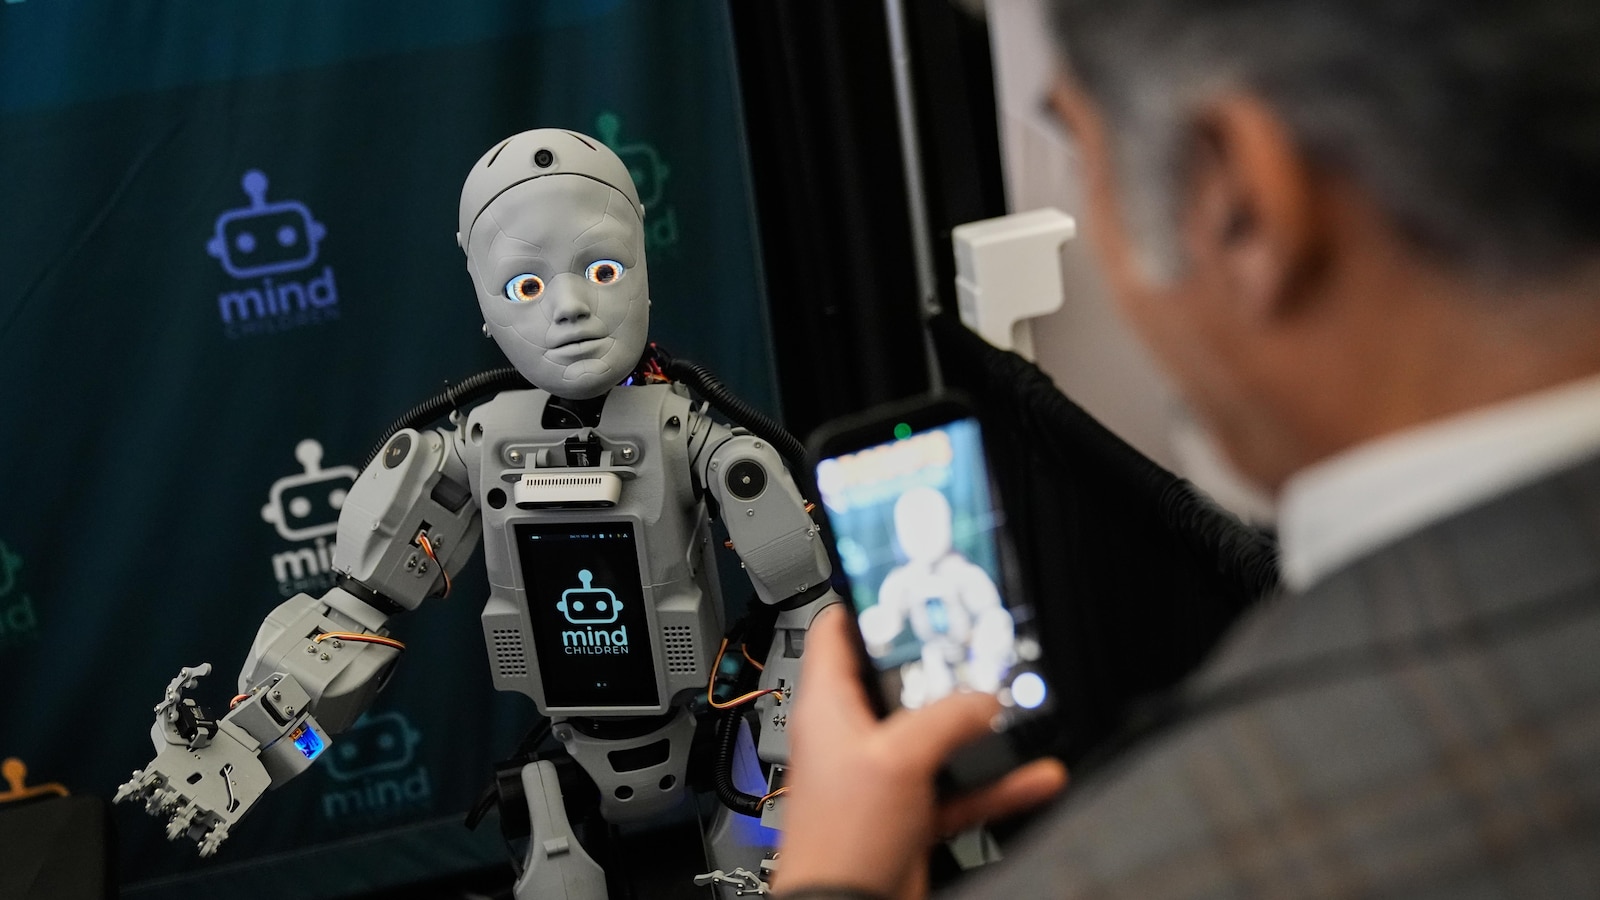


 is the estimated mean step frequency. The relations were obtained by performing a scale sweep on the training data and optimizing both the F1-score and the root-mean-square error using a cost function []. We note that the generalizability of these relations to pathological cohorts should be further explored in future work. Although the step frequency-wavelet frequency relation only informs the CWT-based filtering based on walking speed, and therefore should not be affected by pathologies, this assumption should be confirmed.
 , where σWn is the SD of the CWT coefficients and
  is the estimated mean step time. These constraints were added after exploration of the training dataset during method development, based on visual inspection and experience, to ensure physiologically reasonable detections.
 . Finally, for each FC event, we searched backward to locate the corresponding IC event, defined as the point halfway between the preceding zero-crossing (positive to negative) and the preceding local minimum. This approach—rather than relying solely on local extrema—helps account for signal perturbations and flatter peaks that can occur during slow walking.


 . Using this relationship, we estimated l2 as follows: