100% AI-generated campaign showcasing the power of agentic commerce to transform business operations
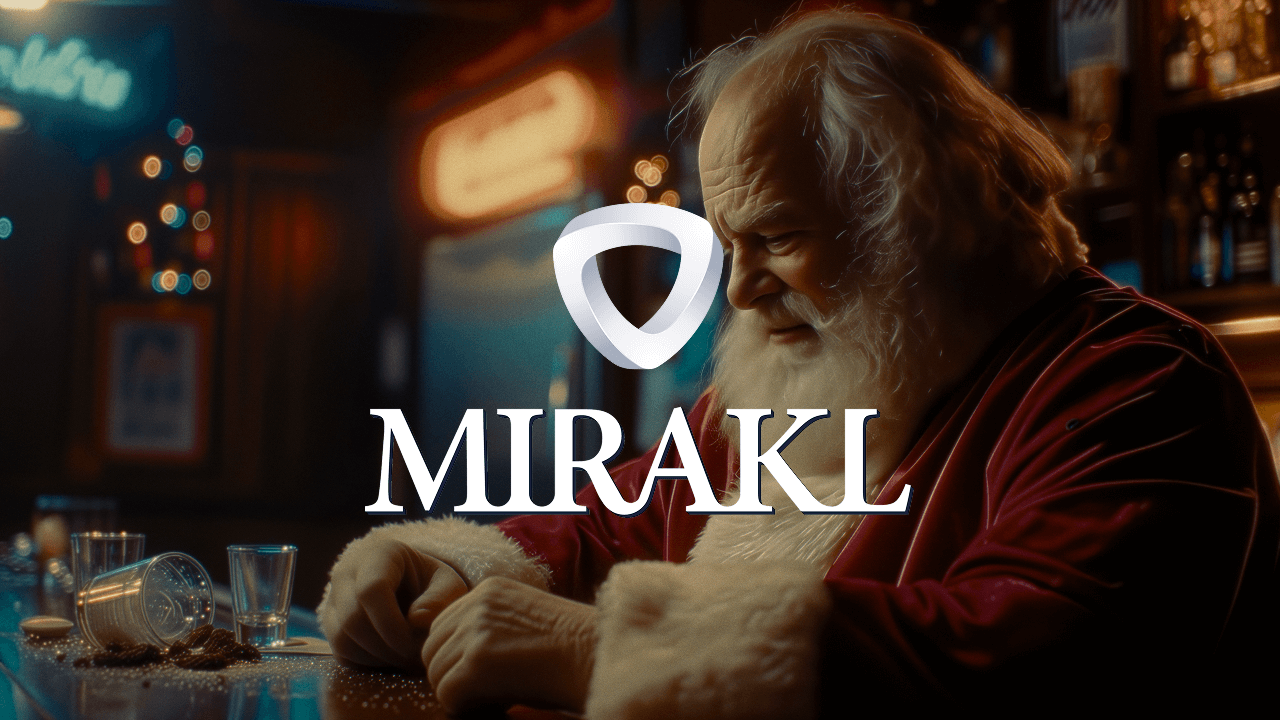
PARIS & BOSTON – December 12, 2025 – Mirakl, the leading provider of eCommerce software solutions, today announced the launch of its first-ever advertising campaign, ‘Santa Quits’, a groundbreaking 60-second holiday film that is 100% AI-generated. Created in collaboration with AiCandy, Australia’s first fully AI-powered creative production company, the campaign marks Mirakl’s bold entry into brand advertising while demonstrating the transformative potential of AI in both commerce and creativity.
The campaign can be viewed here.
The campaign arrives at a pivotal moment as the eCommerce industry stands on the brink of its next major evolution: agentic commerce, where AI agents autonomously handle product discovery, comparison, and purchasing on behalf of consumers and businesses.
The lighthearted narrative carries a powerful business message: even the most established operations need modern infrastructure to meet today’s impossible expectations. Just as Santa couldn’t manage Christmas alone, businesses need AI-powered platforms to scale operations, optimize complex workflows, and deliver seamless customer experiences.
The choice to create an entirely AI-generated campaign reflects Mirakl’s commitment to innovation and its position at the intersection of AI and commerce. The campaign spotlights Mirakl Nexus, the company’s infrastructure designed to power agentic commerce.
“This campaign represents a milestone for Mirakl, not just as our first advertising effort, but as a statement about who we are as a company,” said Hugo Weber, Vice-President of Mirakl. “We chose to create a 100% AI-generated film because we don’t just talk about innovation, we embody it. Just as we help the world’s leading enterprises harness AI to transform their commerce operations, we’ve used AI to reimagine how we tell our own story. It’s bold and it reflects the same pioneering spirit we bring to solving our customers’ most complex challenges.“
Santa Quits’ will run globally across digital and social channels throughout the 2025 holiday season. The campaign features three core activations: LinkedIn sponsored video targeting enterprise decision-makers, programmatic media placements on leading technology publications (with a business, tech and retail focus), and YouTube pre-roll ads appearing alongside agentic commerce and AI automation content.The 60-second film was strategically timed for release in the final days before Christmas, reinforcing the narrative that Mirakl’s platform helps solve seemingly impossible challenges with moments to spare.
Models used : Veo, Kling, Runway, Sora, Seedance, Suno and Topaz
Executive Producers: Hugo Weber & Romain Séchan (Mirakl)
Creative & AI Production: AiCandy, Australia
AiCandy, Head of Creative: Marcus Tesoriero
AiCandy, Head of Production: Kent Boswell
AiCandy, AI Film Director: Dr Machakil
Sound Designer: Matt Perrott (Mighty Sound)
Colourist: Keiran Lee
Media Agency: SPN part of Cosmo5
About Mirakl
Mirakl is the leading provider of eCommerce software solutions. Mirakl’s suite of solutions provides enterprises with a transformative way to drive significant growth and efficiency in their online business.
Since 2012, Mirakl has been pioneering the platform economy, empowering retail and B2B enterprises with the most advanced, secure and scalable technology to digitize and expand product assortment through marketplace and dropship, improve efficiency in supplier catalog management and payments, personalize shopping experiences, and boost profits through retail media.
Mirakl is trusted by Airbus, Best Buy, Decathlon, Macy’s, Ulta and 450+ industry-leading businesses worldwide. For more information: www.mirakl.com.
Media Contact
Press@mirakl.com