This application needs JavaScript to be enabled
This application needs JavaScript to be enabled

Wondering if Iberdrola is a bargain or looking expensive these days? You are not alone, and it is time to dig into what really drives the value behind the stock.
The share price has had a strong run this year, up 32.5% year-to-date and 39.0% over the last 12 months. There was a slight dip of 0.8% in the past week.
Recent headlines have been buzzing about Iberdrola’s expansion into offshore wind projects and new partnerships, pushing the company’s global reach. These strategic moves helped explain much of the recent upward momentum and have also refocused investors’ attention on the long-term growth story in renewable energy.
Despite all this excitement, Iberdrola currently scores a 0/6 on our valuation checks for being undervalued. This means it does not pass any of our six undervaluation tests. Next, we will cover the different ways the stock’s value can be assessed, but stick around for an even better approach to valuation at the end of the article.
Iberdrola scores just 0/6 on our valuation checks. See what other red flags we found in the full valuation breakdown.
The Discounted Cash Flow (DCF) model estimates a company’s value by projecting its future cash flows and discounting them back to today’s terms. This approach helps gauge what the business is really worth, regardless of daily share price movements.
Iberdrola’s current Free Cash Flow stands at approximately €5.0 Billion. Analyst estimates cover the next several years, with projections indicating a notable decline in free cash flow over the coming decade. By 2028, discounted free cash flow is expected to be €1.7 Billion, and further extrapolations suggest a continued drop, reaching around €539 Million (discounted) by 2035. These declining figures are calculated in Euros, the company’s reporting currency.
Based on this DCF method, Iberdrola’s estimated intrinsic value is €3.50 per share. This is considerably lower than its current market price, and the model implies the stock is trading at a 413.8% premium to its fair value. This suggests that Iberdrola is substantially overvalued by this measure.
Result: OVERVALUED
Our Discounted Cash Flow (DCF) analysis suggests Iberdrola may be overvalued by 413.8%. Discover 922 undervalued stocks or create your own screener to find better value opportunities.
Head to the Valuation section of our Company Report for more details on how we arrive at this Fair Value for Iberdrola.
The Price-to-Earnings (PE) ratio is often a go-to valuation measure for profitable companies like Iberdrola, as it offers a simple way to assess whether the market price reflects current earnings power. A “fair” PE ratio varies from company to company and is typically shaped by factors such as expected earnings growth and business risk. Higher growth or lower risk usually leads to a higher reasonable PE, while companies with slower growth or more uncertainty tend to warrant lower multiples.

The Sean M. Healey & AMG Center for ALS at Mass General Brigham has selected Tiziana Life Sciences as one of the companies to enter the Healey ALS MyMatch Program for testing intranasal foralumab in a biomarker-driven phase 2a clinical trial for ALS. This trial is partially funded by the ALS Association’s Hoffman ALS Clinical Trial Awards Program.
The Healey ALS MyMatch program is changing the field of early phase ALS clinical trials (Phase 1b/2a). The program uses a personalized approach, an efficient program architecture and central governance that allows for faster trial access for participants across multiple sites and faster and better trials for drug developers. An ALS MyMatch trial evaluates if an experimental treatment being tested for ALS is safe, how it works at a molecular level or how much of a dosage to give to have a biological effect in ALS. Information learned from a successful ALS MyMatch trial can help refine strategy for future phase 2/3 clinical trials, whether the experimental treatment should be tested in select subgroups of ALS individuals with certain disease characteristics or more broadly in all people with ALS. ALS MyMatch uses smart tools like genetics, blood and spinal fluid biomarkers and artificial intelligence to help choose the right drug for the right people with ALS and track how well it works.
Expert ALS scientist members of the ALS MyMatch Therapy Evaluation Committee selected Tiziana Life Sciences to work with the Healey & AMG Center on a new trial to include in the program. The trial will be led by Principal Investigators Suma Babu, MBBS, MPH, Co-Director of the Neurological Clinical Research Institute (NCRI) and Healey & AMG Center at Mass General Brigham, and James Berry, MD, MPH, Chief of the Division of ALS and Motor Neuron Diseases at Mass General Brigham.
Howard Weiner, MD, Professor of Neurology, Harvard Medical School and Co-Director of the Ann Romney Center for Neurologic Diseases at Mass General Brigham, is a key scientific collaborator in the ALS MyMatch trial. His groundbreaking preclinical work with foralumab has laid the foundation for bench-to-bedside translation of foralumab into clinical trials for multiple neurological diseases, including multiple sclerosis (MS), Alzheimer’s disease, and multiple system atrophy (MSA). Now, in partnership with Tiziana Life Sciences, Dr. Weiner is helping advance foralumab’s potential in ALS. “Based on the effect of foralumab in ALS models and in MS and Alzheimer’s disease, my team and I are hopeful that foralumab will affect disease progression in ALS,” says Dr. Weiner.
Tiziana Life Sciences’ investigational product, foralumab, is a fully human anti-CD3 monoclonal antibody that has been shown to stimulate T regulatory cells when administered by a nasal spray. Neuroinflammation and immune dysregulation, particularly involving T-cell dysfunction and microglial activation, are increasingly recognized as key drivers of disease progression in ALS. Preclinical and clinical evidence indicate that nasally administered foralumab stimulates regulatory T cells in cervical lymph nodes, which then migrate to the central nervous system (CNS) to suppress pathogenic inflammation and restore microglial homeostasis.
“We are thrilled to finalize design and move towards next steps of trial conduct of this multi-site trial with Tiziana Life Sciences,” states Dr. Babu. “The trial will use cellular and biofluid biomarkers alongside advanced brain imaging to better understand how the drug works in the brain and to group participants in the trial based on their unique disease profile.”
“New treatments are urgently needed to make ALS livable and cure it, so we are pleased to see intranasal foralumab continue to advance in development. This ALS MyMatch trial will be a crucial first step toward larger trials that can determine efficacy,” said Kuldip Dave, PhD, Senior Vice President of Research at the ALS Association. The Association previously funded the preclinical development of foralumab through its Barnett Drug Development Program.
ALS MyMatch is a multi-site, collaborative initiative that currently brings together four trial-ready, high enrolling ALS research centers and is a Network of Excellence for ALS (NEALS) affiliated program. Research centers include Mass General in Boston; University of Minnesota in Minneapolis, Minn.; Northwestern University in Evanston, Ill.; and Nova Southeastern University in Fort Lauderdale, Fla. ALS MyMatch has partnered with the Acceleration Centers of Enrollment (ACE) program, a community-driven philanthropic partnership program focused on expediting start up and recruitment at study centers. Additional trials and high performing sites will be added as the program grows. Organizations can apply on the ALS MyMatch website.
For more information about ALS MyMatch, please visit: massgeneral.org/neurology/als/research/healey-mymatch
About the Sean M. Healey & AMG Center for ALS at Mass General Brigham
At the Sean M. Healey & AMG Center for ALS at Mass General Brigham, we are committed to bringing together a global network of scientists, physicians, nurses, foundations, federal agencies, and people living with ALS, their loved ones, and caregivers to accelerate the pace of ALS therapy discovery and development.
Launched in November 2018, the Healey & AMG Center, under the leadership of Merit Cudkowicz, MD and a Science Advisory Council of international experts, is reimagining how to develop and test the most promising therapies to treat the disease, identify cures and ultimately prevent it.
With many clinical trials and lab-based research studies in progress right now, we are ushering in a new phase of ALS treatment and care. Together, we will find the cures.
About the Neurological Clinical Research Institute
The Neurological Clinical Research Institute (NCRI) at Mass General Brigham is an academic research organization composed of innovative researchers experienced and passionate about designing, developing, facilitating, and conducting multicenter clinical trials in neurological diseases. Our mission is to accelerate translational research in neurological disorders by initiating clinical development of novel therapies and leading trials of these compounds. We strive to be at the cutting edge of innovative trial design to accelerate therapy development by creating new trial methodology, discovering novel biomarkers and refining outcome measures.
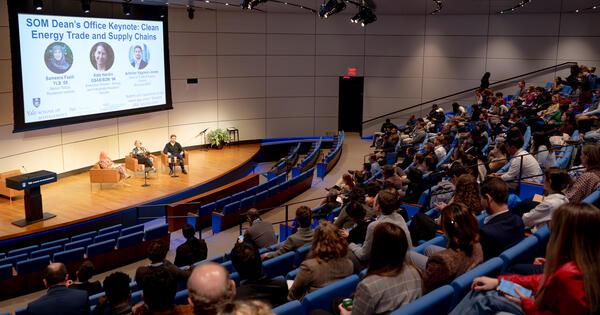
Hardin noted that renewable energy sources are expected to make up around 93% of new U.S. capacity additions this year. At the same time, she said, workforce constraints pose a significant barrier to scalability. Construction workers, welders, and electricians are essential to building the physical infrastructure that’s needed to scale clean energy technologies.
“If you think about the $650 billion in infrastructure projects announced since 2022, that’s going to require a tremendous workforce,” she said, citing the current shortage of around 500,000 construction workers in the U.S.
Vagneur-Jones grounded domestic developments in a global context, observing that the U.S. represents less than 10% of global demand for EVs; around 25% for batteries; and roughly 10% and 4% for solar and wind, respectively. China, which dominates clean energy manufacturing, accounts for 50% to 70% of global market share in the sector.
“We’re seeing a huge rise in Chinese exports to emerging economies, which is bringing the energy transition within reach for countries where it really wasn’t seriously considered,” Vagneur-Jones said, pointing out that Thailand now has a higher share of electric vehicles in passenger vehicle sales than the United States.
Speakers also noted that policy uncertainty—including questions about tariffs and tax credits—has complicated business planning. Building capacity takes time, Fazili noted, and there needs to be a “strong and consistent demand signal before companies can make large-scale capital investments.”
When it comes to U.S. manufacturing investments, Vagneur-Jones argued that continuity matters most.
“You’ve got to commit to one approach, and you have to do it over several years,” he said, adding that through sustained policy, “there is waste, and there are mistakes, and there are cycles—but there is also progress.”
Watch the keynote.

Heathrow Airport’s plan for a third runway, which involves moving the M25 motorway, has been chosen by the government.
Two plans had been under consideration – one from the airport itself, and another from Arora Group, led by hotel tycoon Surinder Arora.
Heathrow had proposed a new runway which would be up to 3.5km (2.2 miles) long and require a new road tunnel under the airport. The rival bid from Arora Group would have involved a shorter runway at a lower cost, and did not require altering the M25.
A final decision on whether a third runway will get the green light is still years away.
Last month, the government asked for further information to help choose between the Heathrow and Arora schemes.
The Department for Transport said Heathrow’s own proposal offered the most deliverable option, and the “greatest likelihood” of getting a decision on planning approval within this parliament.
The plan that has been backed will inform the government’s review of the Airports National Policy Statement.
Once that is complete, Heathrow is expected to apply for planning permission. The government then hopes for a decision by 2029.
But any company will be able to submit an application to build the new runway and terminals at the site.
Heathrow had set out its plans for expansion in the summer. The whole project, which is expected to cost £49bn, includes:
The Arora Group said it accepted the government’s choice, adding it welcomed the decision to leave the option open for other firms to bid for the work.
“It’s imperative there is a clear and transparent process for selecting a promoter to ensure it best serves the interests of consumers,” the group said.
Transport Secretary Heidi Alexander said Heathrow was the UK’s only hub airport that supported trade, tourism and jobs.
“Today is another important step to enable a third runway and build on these benefits, setting the direction for the remainder of our work to get the policy framework in place for airport expansion,” she said.
“This will allow a decision on a third runway plan this parliament which meets our key tests including on the environment and economic growth.”
The government has already approved a string of other airport expansion plans, including a second runway at Gatwick Airport.
However, the Heathrow plans face opposition from environmental groups, politicians, and local residents.
Tony Bosworth, climate campaigner at Friends of the Earth, said the plan was “virtually the equivalent of bolting an airport the size of Gatwick onto Heathrow”.
“That would mean more noise and air pollution for local communities,” he said.
“Expanding Heathrow simply isn’t compatible with our legally binding climate targets, even if the government meets its hugely optimistic assumptions for emerging technologies, such as sustainable aviation fuels.”
The Mayor of London, Sir Sadiq Khan, said he thought the government’s backing of a new runway was a mistake.
“I want a better Heathrow, not a bigger one, particularly at a time where Gatwick’s going to be expanded, Stansted is going to be expanded, City Airport’s going to be expanded, Luton’s going to be expanded,” he said.
“I’m unclear how you get a new runway at Heathrow and it doesn’t cause environmental damage, noise pollution, air pollution being exacerbated.”
In reaching its decision, the government said that Heathrow’s runway plan was better developed and, while it required “major works” to the M25, the rival Arora scheme would also have had a “considerable impact” on the motorway.
It added that while the Heathrow proposal requires more land, it involves the acquisition of fewer houses around the airport than Arora’s plan.
The government also said the longer runway would provide “greater resilience and potential futureproofing for next-generation aircraft”.
A spokesperson for Heathrow welcomed the decision but said it needed “clarity as to how the crucial next phase of the project will be regulated”.
The airport is seeking reassurance that it will be allowed to increase its fees by enough to cover the cost of the planning application, which it says it will have to start very soon to meet the government’s timetable.
Earlier this month, the chief executive of British Airways, Sean Doyle, told industry members and MPs that Heathrow should be expanded without moving the M25.
“I think we should look at ways of potentially building a shorter runway,” he said.
Some airlines are concerned that the cost of building the third runway will make the airport more expensive for them, and ultimately for customers.

Three years ago, if someone needed to fix a leaky faucet or understand inflation, they usually did one of three things: typed the question into Google, searched YouTube for a how-to video or shouted desperately at Alexa for help.
Today, millions of people start with a different approach: They open ChatGPT and just ask.
I’m a professor and director of research impact and AI strategy at Mississippi State University Libraries. As a scholar who studies information retrieval, I see that this shift of the tool people reach for first for finding information is at the heart of how ChatGPT has changed everyday technology use.
The biggest change isn’t that other tools have vanished. It’s that ChatGPT has become the new front door to information. Within months of its introduction on Nov. 30, 2022, ChatGPT had 100 million weekly users. By late 2025, that figure had grown to 800 million. That makes it one of the most widely used consumer technologies on the planet.
Surveys show that this use isn’t just curiosity – it reflects a real change in behavior. A 2025 Pew Research Center study found that 34% of U.S. adults have used ChatGPT, roughly double the share found in 2023. Among adults under 30, a clear majority (58%) have tried it. An AP-NORC poll reports that about 60% of U.S. adults who use AI say they use it to search for information, making this the most common AI use case. The number rises to 74% for the under-30 crowd.
Traditional search engines are still the backbone of the online information ecosystem, but the kind of searching people do has shifted in measurable ways since ChatGPT entered the scene. People are changing which tool they reach for first.
For years, Google was the default for everything from “how to reset my router” to “explain the debt ceiling.” These basic informational queries made up a huge portion of search traffic. But these quick, clarifying, everyday “what does this mean” questions are the ones ChatGPT now answers faster and more cleanly than a page of links.
And people have noticed. A 2025 U.S. consumer survey found that 55% of respondents now use OpenAI’s ChatGPT or Google’s Gemini AI chatbots about tasks they previously would have asked Google search to help them with, with even higher usage figures for the U.K. Another analysis of more than 1 billion search sessions found that traffic from generative AI platforms is growing 165 times faster than traditional searches, and about 13 million U.S. adults have already made generative AI their go-to tool for online discovery.
This doesn’t mean people have stopped “Googling,” but it means ChatGPT has peeled off the kinds of questions for which users want a direct explanation instead of a list of links. Curious about a policy update? Need a definition? Want a polite way to respond to an uncomfortable email? ChatGPT is faster, feels more conversational and feels more definitive.
At the same time, Google isn’t standing still. Its search results look different than they did three years ago because Google started weaving its AI system Gemini directly into the top of the page. The “AI Overview” summaries that appear above traditional search links now instantly answer many simple questions – sometimes accurately, sometimes less so.
But either way, many people never scroll past that AI-generated snapshot. This fact combined with the impact of ChatGPT are the reasons the number of “zero-click” searches has surged. One report using Similarweb data found that traffic from Google to news sites fell from over 2.3 billion visits in mid-2024 to under 1.7 billion in May 2025, while the share of news-related searches ending in zero clicks jumped from 56% to 69% in one year.
Google search excels at pointing to a wide range of sources and perspectives, but the results can feel cluttered and designed more for clicks than clarity. ChatGPT, by contract, delivers a more focused and conversational response that prioritizes explanation over ranking. The ChatGPT response can lack the source transparency and multiple viewpoints often found in a Google search.
In terms of accuracy, both tools can occasionally get it wrong. Google’s strength lies in letting users cross-check multiple sources, while ChatGPT’s accuracy depends heavily on the quality of the prompt and the user’s ability to recognize when a response should be verified elsewhere.
The impact of ChatGPT has reverberated beyond search engines. Voice assistants, such as Alexa speakers and Google Home, continue to report high ownership, but that number is down slightly. One 2025 summary of voice-search statistics estimates that about 34% of people ages 12 and up own a smart speaker, down from 35% in 2023. This is not a dramatic decline, but the lack of growth may indicate a shift of more complex queries to ChatGPT or similar tools. When people want a detailed explanation, a step-by-step plan or help drafting something, a voice assistant that answers in a short sentence suddenly feels limited.
By contrast, YouTube remains a giant. As of 2024, it had approximately 2.74 billion users, with that number increasing steadily since 2010. Among U.S. teens, about 90% say they use YouTube, making it the most widely used platform in that age group. But what kind of videos people are looking for is changing.
People now tend to start with ChatGPT and then move to YouTube if they need the additional information a how-to video conveys. For many everyday tasks, such as “explain my health benefits” or “help me write a complaint email,” people ask ChatGPT for a summary, script or checklist. They head to YouTube only if they need to see a physical process.
You can see a similar pattern in more specialized spaces. Software engineers, for instance, have long relied on sites such as Stack Overflow for tips and pieces of software code. But question volume there began dropping sharply after ChatGPT’s release, and one analysis suggests overall traffic fell by about 50% between 2022 and 2024. When a chatbot can generate a code snippet and an explanation on demand, fewer people bother typing a question into a public forum.
Three years in, ChatGPT hasn’t replaced the rest of the tech stack; it’s reordered it. The default search has shifted. Search engines are still for deep dives and complex comparisons. YouTube is still for seeing real people do real things. Smart speakers are still for hands-free convenience.
But when people need to figure something out, many now start with a chat conversation, not a search box. That’s the real ChatGPT effect: It didn’t just add another app to our phones – it quietly changed how we look things up in the first place.

When city leaders talk about making a town “smart,” they’re usually talking about urban digital twins. These are essentially high-tech, 3D computer models of cities. They are filled with data about buildings, roads and utilities. Built using precision tools like cameras and LiDAR – light detection and ranging – scanners, these twins are great at showing what a city looks like physically.
But in their rush to map the concrete, researchers, software developers and city planners have missed the most dynamic part of urban life: people. People move, live and interact inside those buildings and on those streets.
This omission creates a serious problem. While an urban digital twin may perfectly replicate the buildings and infrastructure, it often ignores how people use the parks, walk on the sidewalks, or find their way to the bus. This is an incomplete picture; it cannot truly help solve complex urban challenges or guide fair development.
To overcome this problem, digital twins will need to widen their focus beyond physical objects and incorporate realistic human behaviors. Though there is ample data about a city’s inhabitants, using it poses a significant privacy risk. I’m a public affairs and planning scholar. My colleagues and I believe the solution to producing more complete urban digital twins is to use synthetic data that closely approximates real people’s data.“
To build a humane, inclusive digital twin, it’s critical to include detailed data on how people behave. And the model should represent the diversity of a city’s population, including families with young children, disabled residents and retirees. Unfortunately, relying solely on real-world data is impractical and ethically challenging.
The primary obstacles are significant, starting with strict privacy laws. Rules such as the European Union’s General Data Protection Regulation, or GDPR, often prevent researchers and others from widely sharing sensitive personal information. This wall of privacy stops researchers from easily comparing results and limits our ability to learn from past studies.
Furthermore, real-world data is often unfair. Data collection tends to be uneven, missing large groups of people. Training a computer model using data where low-income neighborhoods have sparse sensor coverage means the model will simply repeat and even magnify that original unfairness. To compensate for this, researchers can use the statistical technique of weighting the data in the models to make up for the underrepresentation.
Synthetic data offers a practical solution. It is artificial information generated by computers that mimics the statistical patterns of real-world data. This protects privacy while filling critical data gaps.
Adding synthetic human dynamics fundamentally changes digital twins. It shifts them from static models of infrastructure to dynamic simulations that show how people live in the city. By generating synthetic patterns of walking, bus riding and public space use, planners can include a wider, more inclusive range of human actions in the models.
For example, Bogotá, Colombia, is using a digital twin to model its TransMilenio bus rapid transit system. Instead of relying only on limited or privacy-sensitive real-world sensor data, the city planners generated synthetic data to fill the digital twin. Such data artificially creates millions of simulated bus arrivals, vehicle speeds and queue lengths, all based on the statistical patterns – peak times, off-peak times – of actual TransMilenio operations.
This approach transforms urban planning in several crucial ways, making simulations more realistic and diverse. For example, planners can use synthetic pedestrian data to model how elderly and disabled residents would navigate a new urban design.
It also allows for risk-free testing of ideas. Planners can simulate diverse synthetic populations to see how a new flood evacuation plan would affect various groups, all without risking anyone’s safety or privacy in the real world.
For all the promises of synthetic data, it can only be helpful if planners can trust it. Since they base major decisions on these virtual worlds, the synthetic data must be proved to be a reliable replacement for real-world data. Planners can test this by checking to see if the main policy decisions they reach using the synthetic data are the same ones they would have made using real-world data that puts people’s privacy at risk. If the decisions match, the synthetic data is trustworthy enough to use for that planning task going forward.
Beyond technical checks, it’s important to consider fairness. This means routinely auditing the synthetic models to check for any hidden biases or underrepresentation across different groups. For example, planners can make sure an emergency evacuation plan in the urban digital twin works for elderly residents with mobility issues.
Most importantly, I believe planners should include their communities. Establishing citizen advisory boards and designing the synthetic data and simulation scenarios directly with the people who live in the city helps ensure that their experiences are accurately reflected.
By moving beyond static infrastructure to dynamic environments that include people’s behavior, synthetic data is set to play a critical role in urban planning. It will shape the resilient, inclusive and human-centered urban digital twins of the future.
A Dick’s Sporting Goods logo is displayed outside one of their stores on October 10, 2025 in San Diego, California.
Kevin Carter | Getty Images
This is CNBC’s Morning Squawk newsletter. Subscribe here to receive future editions in your inbox.
Here are five key things investors need to know to start the trading day:
A number of retail giants reported earnings this morning, offering the latest reading on the consumer in the run-up to Black Friday. The releases follow last week’s slew of retail earnings.
Here’s the latest reports:
A Broadcom sign is pictured as the company prepares to launch new optical chip tech to fend off Nvidia in San Jose, California, U.S., September 5, 2025.
Brittany Hosea-small | Reuters
FILE PHOTO: Former FBI Director James Comey testified in front of the Senate Intelligence Committee in the Senate Hart building on Capitol Hill, on Thursday, June 8, 2017.
Cheriss May | Nurphoto | Getty Images
Senior U.S. District Judge Cameron Currie threw out criminal cases against former FBI Director James Comey and New York Attorney General Letitia James yesterday.
Currie said Lindsey Halligan, the interim U.S. attorney who led the indictments, was invalidly appointed. Both cases were dismissed “without prejudice,” meaning the charges could be filed again.
The rulings mark a loss for President Donald Trump, who pressured Attorney General Pam Bondi to take action against his political foes. White House spokeswoman Abigail Jackson told CNBC that “this will not be the final word on this matter.”
People walk past the logo of Amazon Web Services (AWS) at its exhibitor stall at the India Mobile Congress 2025 at Yashobhoomi, a convention and expo center in New Delhi, India, October 8, 2025.
Anushree Fadnavis | Reuters
Amazon became the latest tech company to throw eye-popping sums behind AI buildout initiatives. The e-commerce giant said it will invest as much as $50 billion to expand its capacity to provide AI and high-performance computing capabilities for its cloud unit’s U.S. government customers.
The project is expected to begin in 2026 and will add close to 1.3 gigawatts of capacity. With the investment, government clients will also have access to Anthropic’s Claude models and Nvidia chips, in addition to Amazon hardware and software.
Also yesterday, Amazon said it will let businesses test its internet-from-space service, which was recently renamed Leo from Project Kuiper. As CNBC’s Annie Palmer notes, the product competes with SpaceX’s Starlink.
William Nylander #88 of the Toronto Maple Leafs celebrates with teammates after scoring a goal against the Boston Bruins during the third period in Game Seven of the First Round of the 2024 Stanley Cup Playoffs at TD Garden on May 04, 2024 in Boston, Massachusetts.
Maddie Meyer | Getty Images
CNBC Sport is out this morning with its new NHL team valuations for 2025. The average franchise has seen its value rise 15% to $2.2 billion, driven by pricier media rights deals.
The Toronto Maple Leafs remained at the front of the pack with a valuation of $4.3 billion, up 8% from last year. The New York Rangers is the runner-up, rising by 9% year over year to $4.8 billion.
Microsoft faced vocal community opposition to a data center plan in Caledonia, Wisconsin, leading the tech giant to scrap its plans and look elsewhere. CNBC’s Jordan Novet broke down the local reaction.
“We did seem to have awoken a sleeping giant.”
Fran Martin
Caledonia trustee
— CNBC’s Gabrielle Fonrouge, Sean Conlon, Pia Singh, Dan Mangan, Kevin Breuninger, Annie Palmer, Yun Li, Michael Ozian and Jordan Novet contributed to this report. Terri Cullen edited this edition.
SAN JOSE, Calif., November 25, 2025 – Cisco (NASDAQ: CSCO) will participate in the following events with the financial community in December:
No new financial information will be discussed at these events.
UBS Global Technology and AI Conference
Arizona, December 2nd
Fireside Chat at 9:55 am PST (Webcast & registration will be made available on investor.cisco.com)
Cisco Representatives:
Bill Gartner, SVP/GM, Optical Systems and Optics
Sami Badri, VP, Head of Investor Relations & Strategic Finance
Nasdaq London Investor Conference
London, December 10th
Investor meetings
Cisco Representatives:
Chintan Patel, VP & CTO, Solutions Engineering, Cisco EMEA
Emily Hunt, Director, Investor Relations
Barclays TMT Conference
San Francisco, December 10th
Fireside Chat at 1:20 pm PST (Webcast & registration will be made available on investor.cisco.com)
Cisco Representatives:
Mark Patterson, EVP & CFO
Sami Badri, VP, Head of Investor Relations & Strategic Finance
Melius Research Conference
New York, December 11th
Investor meetings
Cisco Representative:
Sami Badri, VP, Head of Investor Relations & Strategic Finance
About Cisco
Cisco (NASDAQ: CSCO) is the worldwide technology leader that is revolutionizing the way organizations connect and protect in the AI era. For more than 40 years, Cisco has securely connected the world. With its industry leading AI-powered solutions and services, Cisco enables its customers, partners and communities to unlock innovation, enhance productivity and strengthen digital resilience. With purpose at its core, Cisco remains committed to creating a more connected and inclusive future for all. Discover more on The Newsroom and follow us on X at @Cisco.
Cisco and the Cisco logo are trademarks or registered trademarks of Cisco and/or its affiliates in the U.S. and other countries. A listing of Cisco’s trademarks can be found at http://www.cisco.com/go/trademarks. Third-party trademarks mentioned are the property of their respective owners. The use of the word ‘partner’ does not imply a partnership relationship between Cisco and any other company.
# # #
Ever wondered what happens to a wind turbine after decades of loyal service? Vattenfall believes in rewriting the narrative of wind turbine retirement. Instead of the end, it marks the beginning of a new chapter: one that’s all about creativity and circularity. Vattenfall’s Rewind platform, on display at the Dutch Design Week 2025 exhibition, showed how turbine components can be given a second life – both within the wind industry and far beyond.
With thousands of wind turbines worldwide approaching the end of their operational life, the question is not just how to recycle them, but how to unlock their hidden potential. Over 90 percent of a wind turbine’s materials such as steel, copper and electronics are already reused or recycled. The real challenge comes with the remaining parts, especially complex components and composites that don’t fit traditional recycling streams. Built for extreme conditions, wind turbine components can often last for more years in less challenging roles. But how to find smart and meaningful ways to give these materials a second life? The solution lies in designing with reuse: instead of viewing discarded turbines as waste, we should consider their components as a gold mine of resources.
“Sustainability is not only about generating fossil-free electricity, it’s also about what happens next”, says Thomas Hjort, Head of Innovation Offshore Wind at Vattenfall. “A gearbox, for example, that has withstood North Sea storms for years is strong enough for a second life in a less demanding environment. By prioritising the use of existing components, designers, developers, and engineers can bridge the gap between the ideal and the available, often finding smarter, more affordable, and more sustainable solutions than if they were to start from scratch.”
Vattenfall’s Rewind platform builds on an idea first presented last year, when Vattenfall and its partners amazed visitors of Dutch Design Week (DDW) in Eindhoven by transforming the glass-fibre turbine nacelle – the heart of the turbine – into a stylish, ten-meter-long tiny house that met the Dutch tiny house standards. This was a powerful demonstration that highlighted the value of collaborating with the design community, showing that reuse can be not only practical, but also visually striking. It proves that reuse is not just an environmental duty, but also a source of creativity and inspiration.
In Lelystad’s harbour in the Netherlands, Vattenfall has successfully tested the potential of reusing turbine blades as flotation supports for land development and floating housing. This idea was linked to Vattenfall’s R&D team that worked on a concept for the development of floating habitats in Sweden. As part of its biodiversity programme in hydro power plants, Vattenfall is designing and implementing solutions to enhance biodiversity in suitable conditions. In rivers with hydropower dams, floating islands can adapt to the fluctuating water levels and provide a stable platform for flora and fauna to breed and flourish. Because turbine blades are manufactured using similar technology as in shipbuilding and can last for fifty years or more in relatively calm water environments, these blades, when no longer in use in a wind farm, can be repurposed in hydro power areas to form the floating islands that create new habitats.
The next step in the circularity movement is to explore the potential of discarded turbine components: a single nacelle contains over 10,000 technical parts. By encouraging out-of-the-box thinking and bringing together experts from design, technology, and various sectors, unexpected value and applications can be found for these components – giving them a purpose far beyond what they were originally intended for.
“Once you see what is possible, your view of old components will change forever. Moving from reusing materials to giving entire parts a new purpose is exactly the effect Vattenfall hoped to achieve when building the tiny house”, explains Thomas Hjort.
At DDW 2025, Vattenfall demonstrated this next step by launching ‘Rewind’: a digital platform that makes reusing turbine components easier and more accessible. Picture it as a digital warehouse for turbine parts equipped with a user-friendly touchscreen interface, almost similar to those found in fast food restaurants. Builders, developers and innovators can easily browse available components, check specifications, and share creative ideas for new applications. An AI-powered chatbot, drawing on past exhibition data, research, and component details, guides users through the ideation process with multiple-choice prompts. Thanks to AI, users can visualise and download their concepts before bringing them to life. By playfully combining different parts like ‘Lego blocks’, the tool generates hundreds of ideas for reuse in the wind industry and beyond.
“By opening a catalogue of used parts where the outside world can ‘shop’ for components built to last in harsh conditions, we primarily want to encourage a perspective change where developers and designers work with what is already available, rather than always seeking the perfect new solution”, Thomas Hjort comments on the idea behind the tool.
These are just a few of the creative applications in which the Rewind platform helps users to rethink turbine components, and open new opportunities to push circularity limits across different sectors:
Agriculture: Gearboxes, yaw drives, cooling systems, pipes, and pumps can be repurposed into robust irrigation systems for water-scarce regions. Rotor blades become irrigation arms, while turbine cooling systems ensure reliable water distribution.
E-mobility: Wind turbine nacelles contain advanced electronics and components like switches, generators and converters that can be reused to build affordable electric vehicle charging stations. The nacelle cover can serve as the station’s shell. EV charging stations help to deliver energy when needed, supporting smarter charging and grid solutions.
Construction: The tough, lightweight composite panels from nacelles make great bus shelters, parking garages, sound barriers, info kiosks, or festival pavilions, giving hard-to-recycle materials a second life.
By breaking down and displaying the individual components that form a wind turbine, the Rewind initiative has revealed how these robust parts can play a vital role in strengthening and updating electricity distribution networks. As society moves towards increased electrification, these reused materials offer smart solutions to help grids keep pace with growing energy demands.
Thomas Hjort states: “This is particularly interesting given its relevance today and the significant overlap in key components, such as cables, high-voltage switchgear, climate control systems, and monitoring equipment, which are essential for wind turbines as well as modern electricity grids. Together with grid operators, Vattenfall sees great potential and financial value in leveraging these shared components to support and upgrade infrastructure necessary for a more electrified future.”
Embracing circularity offers both environmental and economic benefits. Building smart value chains around reused materials helps businesses uphold ecological responsibilities while achieving financial gains. Designing components to last for decades and planning for their future reintegration into the supply chain can ensure sustainable value and efficient resource management.
“The more minds contributing, the more innovative and impactful the solutions become. Circularity should not be buzzword but represent a mindset”, emphasises Thomas Hjort. “Vattenfall may not be the sole driver behind all subsequent applications of turbine components, but we do want to start the thought process, help realise the first proofs of concept, and push the next step in circularity. When reuse value chains are combined with profitable business models, circularity and good business go hand in hand, and become the new normal. Taking responsibility for our assets after they reach their end of life is part of working for fossil freedom.”
Picture above text: Will turbine blades soon be reused as irrigation systems? Impression generated with AI
