AZOUR, Israel, Nov. 24, 2025 /PRNewswire/ — Ituran Location and Control Ltd. (NASDAQ: ITRN), a global leader in vehicle telematics, today announced that it has signed an initial three-year service agreement with a new major European OEM, Renault. The contract covers multiple countries in the Latin American region and there is strong potential for expansion to additional markets globally as well as extended service periods.
Eyal Sheratzky, co-CEO of Ituran commented, “We are thrilled to announce this new agreement with Renault, bringing Ituran’s service and tracking solutions to their Latin American customers. We are excited with the long-term potential of this agreement which allows us to more broadly sell our service offerings, strengthening our presence in Latin America. It also brings us new customers of another leading global OEM, potentially accelerating our long-term net subscriber growth.”
André Mói, Purchasing Director at Renault, added, “Renault is committed to offering high-quality and innovative services to its customers. The agreement with Ituran is aligned with our strategy of working with leading suppliers in the market to ensure the best solutions for our customers.”
About Ituran
Ituran is a leader in the mobility technology field, providing value-added location-based services, including a full suite of services for the connected-car. Ituran offers Stolen Vehicle Recovery, fleet management as well as mobile asset location, management & control services for vehicles, cargo and personal security for the retail, insurance industry and car manufacturers. Ituran is the largest OEM telematics provider in Latin America. Its products and applications are used by customers in over 20 countries. Ituran is also the founder of the Tel-Aviv based DRIVE startup incubator to promote the development of smart mobility technology.
Ituran’s subscriber base has been growing significantly since the Company’s inception to over 2.5 million subscribers using its location-based services with a market leading position in Israel and Latin America. Established in 1995, Ituran has approximately 2,800 employees worldwide, with offices in Israel, Brazil, Argentina, Mexico, Ecuador, Columbia, India, Canada and the United States.
For more information, please visit Ituran’s website, at: www.ituran.com
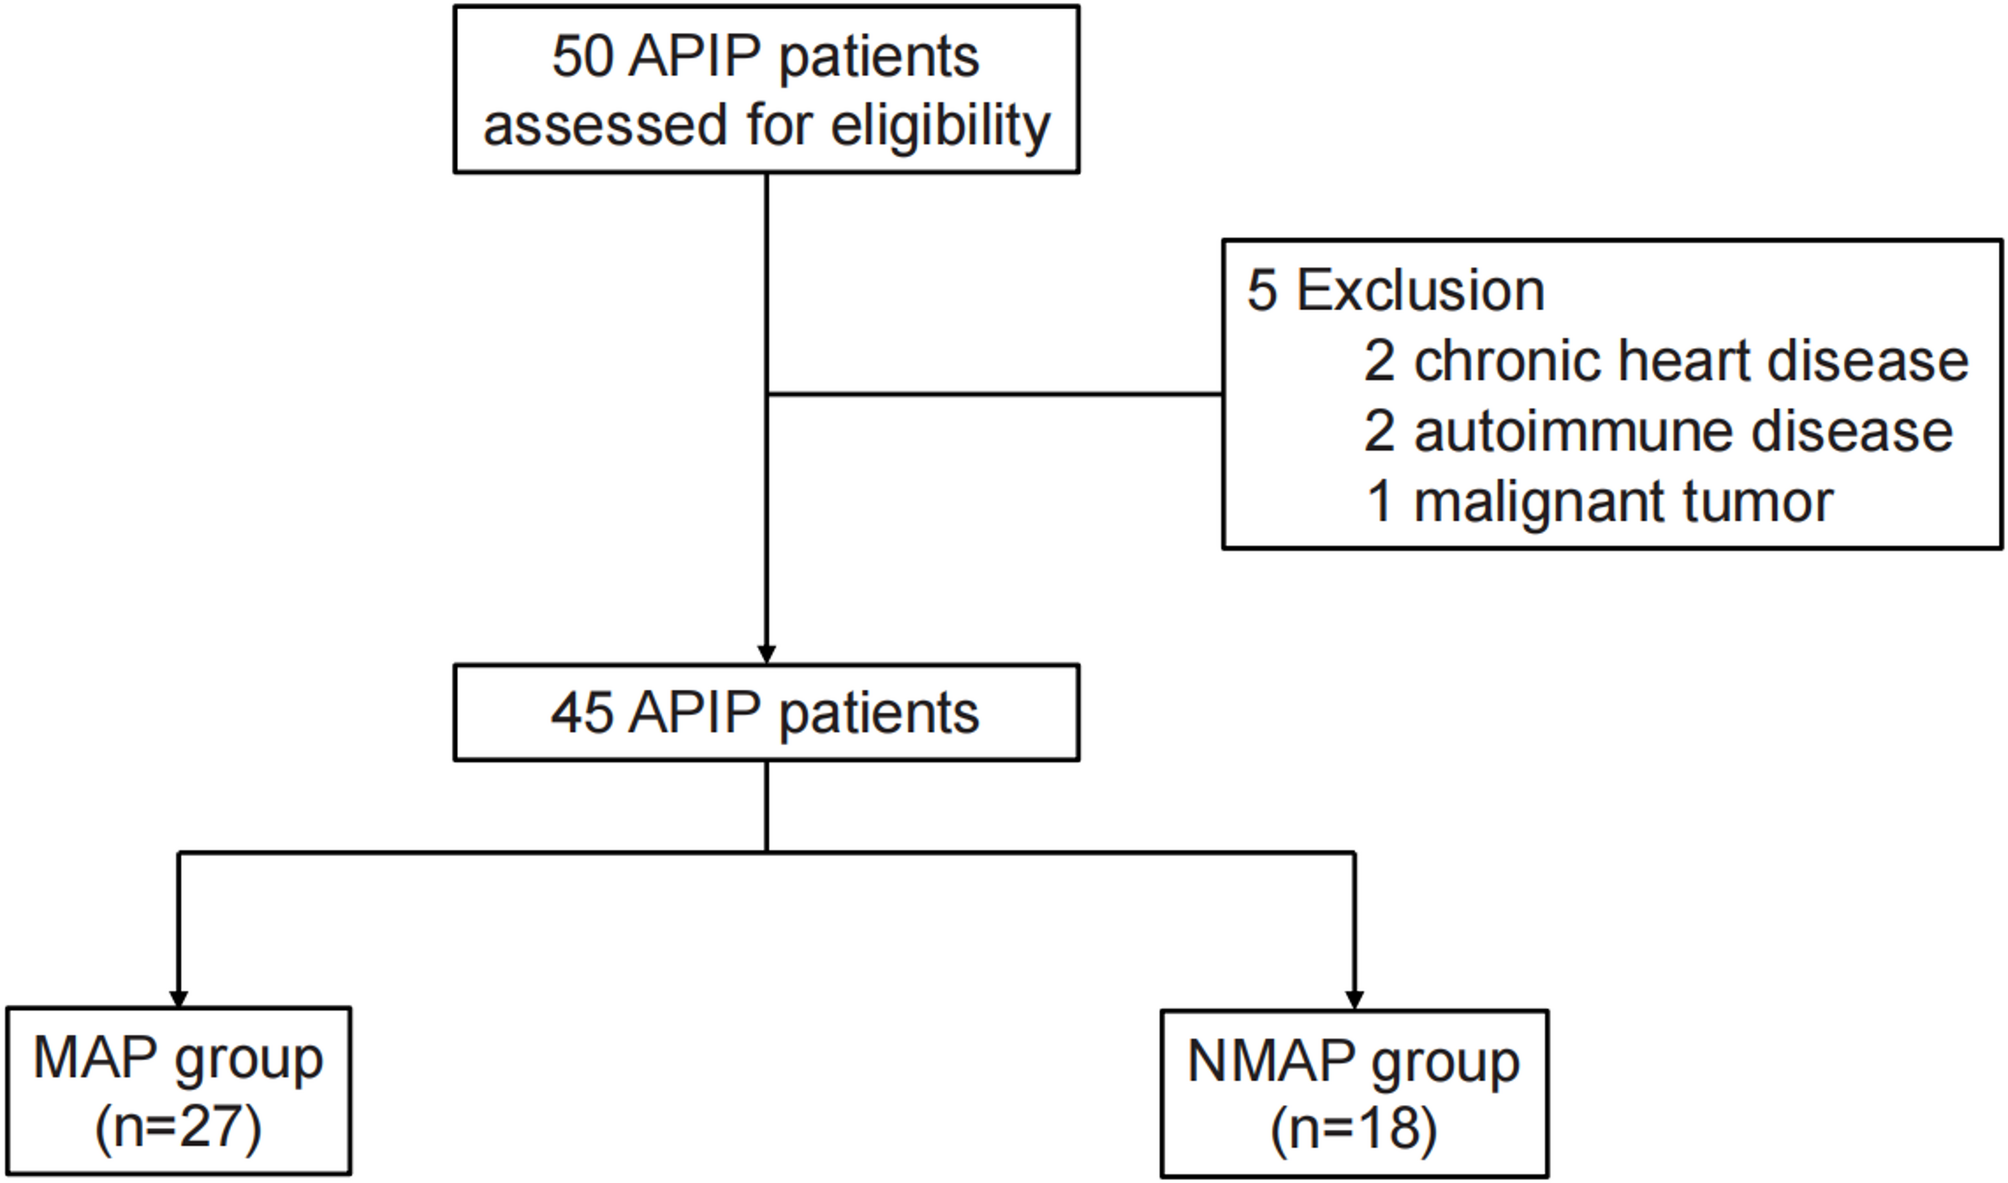
APIP is a rare but critical disease, which could lead to adverse outcome both in pregnant women and fetus [10]. In our study, 66.7% of NMAP patients were admitted into ICU and 61.1% NMAP patients end the pregnancy, with longer hospital stays than MAP patients. As a special type of AP, APIP is differ from other types of AP, owing to anatomical and physiological changes in pregnancy. Despite several literatures having reported the risk factors of APIP patients [11,12,13], there is still lack of study to develop a practical tool to predict the prognosis for APIP patients.
To our knowledge, the unique physiological state of pregnancy could affect bile flow, bile composition, gallbladder contractility, gallbladder postprandially emptying and lipid metabolism, might lead to gallstone formation, cholestasis, hyperlipidemia and so on, which contribute to occurrence of APIP [14]. Our study showed that the etiology of APIP was mainly biliary (37.8%) and hypertriglyceridemia (15.6%). In Europe and America, gallstones are the most etiology of APIP consistent with our study [15]. However, the most common etiology of APIP in several Chinese research cohorts was hypertriglyceridemia [16, 17]. Obviously, though our data primarily originate from China, the etiological composition may still vary across different regions within the same country. In the future, it will be necessary to include populations from more regions and country for analysis. Interestingly, in our cohort, APIP patients with hypertriglyceridemia exhibited a higher proportion of NMAP group than MAP group (85.7% VS 14.3%), but biliary APIP was more common in MAP group than in NMAP group (82.4% VS 17.6%), which might suggest the risk of hypertriglyceridemia in APIP patients. The underlying mechanisms for this observed disparity are likely multifactorial. Pregnancy is characterized by physiological hyperlipidemia and a state of heightened inflammatory readiness [18, 19]. In hypertriglyceridemia-induced APIP, the massive release of serum fatty acid may induce severe pancreatic injury and a potent systemic inflammatory response, resulting in respiratory, kidney, and cardiovascular failure in AP patient [20]. On the other hand, the management of biliary APIP, often involving timely endoscopic intervention to relieve obstruction, may lead to the termination of disease process. It is recommended to pay more attention to the management of hypertriglyceridemia-induced APIP patients.
To date, there are no standardized and special scoring systems to evolute the severity and prognosis of APIP. Computed tomography scan is main technique for AP prognostic estimation, while is unsuitable for pregnant woman. Risk stratification of APIP patients still rely on clinical experience. Previous studies showed that routine laboratory tests were useful predictors in the early assessment of the severity of AP [7, 21]. Several prognostic models have been constructed based on clinical laboratory tests for APIP patients. Tang’s team established a nomogram model for predicting the risk factors of APIP, which contained five indicators including diabetes, triglyceride, Body Mass Index, white blood cell, and C-reactive protein [22]. Yang et al. also constructed a predictive model based on four indicators including lactate dehydrogenase, triglyceride, cholesterol, and albumin [23]. However, these prediction models of APIP require more indicators, simpler and practical tools are still needed. Our nomogram incorporates only two readily available variables including ALB and BUN based on stepwise logistic regression and LASSO regression. This makes our model more accessible for rapid clinical decision-making. Besides, in terms of predictive accuracy, our model achieved an AUC of 0.920, which is competitive with the high AUC of 0.942 reported by Tang et al. and superior to the model by Yang et al. (AUC: 0.865). What’s more, as the ROC curves and calibration curves showed, the model also could effectively predict the probability of pregnant woman admitted ICU (AUC: 0.819). Notably, previous models have rarely been developed to predict ICU admission of APIP patients. In a word, our model not only maintains high predictive accuracy but also excels in simplicity and clinical usability.
There were several scoring systems utilized for the assessment of severity in AP patients, such as Ranson and APACHE-II scoring systems. However, these scoring systems incorporate clinical, laboratory and radiographic data, usually demand at least 48 h to evaluate the severity. And the items of these scoring systems were too complex to be inconvenient for clinicians to use. Besides, BISAP and SIRS score were also used to evaluate severity in AP patients in the first 24 h. In this study, the model only contained two items in assessment of APIP severity and was visualized as nomogram, with robustness and accuracy. Figure 3A also showed that the AUC of nomogram was higher than BISAP score and SIRS score, which indicated nomogram may be more suitable for APIP patients.
It is known that ALB is a plasma protein synthesized by the liver, which plays an important role in maintaining plasma colloid osmotic pressure, transporting substances, etc. Numerous studies have demonstrated that ALB and other serum nutritional biomarkers played a significant role in the disease prognosis prediction including cancer, abdominal sepsis and so on [24,25,26]. Studies reported that the synthesis of ALB usually decreases while patients suffer from AP [27]. Meanwhile, the inflammatory response leads to the rise of capillary permeability, resulting in a large loss of ALB and a decrease in serum ALB levels [28]. In this study, ALB obtained within the first 24 h after admission was found to be an independent risk factor of the severity of APIP. Previous studies also showed that AP patients with low level ALB usually had poor prognosis [29]. Our study showed that ALB exhibited moderate diagnosis values to predict APIP prognosis. Previous studies found that combination of ALB and other laboratory indicators could effectively enhance predictive performance [30, 31]. Present study also showed that the AUC of nomogram incorporating ALB and BUN was higher than single indicator. By integrating these predictors, the model could offer more reliable prediction results. Additionally, ALB could be easily detected from peripheral blood at a low cost, which could contribute to clinical evaluation for APIP. However, it is necessary to recognize that various factors could influence the levels of ALB, such as nutritional status, other complications (liver or kidney) and exogenous ALB [32].
In addition, BUN was also selected in our prognostic model. In general, BUN is related to glomerular filtration and volume status. At the onset of AP, BUN is observed to be ascending because of the decrease of the intravascular volume, fluid loss in body and acute renal injury [33]. The level of BUN has been deemed to be one of the most valuable single routine laboratory tests for predicting mortality in AP, as well as included in BISAP and RANSON scoring systems [33]. Remarkably, BUN is also disturbed by various factors, including protein intake, gastrointestinal bleeding, corticosteroid use and so on, which might lead to interference in disease evaluation [34]. In this study, we identified BUN obtained within the first 24 h after admission as an independent risk factor after multivariate analysis. It implies that BUN could be an effective predictor of APIP, but the influence of other factors should be taken into consideration.
There were several limitations to the present study. First, due to the rarity of APIP, the sample size of present study was small. More clinical centers should participate in statistics in the future, and the model still needs to verify in an external and larger cohort. Second, as a retrospective study, some clinical data was not available. Thus, comparison of other scoring systems cannot be achieved, such as Ranson and APACHE-II score. It is necessary to collect more data in next research.
FAO. FAO Statistical Yearbook 2023. Food and Agriculture Organization of the United Nation. 2023.
Helios W, Serafin-Andrzejewska M, Kozak M, Lewandowska S. Impact of nitrogen fertilisation and inoculation on soybean nodulation, nitrogen status, and yield in a central European climate. Agriculture (Basel). 2025;15(15):1654.
Article
Google Scholar
Luo D, Chen Y, Lin H. Agronomic Optimization of Fertilization and Irrigation Regimes for High-Yield Soybean Cultivation. Field Crop. 2025;8(4):176–86.
Google Scholar
Luo K, Yuan X, Zhang K, Fu Z, Lin P, Li Y, Yong T, et al. Soybean Variety Improves Canopy Architecture and Light Distribution to Promote Yield Formation in Maize–Soybean Strip Intercropping. Plant Cell Environ. 2025.
Ali MF, Ma L, Sohail S, Zulfiqar U, Hussain T, Lin X, et al. Zinc biofortification in cereal crops: overview and prospects. J Soil Sci Plant Nutr. 2025;25:4260–94. https://doi.org/10.1007/s42729-025-02396-x.
Article
Google Scholar
Brahma B, Hammermeister A, Lynch D, Smith P, Nath AJ. Significance of land management practices under haskap orchards to mitigate the degradations of soil organic carbon stocks and soil health because of land use changes from forest and grassland. Soil Use Manage. 2025;41(1):e70037.
Article
Google Scholar
Aarif M, Alam A, Hotak Y. Smart sensor technologies shaping the future of precision agriculture: Recent advances and future outlooks. J Sensors. 2025;2025:2460098.
Lhotáková Z, Neuwirthová E, Potůčková M, Červená L, Hunt L, Kupková L, et al. Mind the leaf anatomy while taking ground truth with portable chlorophyll meters. Sci Rep. 2025;15(1):1855.
Article
PubMed
PubMed Central
Google Scholar
Tsaniklidis G, Makraki T, Papadimitriou D, Nikoloudakis N, Taheri-Garavand A, Fanourakis D. Non-destructive estimation of area and greenness in leaf and seedling scales: a case study in cucumber. Agronomy. 2025;15(10):2294.
Article
Google Scholar
Bulacio Fischer PT, Carella A, Massenti R, Fadhilah R, Lo Bianco R. Advances in monitoring crop and soil nutrient status: proximal and remote sensing techniques. Horticulturae. 2025;11(2):182. https://doi.org/10.3390/horticulturae11020182.
Article
Google Scholar
Paul NC, Ponnaganti N, Gaikwad BB, Sammi Reddy K, Nangare DD. Optimized soil adjusted vegetation index mapping of Pune district using Google Earth Engine. Remote Sens Lett. 2025;16(7):728–36.
Article
Google Scholar
Yan K, Gao S, Yan G, Ma X, Chen X, Zhu P, et al. A global systematic review of the remote sensing vegetation indices. Int J Appl Earth Obs Geoinf. 2025;139:104560.
Google Scholar
Berry A, Vivier MA, Poblete-Echeverría C. Evaluation of canopy fraction-based vegetation indices, derived from multispectral UAV imagery, to map water status variability in a commercial vineyard. Irrig Sci. 2025;43(1):135–53.
Article
Google Scholar
Anand SL, Visakh R, Nalishma R, Sah RP, Beena R. High throughput phenomics in elucidating drought stress responses in rice (Oryza sativa L.). J Plant Biochem Biotechnol. 2025;34(1):119–32. https://doi.org/10.1007/s13562-024-00949-2.
Maimaitijiang M, Sagan V, Sidike P, Hartling S, Esposito F, Fritschi FB. Soybean yield prediction from UAV using multimodal data fusion and deep learning. Remote Sens Environ. 2020;237:111599.
Article
Google Scholar
Xie C, Yang C. A review on plant high-throughput phenotyping traits using UAV-based sensors. Comput Electron Agric. 2020;178:105731.
Article
Google Scholar
Nugroho AP, Wiratmoko A, Nugraha D, Markumningsih S, Sutiarso L, Falah MAF, Okayasu T. Development of a low-cost thermal imaging system for water stress monitoring in indoor farming. Smart Agric Technol 2025;11:101048. https://doi.org/10.1016/j.atech.2025.101048.
Yang CY, Zhang YC, Hou YL. Assessing water status in rice plants in water-deficient environments using thermal imaging. Bot Stud (Taipei). 2025;66(1):6.
Article
Google Scholar
Sharma H, Sidhu H, Bhowmik A. Remote sensing using unmanned aerial vehicles for water stress detection: a review focusing on specialty crops. Drones. 2025;9(4):241.
Article
Google Scholar
Zhai W, Cheng Q, Duan F, Huang X, Chen Z. Remote sensing-based analysis of yield and water-fertilizer use efficiency in winter wheat management. Agric Water Manage. 2025;311:109390.
Article
Google Scholar
Denre M, Shyamrao ID, Kumar A. Study on zinc as plant nutrient: a review. J Sci Res Rep. 2025;31(6):972–99.
Article
Google Scholar
Madaan I, Sharma P, Singh AD, Dhiman S, Kour J, Kumar P, et al. Zinc and plant hormones: an updated review. Zinc in Plants; 2025. p. 193–223. ISBN: 978-0-323-91314-0.
Pelagio-Flores R, Ravelo-Ortega G, García-Pineda E, López-Bucio J. A century of Azospirillum: plant growth promotion and agricultural promise. Plant Signal Behav. 2025;20(1):2551609.
Article
PubMed
PubMed Central
Google Scholar
Egli DB, Bruening WP. Temporal profiles of pod production and pod set in soybean. Eur J Agron. 2006;24(1):11–8.
Article
Google Scholar
Uddling J, Gelang-Alfredsson J, Piikki K, Pleijel H. Evaluating the relationship between leaf chlorophyll concentration and SPAD-502 chlorophyll meter readings. Photosynth Res. 2007;91(1):37–46.
Article
PubMed
Google Scholar
Broadley MR, White PJ, Hammond JP, Zelko I, Lux A. Zinc in plants. New Phytol. 2007;173(4):677–702.
Article
PubMed
Google Scholar
Díaz-Rodríguez AM, Parra Cota FI, Cira Chávez LA, García Ortega LF, Estrada Alvarado MI, Santoyo G, et al. Microbial inoculants in sustainable agriculture: advancements, challenges, and future directions. Plants. 2025;14(2):191.
Article
PubMed
PubMed Central
Google Scholar
Hungria M, Campo RJ, Mendes IC, Graham PH. Contribution of biological nitrogen fixation to the N nutrition of grain crops in the tropics: the success of soybean (Glycine max L. Merr.) in South America. In: Singh RP, Shankar N, Jaiwal PK, editors. Nitrogen nutrition and sustainable plant productivity. Houston: Studium Press; 2006. p. 43–93. ISBN 1-933699-00-0.
Lee H, Kang Y, Kim J. Remote sensing-based assessment of soybean growth and yield prediction using integrated spectral and thermal indices. Front Plant Sci. 2023;14:1182314. https://doi.org/10.3389/fpls.2023.1182314.
Article
Google Scholar
Ma BL, Dwyer LM, Costa C, Cober ER, Morrison MJ. Early prediction of soybean yield from canopy reflectance measurements. Agron J. 2001;93(6):1227–34.
Article
Google Scholar
Pineda M, Perez-Bueno ML, Barón M, Calderón R. Assessment of crop performance under stress conditions by remote sensing: A case study in soybean. Agric For Meteorol. 2021;311:108663. https://doi.org/10.1016/j.agrformet.2021.108663.
Article
Google Scholar
Richardson AD, Duigan SP, Berlyn GP. An evaluation of noninvasive methods to estimate foliar chlorophyll content. New Phytol. 2002;153(1):185–94.
Article
Google Scholar
Gitelson AA. Wide dynamic range vegetation index for remote quantification of biophysical characteristics of vegetation. J Plant Physiol. 2004;161(2):165–73.
Article
PubMed
Google Scholar
Hansen PM, Schjoerring JK. Reflectance measurement of canopy biomass and nitrogen status in wheat crops using normalized difference vegetation indices and partial least squares regression. Remote Sens Environ. 2003;86(4):542–53.
Article
Google Scholar
Rondeaux G, Steven M, Baret F. Optimization of soil-adjusted vegetation indices. Remote Sens Environ. 1996;55(2):95–107.
Article
Google Scholar
Kumagai E, Aoki N, Masuya Y, Shimono H. Phenotypic plasticity conditions the response of soybean seed yield to elevated atmospheric CO2 concentration. Plant Physiol. 2015;169(3):2021–9.
PubMed
PubMed Central
Google Scholar
Turnage, G. Sampling Submersed Aquatic Plant Biomass: Fresh vs. Dry Weight. GeoSystems Research Institute Report, 5093. Mississippi State University. 2022.
Xu Z, Zhou G. Responses of photosynthetic capacity to soil moisture gradient in perennial rhizome grass and perennial bunchgrass. BMC Plant Biol. 2011;11(1):21.
Article
PubMed
PubMed Central
Google Scholar
Yan S, Weng B, Jing L, Bi W. Effects of drought stress on water content and biomass distribution in summer maize (Zea mays L.). Front Plant Sci. 2023;14:1118131.
Article
PubMed
PubMed Central
Google Scholar
Gomez, K.A., and A. A. Gomez. Statistical procedures for agricultural research. 2 st Ed. John wiley and sons; New York (U.S.A.). 1984. https://pdf.usaid.gov/pdf_docs/PNAAR208.pdf
McKinney W. Data structures for statistical computing in Python. Scipy. 2010;445(1):51–6.
Waskom ML. Seaborn: statistical data visualization. J Open Source Softw. 2021;6(60):3021.
Article
Google Scholar
Virtanen P, Gommers R, Oliphant TE, Haberland M, Reddy T, Cournapeau D, et al. SciPy 1.0: fundamental algorithms for scientific computing in Python. Nat Methods. 2020;17(3):261–72.
Article
PubMed
PubMed Central
Google Scholar
Tunc M, Ipekesen S, Basdemir F, Akinci C, Bicer BT. Effect of Organic and Inorganic Fertilizer Doses on Yield and Yield Components of Common Beans. J Anim Plant Sci. 2023;33:1333–45. https://doi.org/10.36899/JAPS.2023.6.0673.
Hungria M, de O Chueire LM, Coca RG, Megı́as M. Preliminary characterization of fast growing rhizobial strains isolated from soyabean nodules in Brazil. Soil Biol Biochem. 2001;33(10):1349–61.
Article
Google Scholar
Fritschi FB, Ray JD. Soybean leaf nitrogen, chlorophyll content, and chlorophyll a/b ratio. Photosynthetica. 2007;45(1):92–8.
Article
Google Scholar
Zhao C, Liu B, Xiao L, Hoogenboom G, Boote KJ, Kassie BT, et al. A SIMPLE crop model. Eur J Agronomy. 2018;100:138–53. https://doi.org/10.1016/j.eja.2018.01.002.
Article
Google Scholar
Haboudane D, Miller JR, Pattey E, Zarco-Tejada PJ, Strachan IB. Hyperspectral vegetation indices and novel algorithms for predicting green LAI of crop canopies: modeling and validation in the context of precision agriculture. Remote Sens Environ. 2004;90(3):337–52.
Article
Google Scholar
Peng S, Chen A, Xu L, Cao C, Fang J, Myneni RB, et al. Recent change of vegetation growth trend in China. Environ Res Lett. 2011;6(4):044027.
Article
Google Scholar
Moges SM, Raun WR, Mullen RW, Freeman KW, Johnson GV, Solie JB. Evaluation of mid-season spectral reflectance indices for predicting grain yield and grain protein in winter wheat. J Plant Nutr. 2005;27(6):1061–80. https://doi.org/10.1081/PLN-120038544.
Article
Google Scholar
Rufaioğlu SB, Bilgili AV, Savaşlı E, Özberk İ, Aydemir S, Ismael AM, et al. Sensor-based yield prediction in durum wheat under semi-arid conditions using machine learning across Zadoks growth stages. Remote Sens. 2025;17(14):2416.
Article
Google Scholar
Jones HG. Irrigation scheduling: advantages and pitfalls of plant-based methods. J Exp Bot. 2004;55(407):2427–36.
Article
PubMed
Google Scholar
Costa JM, Grant OM, Chaves MM. Thermography to explore plant–environment interactions. J Exp Bot. 2013;64(13):3937–49.
Article
PubMed
Google Scholar
Prasad B, Carver BF, Stone ML, Babar MA, Raun WR, Klatt AR. Genetic analysis of indirect selection for winter wheat grain yield using spectral reflectance indices in wheat breeding. Field Crop Res. 2017;200:1–13. https://doi.org/10.1016/j.fcr.2016.10.001.
Article
Google Scholar
González-Dugo V, Zarco-Tejada PJ, Fereres E. Applicability and limitations of using the crop water stress index as an indicator of water deficits in citrus orchards. Agric For Meteorol. 2014;198:94–104.
OFAc improved bamboo shoot yield while maintaining overall quality
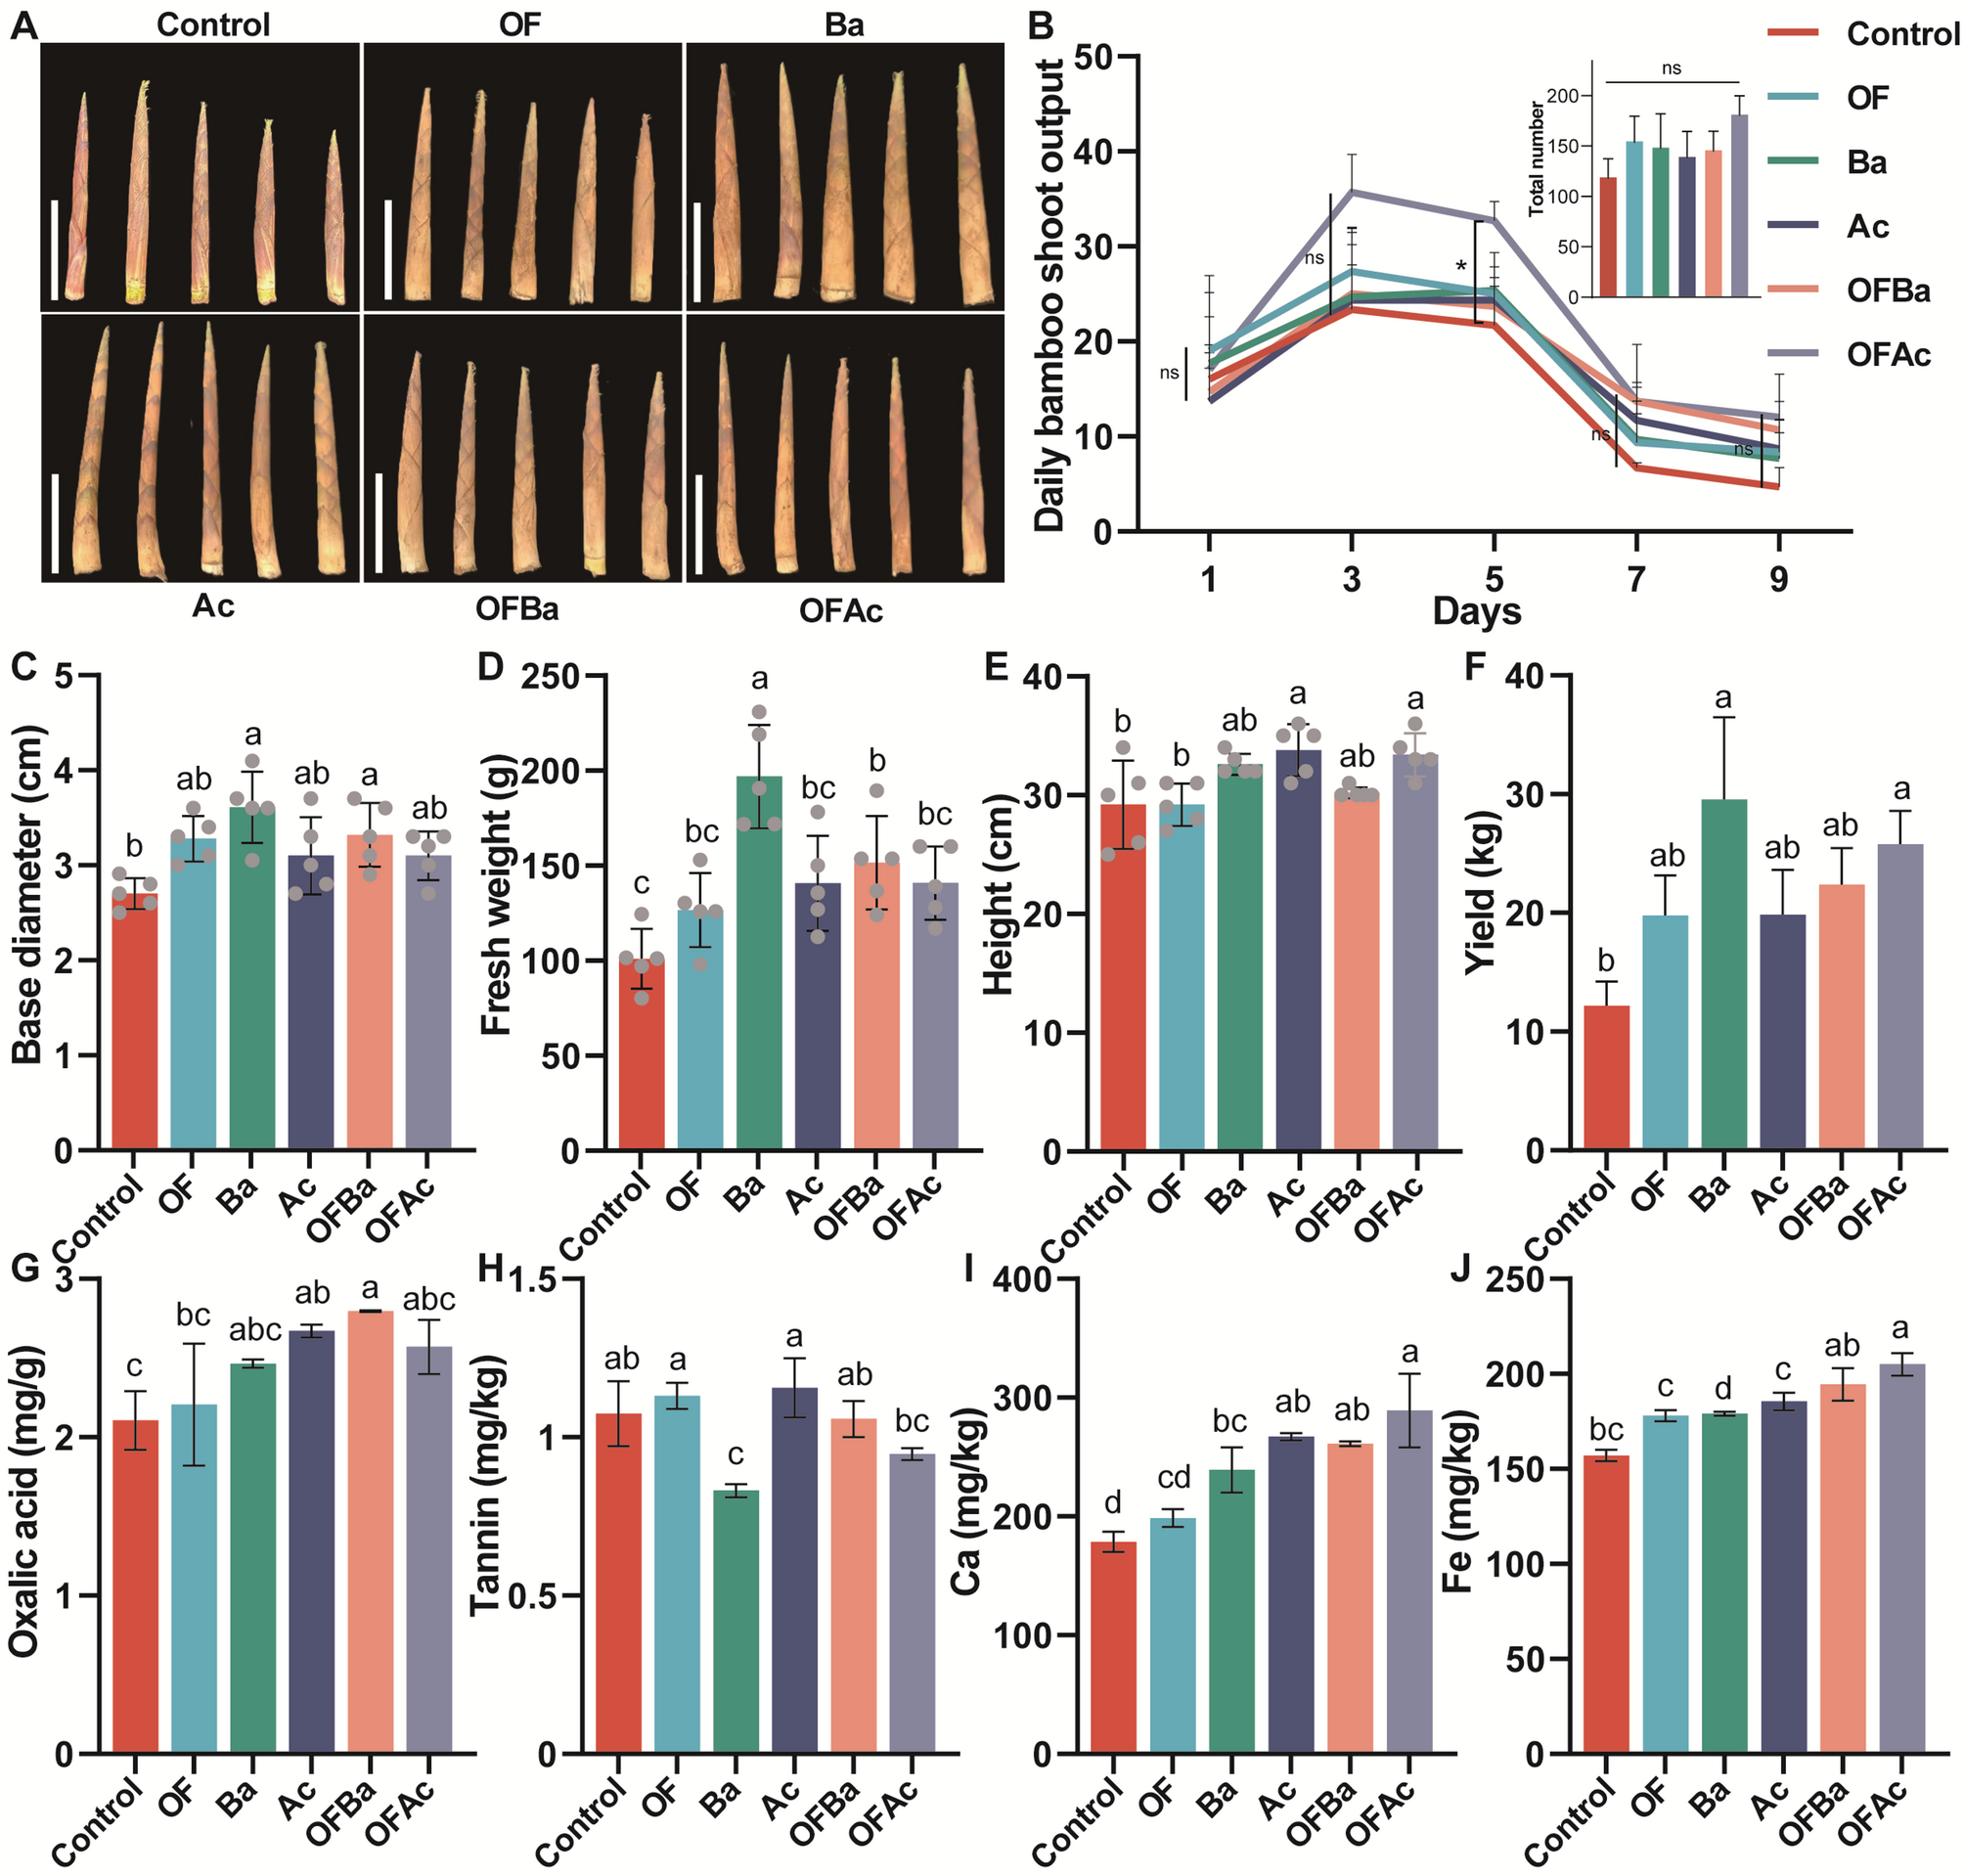
In the first year, C. opienensis bamboo shoot phenotype and daily bamboo shoot volume varied significantly across treatments. OFAc showed significantly higher bamboo shoot volume than the Control on day 5 (P < 0.05, ANOVA, Tukey HSD). However, total bamboo shoot volume did not differ significantly among treatments (Fig. 1A, B). Basal diameter differed significantly among treatments (P < 0.01, Tukey HSD, Fig. 1C), with the largest observed in Ba (3.61 ± 0.37 cm) and the smallest in Control (2.70 ± 0.16 cm). Fresh weight also varied significantly (P < 0.0001, Tukey HSD, Fig. 1D), with Ba producing the heaviest bamboo shoots (196.90 ± 27.13 g), a 95.03% increase over the Control (100.96 ± 15.74 g). Bamboo shoot height differed significantly (P < 0.01, Tukey HSD, Fig. 1E), with Ac producing the tallest shoots (33.80 ± 2.17 cm) and Control the shortest (29.20 ± 3.70 cm). Bamboo shoot yield was significantly higher in Ba (29.54 ± 6.96 kg) and OFAc (25.78 ± 2.81 kg) groups than in the Control group (P = 0.0035, Tukey HSD, Fig. 1F). To evaluate bamboo shoot quality, 38 key traits were analyzed (Fig. 1G–J, Table S3, Analysis of bamboo shoot quality after different fertilization treatments). Oxalic acid and tannin levels, which affect palatability, differed significantly among treatments (P = 0.0051 and P = 0.0004, respectively; Tukey HSD, Fig. 1G, H). Ba had the highest oxalic acid (2.47 ± 0.03 mg/g) and Control the lowest (2.11 ± 0.19 mg/g). Tannin content was highest in Ac (1.16 ± 0.09 mg/kg) and lowest in Ba (0.83 ± 0.02 mg/kg).
Fig. 1
Effects of fertilization treatments on the growth, development, and quality traits of C. opienensis bamboo shoots in the field. A Representative bamboo shoot phenotypes; B line graph of daily bamboo shoot production; histograms showing (C) basal diameter, D fresh weight, E bamboo shoot height, and (F) yield. Histograms of (G) oxalic acid, H tannin, I calcium (Ca), and (J) iron (Fe) contents at peak bamboo shoot emergence. C (Control, no fertilizer), OF (organic fertilizer), Ba (Bacillus amyloliquefaciens), Ac (Azotobacter chroococcum), OFBa (organic fertilizer + B. amyloliquefaciens), and OFAc (organic fertilizer + A. chroococcum). One-way ANOVA was used for statistical analysis. Different letters (P < 0.05) and asterisks (*P < 0.05) indicate significance level with Tukey HSD. C–E, number of replicates per treatment for each measurement (n) = 5; B, F–J n = 3
Calcium and iron contents also varied significantly among treatments (P < 0.0001 for both, Tukey HSD, Fig. 1I, J). OFAc showed the highest Ca (289.00 ± 31.00 mg/g) and Fe (6.61 ± 0.44 mg/g) contents, whereas Control had the lowest (Ca: 178.50 ± 8.50 mg/g; Fe: 1.83 ± 0.02 mg/g). OF showed no significant difference from Control in 37 of 38 traits (Fig. 1G–J, Table S3). In Ba, Asp, Thr, Ser, and lignin levels decreased significantly, whereas Mg and Zn levels increased (29/38 traits unchanged). Ac showed significant reductions in multiple amino acids (Asp, Gly, Ala, Val, Ile, Leu, Tyr, Lys, His, Arg, and Pro), Cu, and fiber, whereas Mg and Na increased (19/38 traits unchanged). In OFBa, fiber and five amino acids (Asp, Ala, Lys, Arg, and Pro) decreased significantly, whereas K, Mg, and Zn increased (27/38 traits unchanged). OFAc showed reductions in fiber, Mg, and Cu, with no significant changes in 33 of 38 traits (Fig. 1G–J, Table S3).
In the second year, basal diameter (P < 0.0001, Tukey HSD, Fig. S1A), fresh weight (P < 0.0001, Tukey HSD, Fig. S1B), and bamboo shoot length (P < 0.0001, Tukey HSD, Fig. S1C) again differed significantly among treatments. All fertilization treatments resulted in significantly higher values than Control. On day 5, OFAc and OFBa yielded significantly more than Control (P < 0.01, Tukey HSD, Fig. S1D). The yield trend mirrored that of the first year, with significantly higher bamboo shoot yields in Ba (15.99 ± 4.16 kg) and OFAc (13.05 ± 1.07 kg) than that in Control (P = 0.012, Student’s t test, Fig. S1E). In summary, Ba significantly increased bamboo shoot yield while also raising oxalic acid levels and significantly reduced some quality traits. In contrast, OFAc enhanced yield without compromising palatability and largely preserved nutritional value, providing empirical evidence for further exploration of the “fertilizer type–nutritional traits–yield” mechanism.
Ac and Ba had the strongest impact on soil nutrients, followed by OFAc and OFBa
Soil physicochemical properties varied significantly among fertilization treatments (P < 0.05, Tukey HSD, Table 1). Ac and Ba exhibited the lowest soil pH values, whereas OFBa and OFAc showed intermediate values, and OF and CK displayed the highest pH levels. Total nitrogen (TN) levels were highest in Ac and Ba, whereas OFAc and OFBa showed intermediate values. OFAc had the highest total phosphorus (TP), exceeding Control, OF, and Ac. Control and OF exhibited significantly higher total potassium (TK) than other treatments. Total organic carbon (TOC) and total organic matter (TOM) peaked in Ba-treated soils, followed by Ac and OFAc. Ammonium nitrogen (AN) did not differ significantly, except for elevated levels in Ac. Available phosphorus (AP) was highest in OFAc, and available potassium (AK) peaked in Ba and OFAc. Total carbon (TC) followed the gradient: Ba > Ac > OFAc > OFBa > Control > OF. These results indicate that single applications of Ac or Ba significantly improved several soil properties (TN, TP, TOC, TOM), while combined treatments (OFAc, OFBa) produced intermediate effects between single amendments and the Control, providing a basis for subsequent analysis of nutrient regulation pathways.
Table 1 Soil chemical properties of different fertilization treatments
Soil chemistry as a key factor in shaping the soil microbiota of C. opienensis under control and fertilization treatments
To assess the impact of fertilization on microbial diversity, we analyzed 41,046 bacterial and 8,242 fungal ASVs in C. opienensis soils. Rarefaction curves based on observed ASVs approached saturation, indicating sufficient sequencing depth (Fig. S2A, B). Bacterial and fungal α-diversity differed significantly among treatments based on multiple metrics, including the Chao1 index (P < 0.05, Tukey HSD, Fig. 2A, B). Phylogenetic diversity also varied significantly (P < 0.05, Tukey HSD). OFBa showed significantly higher bacterial and fungal α-diversity than Control, whereas OF, Ac, Ba, and OFAc showed no significant differences (Fig. S2C–H). At the phylum level, bacterial communities were dominated by Proteobacteria (31.35 ± 5.02%) and Acidobacteriota (27.90 ± 6.39%), whereas fungal communities were dominated by Ascomycota (40.13 ± 5.51%) and Basidiomycota (26.72 ± 5.14%) (Dataset S1, Mean relative abundance of soil ASVs by phylum across all samples, n = 30). Only Actinobacteriota and Chloroflexi averaged more than 9% abundance among other bacterial phyla, whereas Mortierellomycota and Rozellomycota were the only other fungal phyla exceeding 12% (Fig. S2I, J). PCoA revealed distinct clustering of bacterial (R = 0.7889) and fungal (R = 0.8802) communities by fertilization treatment (P = 0.001 for both; ANOSIM, Fig. 2C, D), indicating significant compositional shifts.
Fig. 2
Effects of fertilization and Control treatments on soil microbial diversity and community composition in the rhizosphere of C. opienensis. Fused violin-box plots showing Chao1 indices of rhizosphere bacterial (A) and fungal (B) communities (P < 0.05, one-way ANOVA with Tukey’s test). Principal coordinates analysis (PCoA) of bacterial (C) and fungal (D) communities using the ANOSIM test. Different letters indicate significant differences at P < 0.05. ASV identification based on Bray–Curtis dissimilarity revealed clear clustering by treatment, and significance was evaluated using anosim in R. Effects of soil physicochemical properties on bacterial (E) and fungal (F) community variation were assessed using PERMANOVA with 999 Monte Carlo permutation test
Redundancy analysis (RDA) and PERMANOVA revealed soil chemical properties as key factors shaping bacterial and fungal communities. For bacteria, the following significantly influenced community composition: pH (variance explained [VE] = 7.96%, P = 0.001, Monte Carlo permutation test), TC (9.20%), TN (9.06%), TP (7.71%), TK (9.66%), TOC and TOM (both 8.36%), AN (8.33%), AP (7.64%), and AK (5.62%, P = 0.003) (Fig. 2E; Dataset S2, Results of the PERMANOVA for exploring the variance in the bacterial and fungal communities explained by the soil properties). For fungi, pH (9.60%, P = 0.001, Monte Carlo permutation test), TC (12.35%), TN (11.93%), TP (13.60%), TK (13.32%), TOC and TOM (12.01%), AN (11.96%), AP (11.64%), and AK (8.88%) were significant drivers (Fig. 2F; Dataset S2). Soil properties explained 32.44% of bacterial and 50.40% of fungal community variance (Dataset S2). These findings indicate that soil chemical characteristics play a major role in shaping the rhizosphere microbiota of C. opienensis under different fertilizations, laying a foundation for elucidating how fertilization influences microbial community structure.
Co-occurrence network of Ba was denser, whereas that of OFAc was sparser
Besides differences in microbial diversity and community composition, the co-occurrence networks of the Ba and OFAc microbiomes differed significantly from the Control (Fig. 3A–D; Fig. S3C–D). Other treatments showed no significant differences (Fig. S3A, B, D–F, H). In Ba-treated samples, bacterial network degree (P < 0.05, Mann–Whitney U test, Fig. 3I) and closeness centrality (P < 0.01, Mann–Whitney U test, Fig. 3J) were significantly higher than in Control. Fungal network degree showed no significant change (Fig. 3K), but closeness centrality was significantly lower (P < 0.001, Mann–Whitney U test, Fig. 3L) than that in Control. Similarly, in OFAc-treated soils, bacterial network degree (P < 0.05, Mann–Whitney U test) and closeness centrality (P < 0.01, Mann–Whitney U test) were also significantly higher than Control (Fig. 3I, J), whereas fungal degree remained unchanged and closeness centrality decreased significantly (P < 0.001, Mann–Whitney U test, Fig. 3L). Separate analysis of bacterial and fungal co-occurrence networks in Ba and OFAc communities showed that the bacterial network in Ba was more aggregated and denser than in Control (Fig. S3K), whereas its fungal network was more isolated and sparser (Fig. 3O). In contrast, both bacterial and fungal networks in OFAc were more isolated and less dense than those in Control (Fig. 3E–H). Both Ba and OFAc significantly increased C. opienensis bamboo shoot yield. However, the contrasting network structures and topological features of OFAc compared to Ba and Control warranted further investigation, providing key insights for further exploring how different fertilizer combinations influence microbial interaction patterns and their effects on yield.
Fig. 3
Bacterial and fungal co-occurrence networks in C. opienensis soil under control and fertilization treatments. Bacterial co-occurrence networks are shown for Control (A, E) and OFAc (B, F), and fungal networks for Control (C, G) and OFAc (D, H). Nodes in panels A–D are colored by microbial modules, whereas nodes in panels E–H are colored by microbial taxonomy at the phylum level. Correlations were inferred from ASV abundance matrices using Spearman’s method. Only robust and significant correlations (correlation coefficient < − 0.7 or > 0.7, P < 0.05) were retained to construct the co-occurrence networks. Each node represents an ASV of bacteria or fungi, and edges indicate positive correlations (red lines) or negative correlations (blue lines). Degree (I) and closeness centrality (J) of bacterial networks, and degree (K) and closeness centrality (L) of fungal networks in Control and OFAc soils were compared (Mann–Whitney U test). Asterisks denote significance levels (*P < 0.05, **P < 0.01, ns no significance)
A. chroococcum addition (Ac and OFAc treatments) caused the most significant shifts in community composition
To evaluate the effect of A. chroococcum addition on specific ASVs and identify those driving treatment-level differences, we used DESeq2 to compare microbial communities across treatments. Differentially enriched ASVs were identified in OF, Ac, Ba, OFAc, and OFBa treatments relative to Control (Fig. 4A, B). The addition of A. chroococcum (in Ac and OFAc) caused the most significant shifts in community composition, influencing 44 and 66 bacterial ASVs (Fig. 4E and F), and 75 and 156 fungal ASVs, respectively (Fig. 4E and F). Additionally, Ba notably altered the fungal community, affecting 126 ASVs (Fig. 4F), whereas OF and OFBa had minimal effects. Although some ASVs were commonly affected across treatments (Fig. 4E and F), many were uniquely influenced by Ac, OFAc, or Ba. Specifically, 22 bacterial and 40 fungal ASVs were uniquely affected by both Ac and OFAc, highlighting the strong influence of A. chroococcum. Meanwhile, 64 fungal ASVs were uniquely affected by Ba treatment (Fig. 4F). In contrast, OF and OFBa treatments affected relatively few ASVs—2 and 4 bacterial ASVs and 35 and 13 fungal ASVs, respectively (Fig. 4E, F; Dataset S3, DESeq2 results for responsive ASVs, their taxonomy, and the treatments they responded to). Bacterial ASVs that increased in abundance after A. chroococcum addition (Ac and OFAc) were primarily from the Acidobacteria, including Acidobacteriales, Vicinamibacterales, and Solibacteraceae (Fig. 4C). Fungal ASVs that increased were mainly from Ascomycota and Basidiomycota, such as Sordariomycetes and Auricularia (Fig. 4C). In contrast, ASVs that decreased after A. chroococcum addition were taxonomically diverse, spanning over 21 bacterial and fungal phyla, primarily Ascomycota, Rozellomycota, Basidiomycota, Acidobacteriota, Proteobacteria, Chloroflexi, and Actinobacteriota (Fig. 4C, D; Dataset S3). Ba uniquely influenced fungal ASVs, mainly increasing members of Ascomycota, including Sordariomycetes, Helotiales, Sordariales, and Talaromyces (Fig. S3B). In OF, only 10 bacterial ASVs responded, with 4 increasing—three of which were Actinomycetes—and 6 decreasing, spanning five phyla. Among 38 fungal ASVs that increased, most belonged to Ascomycota (Fig. S3C, D). In OFBa, 10 bacterial ASVs responded positively compared to those in Control, including Subgroup_2 (log₂ fold change = 22.65). Most ASVs that decreased in abundance belonged to Acidobacteria (Fig. S3E). The addition of A. chroococcum (Ac and OFAc) significantly reshapes bacterial and fungal community composition, highlighting the pivotal role of specific functional microbes in fertilizer-driven community shifts and laying a foundation for subsequent metabolite–microbe interaction analyses.
Fig. 4
Differential effects of fertilization treatments on the microbial community structure in C. opienensis soil were assessed relative to the Control using DESeq2 (Adjust P < 0.01). A Number of upregulated (Up) and downregulated (Down) bacterial ASVs during microbial and/or organic fertilizer treatments (Ac, Ba, OF, OFAc, and OFBa) compared to those in Control, grouped by phylum. Bubble size indicates the number of responsive ASVs. B Top 50 bacterial ASVs showing increased (log2 fold change > 0) or decreased (log2 fold change < 0) abundance in response to treatments containing A. chroococcum (Ac and OFAc). ASVs are presented at the highest available taxonomic resolution and colored by class within each phylum. C Numbers of unique and shared ASVs identified during each treatment compared to those in the Control group
A. chroococcum addition (Ac and OFAc) significantly increased the richness of soil metabolites in C. opienensis
To investigate how A. chroococcum application alters the soil microbial community, liquid chromatography–mass spectrometry (LC-MS)-based metabolomics was used to profile metabolites in the root soil of C. opienensis under five fertilization treatments and Control. Differential metabolites were identified based on VIP scores from OPLS-DA, fold change, and P-values from univariate analysis. A total of 133 metabolites were detected (Dataset S4). Root soil metabolite composition varied across treatments, with Ac, OFAc, and OFBa showing the most pronounced differences compared to Control (Fig. S5A, B). Twenty-eight metabolites were significantly more abundant in Control than in all fertilization treatments (P < 0.05; Fig. 5A–D, Fig. S5C). Most were fatty acyls (n = 15), including fatty acids and conjugates (n = 11). The rest included organooxygen compounds (n = 7), lactones (n = 3), pteridines and derivatives (n = 2), and prenol lipids (n = 2), and others (Fig. 5A-D, Fig. S5C).
Fig. 5
Differential metabolite profiles of C. opienensis soil under five fertilization treatments compared to those under Control. Significantly enriched metabolites in Ac (A), OFAc (B), Ba (C), and OFBa (D) treatments compared to that in the Control group. Red circles represent metabolites significantly upregulated, whereas blue circles indicate downregulated metabolites. Scatter plots display the abundance of representative enriched metabolites in each treatment; horizontal lines indicate the mean, and dots represent individual samples. VIP, variable importance; OPLS-DA, orthogonal partial least squares-discriminant analysis. n = 5, evaluated using OPLS-DA (VIP > 1.5, P < 0.05; see Dataset S4)
In contrast, A. chroococcum addition (Ac and OFAc) significantly increased the abundance of 70 soil metabolites, including 28 carboxylic acids and derivatives, notably amino acids, peptides, and analogues such as Gamma-Glu-Leu (Fig. 5A, B). Six organoheterocyclic compounds also increased, including benzopyrans, triazines, and imidazopyrimidines like N6-(Delta2-Isopentenyl)-adenine. A total of 31 and 5 metabolites were significantly increased and decreased in Ba treatment, respectively, compared to Control (Fig. 5C; Dataset S4). OFBa significantly increased 33 metabolites, including organic acids and derivatives (n = 7), lipids and lipid-like molecules (n = 7), organoheterocyclic compounds (n = 6), and others such as D-glucosaminide (Fig. 5C, D; Dataset S4). Changes in metabolite abundance show that Ac and OFAc treatments markedly enrich the rhizosphere metabolite pool, especially amino acids and organic acids, suggesting that metabolite enrichment may be an important mediator of microbially driven yield improvement.
Relationship of metabolites and microbial ASV with ac and OFAc
To assess metabolite–microbe interactions under A. chroococcum addition, Spearman rank correlation and hierarchical clustering were used to associate differentially abundant ASVs (identified by DESeq2) with metabolites from OPLS-DA. Clustering revealed two major groups. Cluster 1 comprised 45 microbial ASVs and 10 metabolites enriched in Control soils. ASVs mainly belonged to Proteobacteria, Chloroflexi, Rozellomycota, and Mortierellomycota, whereas metabolites included hydroxy acids and derivatives, fatty acyls, organooxygen compounds, and organonitrogen compounds such as 12-hydroxydodecanoic acid, 22-hydroxydocosanoic acid, 4-O-methylgalactinol, and arachidoyl ethanolamide (Fig. 6). Cluster 2 included 30 microbial ASVs and 65 root soil metabolites enriched in Ac and OFAc soils. Unlike Cluster 1, ASVs primarily belong to Acidobacteriota, Proteobacteria, Gemmatimonadota, Ascomycota, and Rozellomycota. The metabolites predominantly consisted of carboxylic acids and derivatives (17/65), organooxygen compounds (7/65), fatty acyls (5/65), and amino acids, peptides and analogues, carbohydrates, and carbohydrate conjugates (Fig. 6). Metabolite–microbe clustering analysis reveals that Ac and OFAc treatments induce the co-enrichment of specific metabolites and microbial taxa, providing empirical evidence for understanding fertilizer-regulated microbe–metabolite cooperation in the rhizosphere.
Fig. 6
Heatmap of co-varying microbial taxa and metabolites in C. opienensis soil under five fertilization treatments and Control conditions. Differentially abundant ASVs (identified using DESeq2; (n = 75)), showing more than three significant positive or negative correlations with metabolites (Spearman rank correlation, r > 0.7, P < 0.05). A total of 75 metabolites were identified as key associations between metabolites and ASVs. These metabolites had more than two significant positive or negative correlations with ASVs (Spearman rank correlation, |ρ| >0.7, P < 0.05). Hierarchical clustering revealed two metabolites–ASV correlation clusters. Cluster #1 (red line) represents metabolites and ASVs more abundant in Control rhizosphere soil, whereas Cluster #2 (brown line) includes metabolites and ASVs enriched in soils amended with Azotobacter chroococcum (Ac and OFAc treatments). Red indicates positive correlations, white indicates no correlation, and blue indicates negative correlations between metabolites and ASVs
Metabolite–microbe networks in C. opienensis soil communities
To identify co-occurring changes between metabolites and microbial ASVs, we constructed a correlation network using their relative abundances across all treatments. The root soil network (Fig. 7A) included 148 ASVs and 91 metabolites connected via 692 links—352 positive and 340 negative—with an average of six connections per node (Dataset S5, List of network connectors, module and network hubs, network topological features, and correlation strength between network nodes). We identified 11 connectivity hubs, 5 modular centers, and 1 central network cluster as potential keystone metabolites or microbes (Fig. 7B; Dataset S5). One fungal hub, Rozellomycota (ASV369), was predominantly negatively correlated with metabolites in Modules 3 and 4, showing negative links with 34 of 36 metabolites, but positive correlations with 4-O-methylgalactinol and Dibenzo-18-Crown-6. Module 2, the largest, was dominated by positive correlations between Rozellomycota ASVs and four key metabolites: 4-deoxyphysalolactone, Fa(18:3 + 1O), 3-hydroxybutyric acid, and diethylene glycol diacetate (27 of 52 links). Negative associations primarily involved bacterial and fungal ASVs from diverse phyla. Module 1 featured negative correlations between the module center Mortierellomycota (ASV151) and 19 metabolites, alongside positive correlations with 18 metabolites linked to ASVs from Proteobacteria, Acidobacteriota, Ascomycota, and Rozellomycota (99 of 118 links). Module 5 lacked a central hub and was dominated by metabolite nodes, including 1-methoxyindole-3-carbaldehyde and fungal ASVs from various phyla. The 11 network connectors included 7 metabolites and 4 microbial ASVs (Fig. 7C). These ASVs were linked to 41 metabolites via 45 positive and 16 negative associations. Bradyrhizobium (ASV2748) and Galerina (ASV1232) were positively correlated with 36 metabolites, primarily amino acids, peptides, and analogues. These connected with the three module centers and seven connectors in Module 2. In contrast, 14 of 16 negative links were formed by fungi (ASV385) and Rozellomycota (ASV234) with 13 metabolites. Approximately half (69 of 143) of ASVs in the network were identified as DESeq2-responsive; of these, 54 responded to Ac or OFAc, and 38 to Ba or OFBa (Dataset S3).
Metabolite–microbe network analysis reveals complex positive and negative correlation modules and key nodes, providing a systematic perspective for elucidating the mechanisms of microbe–metabolite interactions under fertilization.
Fig. 7
Co-occurrence networks depicting the relation between soil metabolites and microbial ASVs in C. opienensis soil under five fertilization treatments and Control. A A total of 1,048 bacterial and fungal ASVs and 130 rhizosphere soil metabolites were first analyzed using Spearman coefficients. Network showing associations among 148 bacterial and fungal ASVs and 91 rhizosphere soil metabolites (|ρ| >0.70, P < 0.05). Circles indicate bacterial ASVs, triangles fungal ASVs, and squares metabolites. Edges represent Spearman correlations of relative abundances, with red for positive and blue for negative correlations. The network is organized into five major modules. Hub nodes within the network and modules display dense connections, while eleven central nodes serve as connectors linking different modules. B Subnetworks of module hubs formed by metabolites or ASVs and their adjacent nodes. C Subnetworks of connector metabolites or microbes and their adjacent nodes. Microbial ASVs are colored by phylum
Soil nutrient changes induced by Ac and OFAc treatments drive increased C. opienensis shoot yields
To evaluate the cascading effects of A. chroococcum addition on soil chemistry, microbial community structure, root metabolites, and bamboo shoot yield, a PLS-PM was constructed (Fig. 8). The model posits that fertilization directly alters soil chemical properties (e.g., pH, organic matter, AN), which subsequently influence microbial community structure and diversity. These microbial changes promote the enrichment of key taxa and modulate metabolite abundance, ultimately enhancing C. opienensis bamboo shoot yield. The final model demonstrated good overall fit (GoF = 0.77) and convergent validity (AVE > 0.50 for all latent variables) (Fig. 8; Dataset S6, List of parameters for the PLS-PM). A. chroococcum addition was identified as the strongest driver of soil nutrient changes (path coefficient = 0.9916, P < 0.001), and soil nutrients emerged as the primary drivers of yield (path coefficient = 0.8430, P < 0.001). Soil nutrients also positively influenced microbial community structure (0.6668, P < 0.001), indirectly contributing to yield improvement through effects on key microbial taxa and metabolite profiles. Overall, the model suggests that A. chroococcum addition enhances soil nutrient status, which in turn reshapes microbial community composition, regulates functional microbes and metabolite abundance, and ultimately promotes C. opienensis bamboo shoot yield, thereby laying the foundation for proposing a “soil nutrients–microbes–metabolites–yield” regulatory model.
Fig. 8
Partial least squares-path model depicting causal relationships among fertilization, soil properties, microbial community structure, keystone taxa, key metabolites, and yield. Solid and dashed arrows represent significant (P < 0.05) and non-significant (P > 0.05) effects, respectively. Blue arrows indicate positive influences, while red arrows indicate negative ones. Standardized path coefficients and their corresponding p-values are shown alongside the arrows; non-significant paths are not displayed. The values of R² denote the proportion of variance explained for each dependent variable
Bärnighausen T, Røttingen JA, Rockers P, Shemilt I, Tugwell P. Quasi-experimental study designs series—paper 1: introduction: two historical lineages. J Clin Epidemiol. 2017;89:4–11.
PubMed
Google Scholar
Ogilvie D, Adams J, Bauman A, et al. Using natural experimental studies to guide public health action: turning the evidence-based medicine paradigm on its head. J Epidemiol Community Health. 2019. https://doi.org/10.1136/jech-2019-213085.
Article
PubMed
Google Scholar
Reeves BC, Wells GA, Waddington H. Quasi-experimental study designs series—paper 5: a checklist for classifying studies evaluating the effects on health interventions—a taxonomy without labels. J Clin Epidemiol. 2017;89:30–42.
PubMed
PubMed Central
Google Scholar
Glanville J, Eyers J, Jones AM, et al. Quasi-experimental study designs series—paper 8: identifying quasi-experimental studies to inform systematic reviews. J Clin Epidemiol. 2017;89:67–76.
PubMed
Google Scholar
Basu S, Meghani A, Siddiqi A. Evaluating the health impact of large-scale public policy changes: classical and novel approaches. Annu Rev Public Health. 2017;38:351–70.
PubMed
PubMed Central
Google Scholar
Abreu D, Pinto F, Matias-Dias C, Sousa P. Trends of case-fatality rate by acute coronary syndrome in Portugal: impact of a fast track to the coronary unit. JRSM Cardiovasc Dis. 2019;8:204800401985195.
Google Scholar
Kislaya I, Rodrigues AP, Sousa-Uva M, et al. Indirect effect of 7-valent and 13-valent Pneumococcal conjugated vaccines on Pneumococcal pneumonia hospitalizations in elderly. PLoS ONE. 2019;14(1):65–74.
Google Scholar
Torres AR, Rodrigues AP, Sousa-Uva M, et al. Impact of stringent non-pharmaceutical interventions applied during the second and third COVID-19 epidemic waves in Portugal, 9 November 2020 to 10 February 2021: an ecological study. Eurosurveillance. 2022;27(3):1–12.
Google Scholar
Tricco AC, Lillie E, Zarin W, et al. Preferred reporting items for systematic reviews and Meta-Analyses extension for scoping reviews (PRISMA-ScR) checklist SECTION. Ann Intern Med. 2018;169(7):11–2.
Google Scholar
Leite A, Kislaya I, Machado A, Aguiar P, Nunes B, Matias Dias C. Use of quasi-experimental studies to evaluate causal effects of public health interventions in portugal: a scoping review protocol. 2022. Available from: osf.io/zex3v. Cited 2022 Sep 26.
Open Science Framework (OSF). Available from: https://doi.org/10.17605/OSF.IO/G9KVE. cited 2022 Sep 26.
Instituto Nacional de Saúde Doutor Ricardo Jorge. Boletim Epidemiológico Observações [Internet]. [cited 2022 Sep 26]. Available from: https://www.insa.min-saude.pt/category/informacao-e-cultura-cientifica/publicacoes/boletim-epidemiologico-observacoes/
Bond, University. Institute for evidence-based healthcare. SR-Accelerator. Available from: https://sr-accelerator.com/#/. Cited 2024 Mar 21.
Waddington H, Aloe AM, Becker BJ, et al. Quasi-experimental study designs series—paper 6: risk of bias assessment. J Clin Epidemiol. 2017;89:43–52.
PubMed
Google Scholar
de Vocht F, Katikireddi SV, McQuire C, Tilling K, Hickman M, Craig P. Conceptualising natural and quasi experiments in public health. BMC Med Res Methodol. 2021;21(1):1–8.
Google Scholar
Haddaway NR, Page MJ, Pritchard CC, McGuinness LA. PRISMA2020: an R package and Shiny app for producing PRISMA 2020-compliant flow diagrams, with interactivity for optimised digital transparency and open synthesis. Campbell Syst Rev. 2022;18(2):1–12.
Google Scholar
Abreu D, Sousa P, Matias-Dias C, Pinto FJ. Longitudinal impact of the smoking ban legislation in acute coronary syndrome admissions. BioMed Res Int. 2017. https://doi.org/10.1155/2017/6956941.
Article
PubMed
PubMed Central
Google Scholar
Abreu D, Sousa P, Matias-Dias C, Pinto FJ. Cardiovascular disease and high blood pressure trend analyses from 2002 to 2016: after the implementation of a salt reduction strategy. BMC Public Health. 2018;18(1):722.
PubMed
PubMed Central
Google Scholar
Abreu D, Sousa P, Matias-Dias C, Pinto F. Impact of public health initiatives on acute coronary syndrome fatality rates in Portugal. Rev Port Cardiol. 2020;39(1):27–34.
PubMed
Google Scholar
Adam C, Raschzok A. Cannabis policy and the uptake of treatment for cannabis-related problems. Drug Alcohol Rev. 2017;36(2):171–7.
PubMed
Google Scholar
Aiken ARA, Starling JE, Gomperts R, Scott JG, Aiken CE. Demand for self-managed online telemedicine abortion in eight European countries during the COVID-19 pandemic: a regression discontinuity analysis. BMJ Sex Reprod Health. 2021;47(4):238–45.
PubMed
Google Scholar
Bellerba F, Bardeck N, Boehm M, et al. SARS-CoV-2 trends in Italy, Germany and Portugal and school opening during the period of Omicron variant dominance: a quasi experimental study in the EuCARE project. Int J Infect Dis. 2024. https://doi.org/10.1016/j.ijid.2023.11.002.
Article
PubMed
Google Scholar
Benedetti E, Resce G, Brunori P, Molinaro S. Cannabis policy changes and adolescent cannabis use: evidence from Europe. Int J Environ Res Public Health. 2021. https://doi.org/10.3390/ijerph18105174.
Article
PubMed
PubMed Central
Google Scholar
Dimitrovová K, Perelman J, Serrano-Alarcón M. Effect of a national primary care reform on avoidable hospital admissions (2000–2015): a difference-in-difference analysis. Soc Sci Med. 2020;252:112908.
PubMed
Google Scholar
Fernandes OB, Lopes S, Marques AP, Moita B, Sarmento J, Santana R. Local health units in Portugal: the influence of chronic conditions on inpatient readmissions. Port J Public Heal. 2020;37(2–3):91–9.
Google Scholar
Gonçalves J, Pereira Dos Santos J. Brown sugar, how come you taste so good? The impact of a soda tax on prices and consumption. Soc Sci Med. 2020;264:113332.
PubMed
Google Scholar
Hoffman SJ, Poirier MJP, Van Rogers S, Baral P, Sritharan L. Impact of the WHO framework convention on tobacco control on global cigarette consumption: Quasi-experimental evaluations using interrupted time series analysis and in-sample forecast event modelling. BMJ. 2019;365.
Leitão C, Silva S, Roquette R, Uva M, Baltazar N. Será Que Os Planos de contingência Para Ondas de Calor reduzem a Mortalidade associada Ao Calor ? Um Estudo Da diferença-das-diferenças Em Portugal (Do heat contingency plans reduce heat related deaths? A difference-in-difference study in Portugal). Obs Bol Epidemiológico – Inst Nac Saúde Dr Ricardo Jorge. 2020;26:4–8.
Google Scholar
Lopes S, Fernandes ÓB, Marques AP, Moita B, Sarmento J, Santana R. Can vertical integration reduce hospital readmissions? A difference-in-differences approach. Med Care. 2017;55(5):506–13.
PubMed
PubMed Central
Google Scholar
Pereira AM, Pereira RM, Dos Santos JP. For whom the bell tolls: road safety effects of tolls ouncongested SCUT highways in Portugal. J Infrastructure Policy Dev. 2020;4(2):287–305.
Google Scholar
Pinto D, Silva A, Heleno B, Rodrigues DS, Santos I, Caetano PA. Effect of European medicines agency’s regulatory measures on nimesulide utilization in Portugal. Pharmacoepidemiol Drug Saf. 2018;27(6):630–7.
PubMed
Google Scholar
Pinto D, Silva A, Heleno B, Rodrigues DS, Santos I, Caetano PA. Effect of European medicines agency’s restrictions on Trimetazidine utilization in Portugal. Pharmacoepidemiol Drug Saf. 2018;27(9):962–8.
PubMed
Google Scholar
Ramos P, Almeida A. The impact of an increase in user costs on the demand for emergency services: the case of Portuguese hospitals. Health Econ. 2016;25(11):1372–88.
PubMed
Google Scholar
Ricoca Peixoto V, Vieira A, Aguiar P, Carvalho C, Rhys Thomas D, Abrantes A. Initial assessment of the impact of the emergency state lockdown measures on the 1st wave of the COVID-19 epidemic in Portugal. Acta Med Port. 2020;33(11):733–41.
PubMed
Google Scholar
Sánchez R. Does a mandatory reduction of standard working hours improve employees’. health status? Ind Relat. 2017;56(1):3–39.
Google Scholar
Sassano M, Mariani M, Pastorino R, Ricciardi W, La Vecchia C, Boccia S. Association of national smoke-free policies with per-capita cigarette consumption and acute myocardial infarction mortality in Europe. J Epidemiol Community Health. 2024. https://doi.org/10.1136/jech-2023-220746.
Article
PubMed
Google Scholar
Torres AR, Rodrigues AP, Sousa-Uva M et al. Impact of stringent non-pharmaceutical interventions applied during the second and third COVID-19 epidemic waves in Portugal, 9 November 2020 to 10 February 2021: an ecological study. Euro Surveill. 2022;27(23).
Torres AR, Silva S, Kislaya I, et al. Impact of lifting mask mandates on COVID-19 incidence and mortality in portugal: an ecological study. Acta Med Port. 2023;36(10):661–9.
PubMed
Google Scholar
Vaz S, Ramos P. Where did civil servants go? The effect of an increase in public co-payments on double insured patients. Health Econ Rev. 2016;6(1):16.
PubMed
PubMed Central
Google Scholar
Matthay EC, Glymour MM. Causal inference challenges and new directions for epidemiologic research on the health effects of social policies. Curr Epidemiol Rep. 2022;9(1):22–37.
Google Scholar
Jandoc R, Burden AM, Mamdani M, Lévesque LE, Cadarette SM. Interrupted time series analysis in drug utilization research is increasing: systematic review and recommendations. J Clin Epidemiol. 2015;68(8):950–6.
PubMed
Google Scholar
Hilton Boon M, Craig P, Thomson H, Campbell M, Moore L. Regres Discontinuity Designs Health: Syst Rev Epidemiol. 2021;32(1):87–93.
Google Scholar
Kennedy-Shaffer L. Quasi-experimental methods for pharmacoepidemiology: difference-in-differences and synthetic control methods with case studies for vaccine evaluation. Am J Epidemiol. 2024;193(7):1050–8.
PubMed
PubMed Central
Google Scholar
Hategeka C, Ruton H, Karamouzian M, Lynd LD, Law MR. Use of interrupted time series methods in the evaluation of health system quality improvement interventions: A methodological systematic review. BMJ Glob Heal. 2020;5(10):1–13.
Google Scholar
Ewusie JE, Soobiah C, Blondal E, Beyene J, Thabane L, Hamid JS. Methods, applications and challenges in the analysis of interrupted time series data: A scoping review. J Multidiscip Healthc. 2020;13:411–23.
PubMed
PubMed Central
Google Scholar
Albers PN, Rinaldi C, Brown H, et al. Natural experiments for the evaluation of place-based public health interventions: a methodology scoping review. Front Public Health. 2023. https://doi.org/10.3389/fpubh.2023.1192055.
Article
PubMed
PubMed Central
Google Scholar
Akter S, Islam MR, Rahman MM, et al. Evaluation of population-level tobacco control interventions and health outcomes: a systematic review and meta-analysis. JAMA Netw Open. 2023;6(7):E2322341.
PubMed
PubMed Central
Google Scholar
Moscoe E, Bor J, Bärnighausen T. Regression discontinuity designs are underutilized in medicine, epidemiology, and public health: a review of current and best practice. J Clin Epidemiol. 2015;68(2):132–43.
Google Scholar
Wang G, Hamad R, White JS. Advances in difference-in-differences methods for policy evaluation research. Epidemiology. 2024;35(5):628–37.
PubMed
PubMed Central
Google Scholar
Bernal JL, Cummins S, Gasparrini A. Interrupted time series regression for the evaluation of public health interventions: a tutorial. Int J Epidemiol. 2017;46(1):348–55.
PubMed
Google Scholar
Rothbard S, Etheridge JC, Murray EJ. A tutorial on applying the difference-in-differences method to health data. Curr Epidemiol Rep. 2023;11(2):85–95.
Google Scholar
Turner SL, Karahalios A, Forbes AB, et al. Design characteristics and statistical methods used in interrupted time series studies evaluating public health interventions: a review. J Clin Epidemiol. 2020;122:1–11.
PubMed
Google Scholar
Korevaar E, Karahalios A, Turner SL, et al. Methodological systematic review recommends improvements to conduct and reporting when meta-analyzing interrupted time series studies. J Clin Epidemiol. 2022;145:55–69.
PubMed
Google Scholar
Hudson J, Fielding S, Ramsay CR. Methodology and reporting characteristics of studies using interrupted time series design in healthcare. BMC Med Res Methodol. 2019;19(1):1–7.
Google Scholar
Leonard SA, Panelli DM. Quasi-experimental study designs can inform pandemic effects on nutrition and weight gain in pregnancy. Am J Clin Nutr. 2023;117(2):216–7.
PubMed
Google Scholar
Lopes S, Soares P, Santos Sousa J, Rocha JV, Boto P, Santana R. Effect of the COVID-19 pandemic on the frequency of emergency department visits in Portugal: an interrupted time series analysis until July 2021. JACEP Open. 2023;4(1):e12864.
PubMed
PubMed Central
Google Scholar
Domingues M, Torre C, Guerreiro JP, et al. COVID-19 pandemic and the quality of antibiotic use in primary care: an interrupted time-series study. Int J Qual Health Care. 2023;35(2):mzad014.
PubMed
Google Scholar
Almeida D, Rodrigues AT, Guerreiro JP, et al. COVID-19 pandemic and the consumption of self-care products for pediculosis capitis in Portugal: an interrupted time-series analysis. Parasitol Res. 2024;123(6):235.
PubMed
PubMed Central
Google Scholar
Hanquet G, Valenciano M, Simondon F, Moren A. Vaccine effects and impact of vaccination programmes in post-licensure studies. Vaccine. 2013;31(48):5634–42.
PubMed
Google Scholar
Su SY. Nationwide mammographic screening and breast cancer mortality in Taiwan: an interrupted time-series analysis. Breast Cancer. 2022;29(2):336–42.
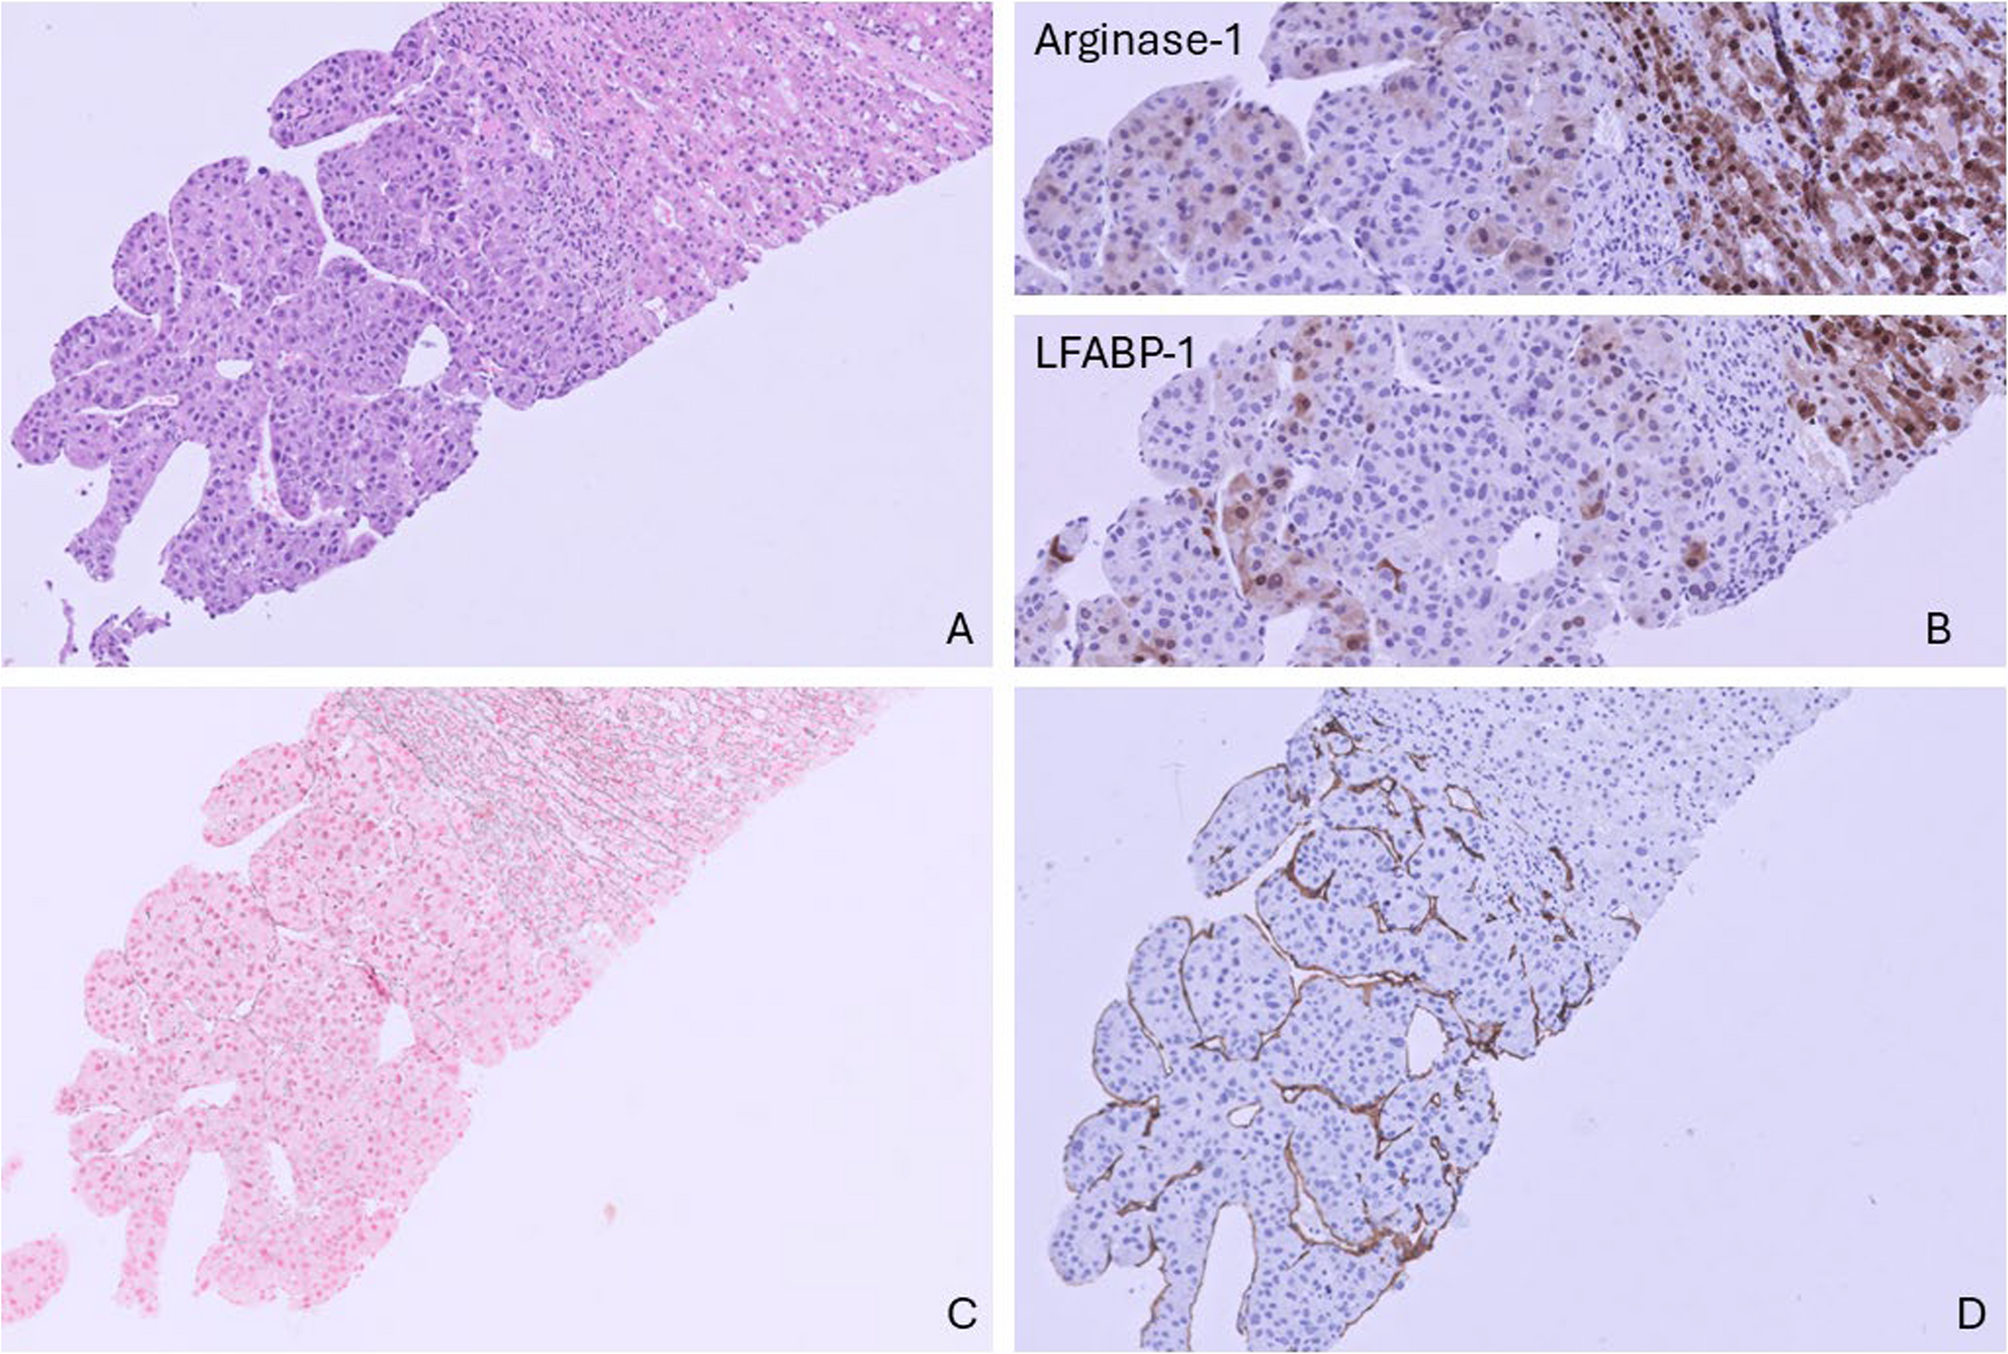
The first patient, an 82-year-old male, was referred to our hospital for the treatment of a solitary liver tumor. He was transferred from another hospital where he was analyzed for abdominal pain and weight loss. Ultrasound revealed a large tumor in the right lobe of the liver. The serum level of alpha-fetoprotein (AFP) was elevated; 59 µg/L. Magnetic resonance imaging (MRI) demonstrated a tumor of 10 cm in diameter in liver segments 5, 7 and 8. There was no history of excessive alcohol intake. Screening blood tests for causal factors of HCC, including hepatitis B and C, were negative. Because of inconclusive imaging results, a histologic biopsy was taken and demonstrated a moderately differentiated hepatocellular carcinoma in a noncirrhotic background (Fig. 1). The tumor had a trabecular growth pattern and comprised of cells with enlarged nuclei with multiple mitotic figures. Hepatocellular origin was further supported by variable cytoplasmic and nuclear expression of Arginase-1 and LFABP-1 (Fig. 1b). The tumor cells were Keratin 18 positive. A canalicular pattern was seen by poly CEA immunohistochemistry. BerEp-4, Keratin 7, 19 and 20 were all negative by additional examination (not shown). Gomori’s silver stain confirmed loss and fragmentation of reticuline fibers (Fig. 1c). The present capillarization of sinusoids was confirmed by CD34 (Fig. 1d).
Fig. 1
Liver biopsy showing a moderately differentiated hepatocellular carcinoma in a noncirrhotic background. Standard HE staining, 20X magnification (a). Variable cytoplasmic and nuclear positivity of Arginase-1 and LFABP-1 in the tumor cells (b). Gomori’s silver stain showing fragmentation and loss of the reticuline network (c). Diffuse capillarization of sinusoids confirmed by CD34 stain (d)
The patient refused extensive surgical resection and declined palliative systemic therapy for HCC. To reduce his abdominal complaints, he started using cannabis oil shortly after his diagnosis. The cannabis oil was obtained via an unknown online supplier and the product label stated the oil contained 10% delta-9-tetrahydrocannabinol (THC) and 5% cannabidiol (CBD). He did not experience any side effects using two droplets sublingually three times daily.
Although the patient was sent to the general practitioner for best supportive care after his diagnosis, he was readmitted for oncological follow-up. At this first follow-up after 6 months using the cannabis oil, his abdominal complaints had resolved, and AFP levels were normalized to 2 µg/L. MRI demonstrated regression of the tumor to a size of 5.1 cm. The patient continued the use of cannabis oil, and the tumor continued reducing in size. Approximately two years after the diagnosis, the tumor was undetectable on MRI (Fig. 2A-C). Until today, almost 8 years after diagnosis, the tumor has not been detected again on imaging studies and AFP levels have remained normal.
Fig. 2
Contrast-enhanced magnetic resonance (MR) images of an 82-year-old patient with advanced HCC (a) at diagnosis (b) at 6-month follow-up after using cannabis oil (c) at 6 years after diagnosis. Contrast-enhanced computed tomography (CT) images of a 77-year-old patient with advanced HCC (d) at diagnosis (e) at 6-month follow-up after using cannabis oil (f) at almost 4 years follow-up after using cannabis oil. N necrosis, t tumor
Patient B
The second patient, a 77-year-old male was referred to our hospital with undesired weight loss, a liver mass detected on ultrasound, and an AFP of 40,950 µg/L. He had a history of alcohol abuse. Screening blood tests for other causal factors of HCC, including hepatitis B and C, were negative. Computed tomography (CT) studies demonstrated a large tumor of 15.6 cm with central necrosis in liver segments 6, 7 and 8. A second lesion of 2.5 cm was located in segment 5. HCC was diagnosed based on typical imaging characteristics (arterial enhancement with wash-out in the late phase) combined with highly elevated levels of AFP and des-gamma carboxyprothrombin (22,142 AU/L) (Forner et al. 2018). Both tumors were deemed unresectable and the patient refused palliative treatment options for HCC, including selective internal radiotherapy (SIRT). In order to improve appetite and gain weight, he started to use cannabis oil upon diagnosis. The cannabis oil was obtained via an unknown online supplier and the product label stated the oil contained 15% THC and 2% CBD. He did not experience any side effects using 5 droplets sublingually two times daily.
After 3 months using cannabis oil, his clinical condition had improved, and he had gained weight. Upon imaging, the tumors had reduced in size from 15.6 to 9.2 cm in diameter and 2.5 to 1.9 cm, respectively. Afterwards, he continued to use cannabis oil and approximately 15 months after diagnosis the AFP had normalized to 2 µg/L. On CT, no vital tumor tissue was visible anymore, only rest necrosis (Fig. 2D-F). To this day, almost 5 years after diagnosis, imaging studies do not demonstrate any recurrent disease and AFP levels are normal.
In both patients, no significant dietary, lifestyle or other supportive interventions were initiated during the follow-up period aside from the reported use of cannabis oil. Neither patient had a history of recreational or medical cannabis use, nor of other cannabis-related substances, prior to their cancer diagnosis. Although both patients reported no adverse effects, systematic adverse event monitoring was not performed.
Ajayi AA, Sofowora GG, Ladipo GO. Explaining heart failure Hyper-mortality in sub saharan africa: global genomic and environmental contribution. J Natl Med Assoc. 2020;112(2):141–57.
PubMed
Google Scholar
Gillum RF. The burden of cardiovascular disease in sub-Saharan Africa and the black diaspora. J Racial Ethn Health Disparities. 2018;5(6):1155–8.
Article
PubMed
Google Scholar
Alcaide-Aldeano A, Garay A, Alcoberro L, Jiménez-Marrero S, Yun S, Tajes M, et al. Iron deficiency: impact on functional capacity and quality of life in heart failure with preserved ejection fraction. J Clin Med. 2020;9(4):1199.
Article
PubMed
PubMed Central
Google Scholar
Johansson I, Joseph P, Balasubramanian K, McMurray JJV, Lund LH, Ezekowitz JA, et al. Health-related quality of life and mortality in heart failure: the global congestive heart failure study of 23 000 patients from 40 countries. Circulation. 2021;143(22):2129–42.
Akintunde AA, Akinlade OM, Egbewale BE, Opadijo OG. Iron deficiency anaemia in Nigerians with heart failure (IDAN-HF): therapeutic efficacy of iron replacement: an interventional study. Niger J Clin Pract. 2021;24(1):21–7.
Article
PubMed
Google Scholar
Akintunde AA, Aworanti OW. Pattern of anaemia and its correlates in Nigerians with HF. Ann Ib Postgrad Med. 2020;18(1):51–9.
PubMed
PubMed Central
Google Scholar
Loncar G, Obradovic D, Thiele H, von Haehling S, Lainscak M. Iron deficiency in Heart Failure. ESC Heart Fail. 2021;8(4):2368–79.
Article
PubMed
PubMed Central
Google Scholar
Dutt S, Hamza I, Bartnikas TB. Molecular mechanisms of iron and heme metabolism. Annu Rev Nutr. 2022;42:311–35.
Article
PubMed
PubMed Central
Google Scholar
Paolillo S, Scardovi AB, Campodonico J. Role of comorbidities in heart failure prognosis part I: anaemia, iron deficiency, diabetes, atrial fibrillation. Eur J Prev Cardiol. 2020;27(2suppl):27–34.
Article
PubMed
PubMed Central
Google Scholar
Martens P, Nijst P, Verbrugge FH, Smeets K, Dupont M, Mullens W. Impact of iron deficiency on exercise capacity and outcome in heart failure with reduced, mid-range and preserved ejection fraction. Acta Cardiol. 2018;73(2):115–23.
Article
PubMed
Google Scholar
Chopra VK, Anker SD, Anaemia. Iron deficiency and heart failure in 2020: facts and numbers. ESC Heart Fail. 2020;7(5):2007–11.
Article
PubMed
PubMed Central
Google Scholar
Jacob C, Altevers J, Barck I, Hardt T, Braun S, Greiner W. Retrospective analysis into differences in heart failure patients with and without iron deficiency or anaemia. ESC Heart Fail. 2019;6(4):840–55.
Article
PubMed
PubMed Central
Google Scholar
Lewis GD, Malhotra R, Hernandez AF, McNulty SE, Smith A, Felker GM, et al. Effect of oral iron repletion on exercise capacity in patients with heart failure with reduced ejection fraction and iron deficiency: the IRONOUT HF randomized clinical trial. JAMA. 2017;317:1958–66.
Article
PubMed
PubMed Central
Google Scholar
Beale A, Carballo D, Stirnemann J, Garin N, Agoritsas T, Serratrice J, et al. Iron deficiency in acute decompensated HF. J Clin Med. 2019;8:1569.
Article
PubMed
PubMed Central
Google Scholar
Beattie JM, Khatib R, Phillips CJ, Williams SG. Iron deficiency in 78,805 people admitted with HF across england: A retrospective cohort study. Open Heart. 2020;7:e001153.
Article
PubMed
PubMed Central
Google Scholar
Núñez J, Monmeneu JV, Mollar A, Núñez E, Bodí V, Miñana G, et al. Left ventricular ejection fraction recovery in patients with HF treated with intravenous iron: A pilot study. ESC Heart Fail. 2016;3:293–8.
Article
PubMed
PubMed Central
Google Scholar
Moliner PA, Jankowska E, Van Veldhuisen DJ, Farre N, Rozentryt P, Enjuanes C, et al. Clinical correlates and prognostic impact of impaired iron storage versus impaired iron transport in an international cohort of 1821 patients with chronic HF. Int J Cardiol. 2017;243:360–6.
Article
PubMed
Google Scholar
McDonagh T, MacDougall IC. Iron therapy for the treatment of iron deficiency in chronic HF: intravenous or oral? Eur J Heart Fail. 2015;17:248–62.
Article
PubMed
Google Scholar
McDonagh T, Damy T, Doehner W, Lam CS, Sindone A, Van Der Meer P, et al. Screening, diagnosis and treatment of iron deficiency in chronic HF: putting the 2016 European society of cardiology HF guidelines into clinical practice. Eur J Heart Fail. 2018;20:1664–72.
Article
PubMed
Google Scholar
Enjuanes C, Bruguera J, Grau M, Cladellas M, Gonzalez G, Meroño O, et al. Iron status in chronic HF: impact on symptoms, functional class and submaximal exercise capacity. Rev Esp Cardiol. 2016;69:247–55.
Article
PubMed
Google Scholar
Comin-Colet J, Enjuanes C, Gonzalez G, Torrens A, Cladellas M, Meroño O, et al. Iron deficiency is a key determinant of health-related quality of life in patients with chronic HF regardless of anaemia status. Eur J Heart Fail. 2013;15:1164–72.
Article
PubMed
PubMed Central
Google Scholar
Naito Y, Tsujino T, Matsumoto M, Sakoda T, Ohyanagi M, Masuyama T. Adaptive response of the heart to long-term anemia induced by iron deficiency. Am J Physiol Heart Circ Physiol. 2009;296:H585-93.
Article
PubMed
Google Scholar
Keller-Ross ML, Larson M, Johnson BD. Skeletal muscle fatigability in HF. Front Physiol. 2019;21:10:129.
Article
Google Scholar
Caminiti G, Sposato B, Volterrani M. The role of iron deficiency in HF. Eur Heart J Suppl. 2023;26(25Suppl C):C306-8.
Article
Google Scholar
Houstis NE, Eisman AS, Pappagianopoulos PP, Wooster L, Bailey CS, Wagner PD, et al. Exercise intolerance in HF with preserved ejection fraction: diagnosing and ranking its causes using personalized O2 pathway analysis. Circulation. 2017;137:148–61.
Article
PubMed
PubMed Central
Google Scholar
Wijk SS, Van Empel V, Davarzani N, Maeder MT, Handschin R, Pfisterer ME, et al. TIME-CHF Investigators. Circulating biomarkers of distinct pathophysiological pathways in HF with preserved vs. reduced left ventricular ejection fraction. Eur J Heart Fail. 2015;17:1006–14.
Paulus WJ, Tschöpe C. A novel paradigm for HF with preserved ejection fraction. J Am Coll Cardiol. 2013;62:263–71.
Article
PubMed
Google Scholar
Wijk SSV, Van Empel V, Davarzani N, Maeder MT, Handschin R, Pfisterer ME, ,;TIME-CHFInvestigators. Circulating biomarkers of distinct pathophysiological pathways in HF with preserved vs. reduced left ventricular ejection fraction. Eur J Heart Fail. 2015;17:1006–14.
Article
Google Scholar
Hu D, Liu J, Zhang L, Bai X, Tian A, Huang X, et al. Health Status Predicts Short- and Long-Term Risk of Composite Clinical Outcomes in Acute HF. JACC Heart Fail. 2021;9(12):861–73.
Article
PubMed
Google Scholar
Jankowska EA, Ponikowski P. Iron deficiency in HF: A Korea-Oriented review. Int J Heart Fail. 2023;5(4):173–83.
Article
PubMed
PubMed Central
Google Scholar
Rocha BML, Cunha GJL, Menezes Falcão LF. The burden of iron deficiency in HF: therapeutic approach. J Am Coll Cardiol. 2018;71(7):782–93.
Article
PubMed
Google Scholar
Anker SD, Khan MS, Butler J, von Haehling S, Jankowska EA, Ponikowski P, Friede T. Effect of intravenous iron replacement on recurrent HF hospitalizations and cardiovascular mortality in patients with HF and iron deficiency: A bayesian meta-analysis. Eur J Heart Fail. 2023;25(7):1080–90.
Article
PubMed
Google Scholar
Kalra PR, Cleland JGF, Petrie MC, Thomson EA, Kalra PA, Squire IB, IRONMAN Study Group, et al. Intravenous ferric derisomaltose in patients with HF and iron deficiency in the UK (IRONMAN): an investigator-initiated, prospective, randomised, open-label, blinded-endpoint trial. Lancet. 2022;400(10369):2199–209. https://doi.org/10.1016/S0140-6736(22)02083-9.
Article
PubMed
Google Scholar
Anker SD, Comin Colet J, Filippatos G, Willenheimer R, Dickstein K, Drexler H, et al. FAIR-HF trial investigators. Ferric carboxymaltose in patients with HF and iron deficiency. N Engl J Med. 2009;361:2436–88.
Article
PubMed
Google Scholar
Kosiborod MN, Jhund PS, Docherty KF, Diez M, Petrie MC, Verma S, et al. Effects of Dapagliflozin on symptoms, function, and quality of life in patients with HF and reduced ejection fraction: results from the DAPA-HF. Trial Circulation. 2020;141:90–9.
Article
PubMed
Google Scholar
Butler J, Anker SD, Filippatos G, Khan MS, Ferreira JP, Pocock SJ, et al. EMPEROR-reduced trial committees and investigators. Empagliflozin and health-related quality of life outcomes in patients with HF with reduced ejection fraction: the EMPEROR-Reduced trial. Eur Heart J. 2012;42:1203–12.
Article
Google Scholar
Forman DE, Fleg JL, Kitzman DW, Brawner CA, Swank AM, McKelvie RS, et al. 6-min walk test provides prognostic utility comparable to cardiopulmonary exercise testing in ambulatory outpatients with systolic HF. J Am Coll Cardiol. 2012;60:2653–61.
Article
PubMed
PubMed Central
Google Scholar
Shoemaker MJ, Curtis AB, Vangsnes E, Dickinson MG. Triangulating clinically meaningful change in the six-minute walk test in individuals with chronic HF: a systematic review. Cardiopulm Phys Ther J. 2012;23(3):5–15.
Article
PubMed
PubMed Central
Google Scholar
Opasich C, Pinna GD, Mazza A, Febo O, Riccardi R, Riccardi PG, et al. Six-minute walking performance in patients with moderate-to-severe HF; is it a useful indicator in clinical practice? Eur Heart J. 2001;22(6):488–96.
LIBERTYVILLE, Ill., Nov. 21, 2025 /PRNewswire/ — Hollister Incorporated, a global leader in healthcare products and services, proudly announces a groundbreaking policy shift benefiting thousands of Medicare beneficiaries living with spinal cord injuries (SCI). In a landmark victory for patient advocacy, the Durable Medical Equipment Medicare Administrative Contractor’s (DME MACs) have agreed to expand access to closed system intermittent catheters—critical medical devices proven to help prevent urinary tract infections (UTIs) and protect patient health.
A Milestone in Healthcare Equity and Patient Empowerment
Hollister’s sustained advocacy challenged these barriers head-on. For over fifty years, restrictive policy forced people with SCI covered by Medicare to suffer multiple UTIs before qualifying for closed system intermittent catheters. Most users endured two or more infections within a year before accessing devices specifically designed to prevent such outcomes—a requirement that left countless vulnerable patients at risk. By championing change, Hollister made the case for prevention and dignity, not just treatment.
“Expanding access to closed system intermittent catheters is more than a policy victory— it’s a powerful step forward in fulfilling our mission to make life more rewarding and dignified for people who use our products and services. This change reflects our unwavering dedication to making a meaningful difference for our customers,” said President and CEO, Abinash Nayak.
Relentless Advocacy Yields Results
Three years ago, under the strategic leadership of Casey Haan, Senior Director of Market Access and Government Affairs, the Hollister team launched a comprehensive campaign to eliminate this long-standing barrier. Through expert policy strategy and tireless commitment, Hollister worked closely with the DME MACs to influence change resulting in updated coverage criteria—ensuring more equitable access for those most in need.
What’s Changing
Effective January 1, 2026, any Medicare beneficiary diagnosed with a spinal cord injury at any level will now qualify for a closed system intermittent catheter.
This update eliminates decades-old restrictions, opening access to advanced care for one of the most vulnerable groups of catheter users.
Transforming Lives – Today and Tomorrow
For patients, this policy change means easier, timely access to medical devices that support better health, greater independence, and a higher quality of life. For healthcare professionals, it streamlines prescribing and paperwork, making it simpler to deliver the best possible care.
“This historical transformation represents a significant step forward in Continence Care and patient advocacy, allowing for the clinician and patient to make the best product choice to meet their individual and specific needs,” said Casey Haan.
Looking Ahead: Commitment to Innovation and Advocacy
This policy change stands as a testament to Hollister’s enduring commitment to patient advocacy, innovation, and its mission to empower those who rely on its products. Hollister remains dedicated to driving positive change that enhances lives, advances healthcare equity, and sets new standards for compassionate care.
About Hollister Incorporated
Hollister Incorporated is a global MedTech company with a 100+ year history deeply rooted in our Mission of making life more rewarding and dignified for those who use our products and services.
A pioneer in advancing Ostomy, Continence Care, and Critical Care products and solutions, we are proud of our global impact: over 5,000 Associates in 24 countries manufacturing products on three continents, serving customers in nearly 80 countries. And growing.
Hollister is an independent, employee-owned company and wholly owned subsidiary of The Firm of John Dickinson Schneider Inc. For more information about Hollister, please visit https://www.hollister.com/. Follow @Hollister-Incorporated on LinkedIn.
The foundations for the two offshore substations have been installed at the Nordseecluster offshore wind farm site in the German North Sea.
Source: Sven Utermöhlen, CEO of RWE Offshore Wind, via LinkedIn
According to the CEO of RWE Offshore Wind, Sven Utermöhlen, a jacket foundation, including four piles and one transition piece, was installed at the end of last week.
The offshore platforms were loaded at the Port of Rotterdam and made their 18-hour journey to the construction site.
Transporting and installing the components, which weigh over 2,000 tonnes, was carried out by Heerema Marine Contractors’ semi-submersible crane vessel (SSCV) Sleipnir. The two substation topsides are expected to follow in 2026.
Atlantique Offshore Energy, the marine energy business unit of French company Chantiers de l’Atlantique, was selected to deliver the two substations for the first phase of RWE’s Nordseecluster development in the German North Sea.
The foundations for the two substations were manufactured by Italy-headquartered Rosetti Marino under a contract signed with Chantiers de l’Atlantique in September 2023.
With this work, all the foundations for the 660 MW Nordseecluster A are now in place. The wind farm, featuring 44 Vestas V236-15.0 MW, is planned to be fully commissioned in 2027. Nordseecluster B will contribute an additional 900 MW through its 60 wind turbines.
The Nordseecluster offshore wind development is owned by RWE and Norges Bank Investment Management.