After stepping down as Amazon’s CEO four years ago, Jeff Bezos, the billionaire founder and former chief executive of the online shopping company, is going to be a CEO again. This time, Bezos has appointed himself co-CEO of an AI startup called Project Prometheus, the New York Times reported, citing anonymous sources.
The startup, which will focus on developing AI for engineering and manufacturing in various fields, has already received $6.2bn in funding – more than many companies are able to raise in their lifetimes. Leading the company alongside Bezos is his co-founder and co-CEO Vik Bajaj, a celebrity tech executive in his own right. Bajaj is a physicist and chemist best known for his work at Google’s moonshot factory, X, where he founded the health startup Verily.
It’s unclear how long the company has existed, but Project Prometheus has already hired 100 employees, poaching several from firms like OpenAI, DeepMind and Meta, according to the Times. Little else is known about the project, as Bezos did not disclose where the company will be based or how its technology might function. The world’s third-richest person has been closely involved at his aerospace company Blue Origin for several years as its founder and sole shareholder, but becoming a CEO again will be the first formal role Bezos has taken since stepping down from Amazon.
skip past newsletter promotion
after newsletter promotion
Bezos and Bajaj join a crowded AI marketplace where billions of dollars are being poured into competitors like OpenAI and billions more are being spent to support the rapid development of AI models. More experts are beginning to question the financial sustainability of the AI industry, though. Michael Burry, best known for accurately predicting the 2008 housing crisis, recently invested $1bn in bets that Palantir and Nvidia shares will fall just days after he accused some of the big tech firms of using accounting tricks to “artificially boost earnings”.
Nvidia CEO Jensen Huang says that leading a company like chipmaker Nvidia is a privilege but it also requires an individual to sacrifice their life to be of service to the business and its employees.
Huang, worth $165 billion according to the Bloomberg Billionaires Index, recently gave a talk to students at the University of Cambridge, in which he described how his parents’ pursuit of success in the U.S. laid the foundation for his work ethic in building his own company. Huang, along with two friends, founded Nvidia in 1993 and over the past two decades has grown the business to a market cap of more than $4.6 trillion.
He launched Nvidia from a Denny’s dining booth without a business plan, he said, and had to learn his leadership and management skills on the job. After all, Nvidia is the first and only business he has ever led.
His mantra for success has been simple: “Don’t get bored and don’t get fired,” he said at the event earlier this month.
While that sounds straightforward enough, Huang also warned a life of extreme success in a highly competitive industry like tech is not without its drawbacks.
When discussing why he, as opposed to his engineer co-founders Chris Malachowsky and Curtis Priem, landed the top job, Huang said it was because “they didn’t want the job.”
“In retrospect, I could have been smarter myself, and to be CEO is a lifetime of sacrifice,” Huang told his audience. “Most people think that it’s about leading and being in command and being on top. None of that is true. You’re in service of the company. You’re creating conditions for other people to do their life’s work, you’re inspiring through example. Most of the examples are making difficult decisions during very difficult times, it’s mostly about sacrifiice.”
“It’s about strategy, and strategy … is not just about choosing what to do, it’s about choosing what not to do, which is sacrifice, and the determination, the conviction, the pain and suffering that goes along with overcoming obstacles, that’s all sacrifice.”
Huang has been open about his unrivalled work ethic and the commitment he expects from his employees. Previously, the 62-year-old CEO said he works from the moment he wakes up until the moment he goes to sleep, adding in an interview with Stripe’s CEOPatrick Collison last year that he can’t even watch a movie without thinking about his company.
In a 60 Minutes interview in 2024 he was asked whether “demanding,” “perfectionist,” and “not easy to work for,” were accurate descriptions of him, Huang said they fit him “perfectly,” explaining: “It should be like that. If you want to do extraordinary things, it shouldn’t be easy.”
A family trait
The Taiwanese-American entrepreneur attributed his commitment and determination to his parents: His father, determined to see his children grow up in America; and his mother, teaching her children English despite the fact she didn’t speak the language herself.
“My parents wanted us to pursue the American Dream,” Huang said. “They didn’t have very much, they were quite modest, and moving to the United States was quite difficult for us in 1973, but somehow we made our way through it. I think the life of struggle, endeavour, nothing for granted, having to earn anything, I think was good CEO training.”
Huang went on to study at Oregon State and Stanford University, crediting his parents with instilling a belief in him that he could achieve. Wearing his usual leather jacket, Huang added his mother had insisted he was “special,” explaining: “Often times, if people tell you that you’re better, greater, more capable than you are, you might live up to that expectation. It reminds us to do the same with our companies, it reminds us to do the same with each other.”
“[My mother] left me with an impression that nothing could be that hard, to this day, and people have seen me adapt.”
(This is The Best Stocks in the Market , brought to you by Josh Brown and Sean Russo of Ritholtz Wealth Management.) Josh — In a technology innovation cycle like the PC revolution, dotcom, wireless, dotcom 2.0, cloud computing, AI, etc, investing broadly across the category makes sense because as spending rises, the tide lifts all (most) boats. It’s hard to find a name associated with the theme that doesn’t work, the winners are far more ubiquitous. You can buy “the chips” or “the servers” or “the routers” and you’ll probably make money. In this way, tech reminds me of energy, mining, autos, airlines — areas of the market where the big picture is more meaningful than the differences between the companies (although, of course, these matter — JetBlue is not Delta, Intel is not Nvidia). With the healthcare sector — specifically the pharma and biotech giants — it’s much harder. Yes, you can benefit from a sectorwide re-rating as many investors are today. But you also kind of need to know the names, their history of execution, the turnarounds, the science and the addressable markets they are going after. This is not at all like choosing between Exxon and Chevron. Sean’s going to look at the recent rotation into large cap healthcare market-wide, which is also playing a role in the composition of our Best Stocks in the Market list. I will be back with some commentary on AbbVie (ABBV) , Amgen (AMGN) and Eli Lilly (LLY) , three of our Best Stocks names in the right sector at the right time. Sector leaderboard As of Nov 17, there are 198 names on The Best Stocks in the Market list. Top sector ranking: Top industries: Top 5 best stocks by relative strength: Spotlight Sean — Market leadership has been churning under the surface. Over a three-day stretch last week, healthcare outpaced the S & P 500 by 5.7%, marking the most relative strength since 2008. The bull market has been powered by tech leadership, and that’s reflected in its outsized presence in both the S & P 500 and our Best Stocks list. Still, trends evolve and a few under-the-radar sectors are beginning to show signs of life. As of last week, only 43% of S & P 500 stocks were trading above their 20-day moving averages. Tech, the market’s primary engine this cycle just stalled, with only 25% of the sector above that trend line. Meanwhile, the value-oriented groups are suddenly in the lead: energy has 100% of its constituents above their 20-day moving average, and healthcare sits at 66%, leading all sectors. This isn’t a declaration of a new leadership regime for the market. It’s an observation that a larger share of names in those sectors are in short-term uptrends relative to tech and the market overall. We have 23 healthcare names on the list as of this morning. LLY was the best performing stock on our list last week, you can see it’s in total breakout mode: In addition to the market bidding up beaten down healthcare names, LLY saw 4 analyst upgrades and 2 reaffirms, right in time for a breakout past spring 2025 highs. Zoom out a little further and you’ll see this is the first time LLY has seen new highs since last summer. The fundamentals are backing this move, too. They just reported 54% top-line revenue growth, with several of their key drugs posting triple-digit figures. LLY’s Cardiometabolic drugs Mounjaro and Zepbound reported Q3 revenue growth of 109% and 184% respectively, year-over-year. AbbVie (ABBV) and Amgen (AMGN) are two biotech leaders pushing toward all-time highs. AbbVie has been the standout performer, returning 36% over the past year versus 12% for Amgen and 14% for the XBI. It also carries stronger growth expectations, with analysts looking for 34% EPS growth next year. Management expects to expand operating margins in the coming quarters through SG & A cost reductions and better-than-anticipated revenue drivers. Amgen, by contrast, is in investment mode. R & D spending rose 31% year over year as the company increased funding for later-stage clinical programs. In Q3, management emphasized how Amgen is integrating AI across manufacturing, clinical trials, and early drug discovery — accelerating molecule design and other key elements of its research pipeline and reducing costs in perpetuity. Risk Management Josh — Looking at the LLY chart below, it’s hard not to say “I missed it!” and you might have a little. But here’s the thing, zooming out gives you the context to understand that we may be just at the beginning of something rather than at the end. If your fundamental research leads you to the conclusion that LLY is on the verge of having a great year in 2026, the recent price action shouldn’t scare you away. I’m showing you the three-year look at LLY above (weekly). This breakout has been years in the making. The consolidation period’s highs, in the $950 – $960 area, should serve as support should the stock retrace some of the last week’s furious earnings-driven rally. Investors with no position here should watch that level as an opportunity to get long. If it holds and the stock begins to rebound, you know the longs are serious. AbbVie is a $400 billion market cap giant with a 3% dividend yield and a stock chart that has been going up and to the right for ten straight years. I would give it the benefit of the doubt and want to be long here. I’d use the rising 200-day as rolling stop, updating it at the end of each week. That’s 13% downside from today’s level. I think the higher likelihood is we retest the October blow-off top you can see in the chart above. Above, the long-term view with AbbVie’s actual + expected annual revenue in orange and blue. There’s a reason this stock has done what it’s done. The company’s execution has been incredible. I think it sees 275 before 200, even if you have to wait awhile. Okay, let’s do Amgen. This one’s simple. Here’s a stock that’s spent the last fifteen years in a massive uptrend. You can see the stock broke out in 2012 and basically never looked back: But we can’t have the prices from 2012 back, so let’s zoom in on today. Below I am showing you a one year chart with the stock taking out the spring highs on a great earnings report. RSI is overbought in the mid-70’s so I would give it a week or two to cool off. There will be some profit-taking but hopefully the buyers will remain in control and defend the $320’s area breakout. I’m taking you back slightly further in the chart below… Last week Amgen got above an even more meaningful level, the September 2024 highs. For me, pulling it back tells me we are less extended than the one-year chart would otherwise indicate. This is an important way to regulate our feelings about trade set-ups and remind ourselves that just because we missed a rally doesn’t mean the whole opportunity is now gone. That’s a 200-week moving average in blue, showing an almost perfect support line. Traders can ignore that, it’s too far away from current price — similar to ABBV, I think a low-volume pullback that doesn’t violate the breakout level is a better entry than today. Longer-term investors can get invested today without waiting. DISCLOSURES: (None) All opinions expressed by the CNBC Pro contributors are solely their opinions and do not reflect the opinions of CNBC, NBC UNIVERSAL, their parent company or affiliates, and may have been previously disseminated by them on television, radio, internet or another medium. THE ABOVE CONTENT IS SUBJECT TO OUR TERMS AND CONDITIONS AND PRIVACY POLICY . THIS CONTENT IS PROVIDED FOR INFORMATIONAL PURPOSES ONLY AND DOES NOT CONSITUTE FINANCIAL, INVESTMENT, TAX OR LEGAL ADVICE OR A RECOMMENDATION TO BUY ANY SECURITY OR OTHER FINANCIAL ASSET. THE CONTENT IS GENERAL IN NATURE AND DOES NOT REFLECT ANY INDIVIDUAL’S UNIQUE PERSONAL CIRCUMSTANCES. THE ABOVE CONTENT MIGHT NOT BE SUITABLE FOR YOUR PARTICULAR CIRCUMSTANCES. BEFORE MAKING ANY FINANCIAL DECISIONS, YOU SHOULD STRONGLY CONSIDER SEEKING ADVICE FROM YOUR OWN FINANCIAL OR INVESTMENT ADVISOR. INVESTING INVOLVES RISK. EXAMPLES OF ANALYSIS CONTAINED IN THIS ARTICLE ARE ONLY EXAMPLES. THE VIEWS AND OPINIONS EXPRESSED ARE THOSE OF THE CONTRIBUTORS AND DO NOT NECESSARILY REFLECT THE OFFICIAL POLICY OR POSITION OF RITHOLTZ WEALTH MANAGEMENT, LLC. JOSH BROWN IS THE CEO OF RITHOLTZ WEALTH MANAGEMENT AND MAY MAINTAIN A SECURITY POSITION IN THE SECURITIES DISCUSSED. ASSUMPTIONS MADE WITHIN THE ANALYSIS ARE NOT REFLECTIVE OF THE POSITION OF RITHOLTZ WEALTH MANAGEMENT, LLC” TO THE END OF OR OUR DISCLOSURE. Click here for the full disclaimer.
STRASBOURG, November 17th, 2025 – Leanspace, a European satellite operations technology provider, today announced it has raised €10 million in Series A funding. The financing round includes new strategic investors: ISAI Cap Venture, Capgemini’s corporate venture arm, and Qwaltec, a US-based space and defense contractor, alongside historical investors specializing in space, defense, and enterprise software: VC firms 42CAP and Karista, and Arnaud Guérin, co-founder of military AI platform Preligens. Additional non-dilutive funding comes from Caisse d’Epargne and Bpifrance via the France 2030 strategic investment plan.
The space industry is undergoing a rapid transformation with the rise of satellite constellations, dynamic missions, and increasing security demands. Yet, the technologies to operate space programs have struggled to keep pace, creating cost and complexity for spacecraft operators. With this new financing round and strategic alliances, Leanspace will accelerate the shift to software-defined satellite operations across European and North American markets.
Founded in 2020, Leanspace has developed a software platform for satellite and ground segment operations that has been flight-proven and trusted by more than 20 spacecraft operators worldwide, with an initial focus on small satellite missions with customers such as Quantum Space (USA), Look Up (France), and Clearspace (Switzerland). Since 2024, the company has expanded into the enterprise and institutional markets, having already secured 7 contracts with space agencies and leading primes in Europe, the US, and Asia, such as Airbus Defense & Space (France), Hispasat (Spain), and the European Space Agency.
Leanspace currently addresses 6 market segments: small satellites, in-orbit services vehicles, satellite constellations, launchers & spaceports, large satellites, and ground station networks. The Leanspace platform provides a wide range of software products across satellite monitoring & control, mission planning, ground segment orchestration, and testing of space hardware.
Thanks to its new strategic industrial investors, Leanspace is now accelerating its expansion into large, high-complexity, and security-critical space programs. Leveraging the platform and its open customization model, the new industrial partners will deliver turnkey mission operations systems and provide additional value with managed services, operations engineering support, and local compliance with national security requirements in both Europe and the US.
“Software-defined satellite operations solve the key challenges of modern space programs: agility, resilience, and cost efficiency,” said Guillaume Tanier, CEO of Leanspace. “This new financing round and strategic partnerships bring heritage and execution power, reinforcing our credibility as expected by major enterprise, civilian, and military customers. This supports our goal to be a trusted infrastructure for complex space programs and validates our long-term vision of becoming the technological de facto standard around the world.”
Around its platform, Leanspace is building a global ecosystem of industrial partners. The company is welcoming additional players – satellite manufacturers, software integrators, cloud providers, SSA, GSaaS, and other providers of space services – to join and build the software-defined space industry of the future.
About ISAI Cap Venture II ISAI Cap Venture II is an 80 M€ investment fund, launched from the partnership between ISAI and Capgemini, to invest around the world in start-ups and scale-ups offering innovative solutions aimed at large companies. The fund co-invests in Series A and onwards with an entry ticket between 1M and 5M€. ISAI manages its investments in accordance with the rules and practices of the venture capital industry. Capgemini, as a business partner, facilitates client adoption of the innovative solutions, helping to accelerate the growth of start-ups and scale-ups in the portfolio. www.isai.fr
About Qwaltec, Inc Qwaltec is a US-based, woman-owned defense contractor and a trusted partner to NASA, the US Department of Defense, and other leading aerospace corporations for over 25 years. Qwaltec has been building and operating efficient and cost-effective ground system solutions for government and commercial space programs since 2001. With deep expertise in systems engineering, mission operations, readiness & training, and testing & integration, Qwaltec ensures the success of today’s and tomorrow’s space missions. For more information, visit: www.qwaltec.com
NEW YORK, Nov. 17, 2025 /PRNewswire/ — Ramp, the leading financial operations platform, is now valued at $32B following a $300 million primary financing round and an employee tender offer. Lightspeed Venture Partners led the financing, with continued support from existing investors including: Founders Fund, D1 Capital Partners, Coatue, GIC, Avenir Growth, Thrive Capital, Sutter Hill Ventures, T. Rowe Price, Khosla Ventures, ICONIQ, Glade Brook Capital Partners, Soma Capital, Emerson Collective, 8VC, Lux Capital, Definition Capital, 137 Ventures, General Catalyst, Box Group, Kultura Capital, Pinegrove Venture Partners, Anti Fund, and Stripes. New investors in the company include: Alpha Wave Global, Bessemer Venture Partners, Robinhood Ventures, 1789 Capital, Epicenter Capital, and Coral Capital.
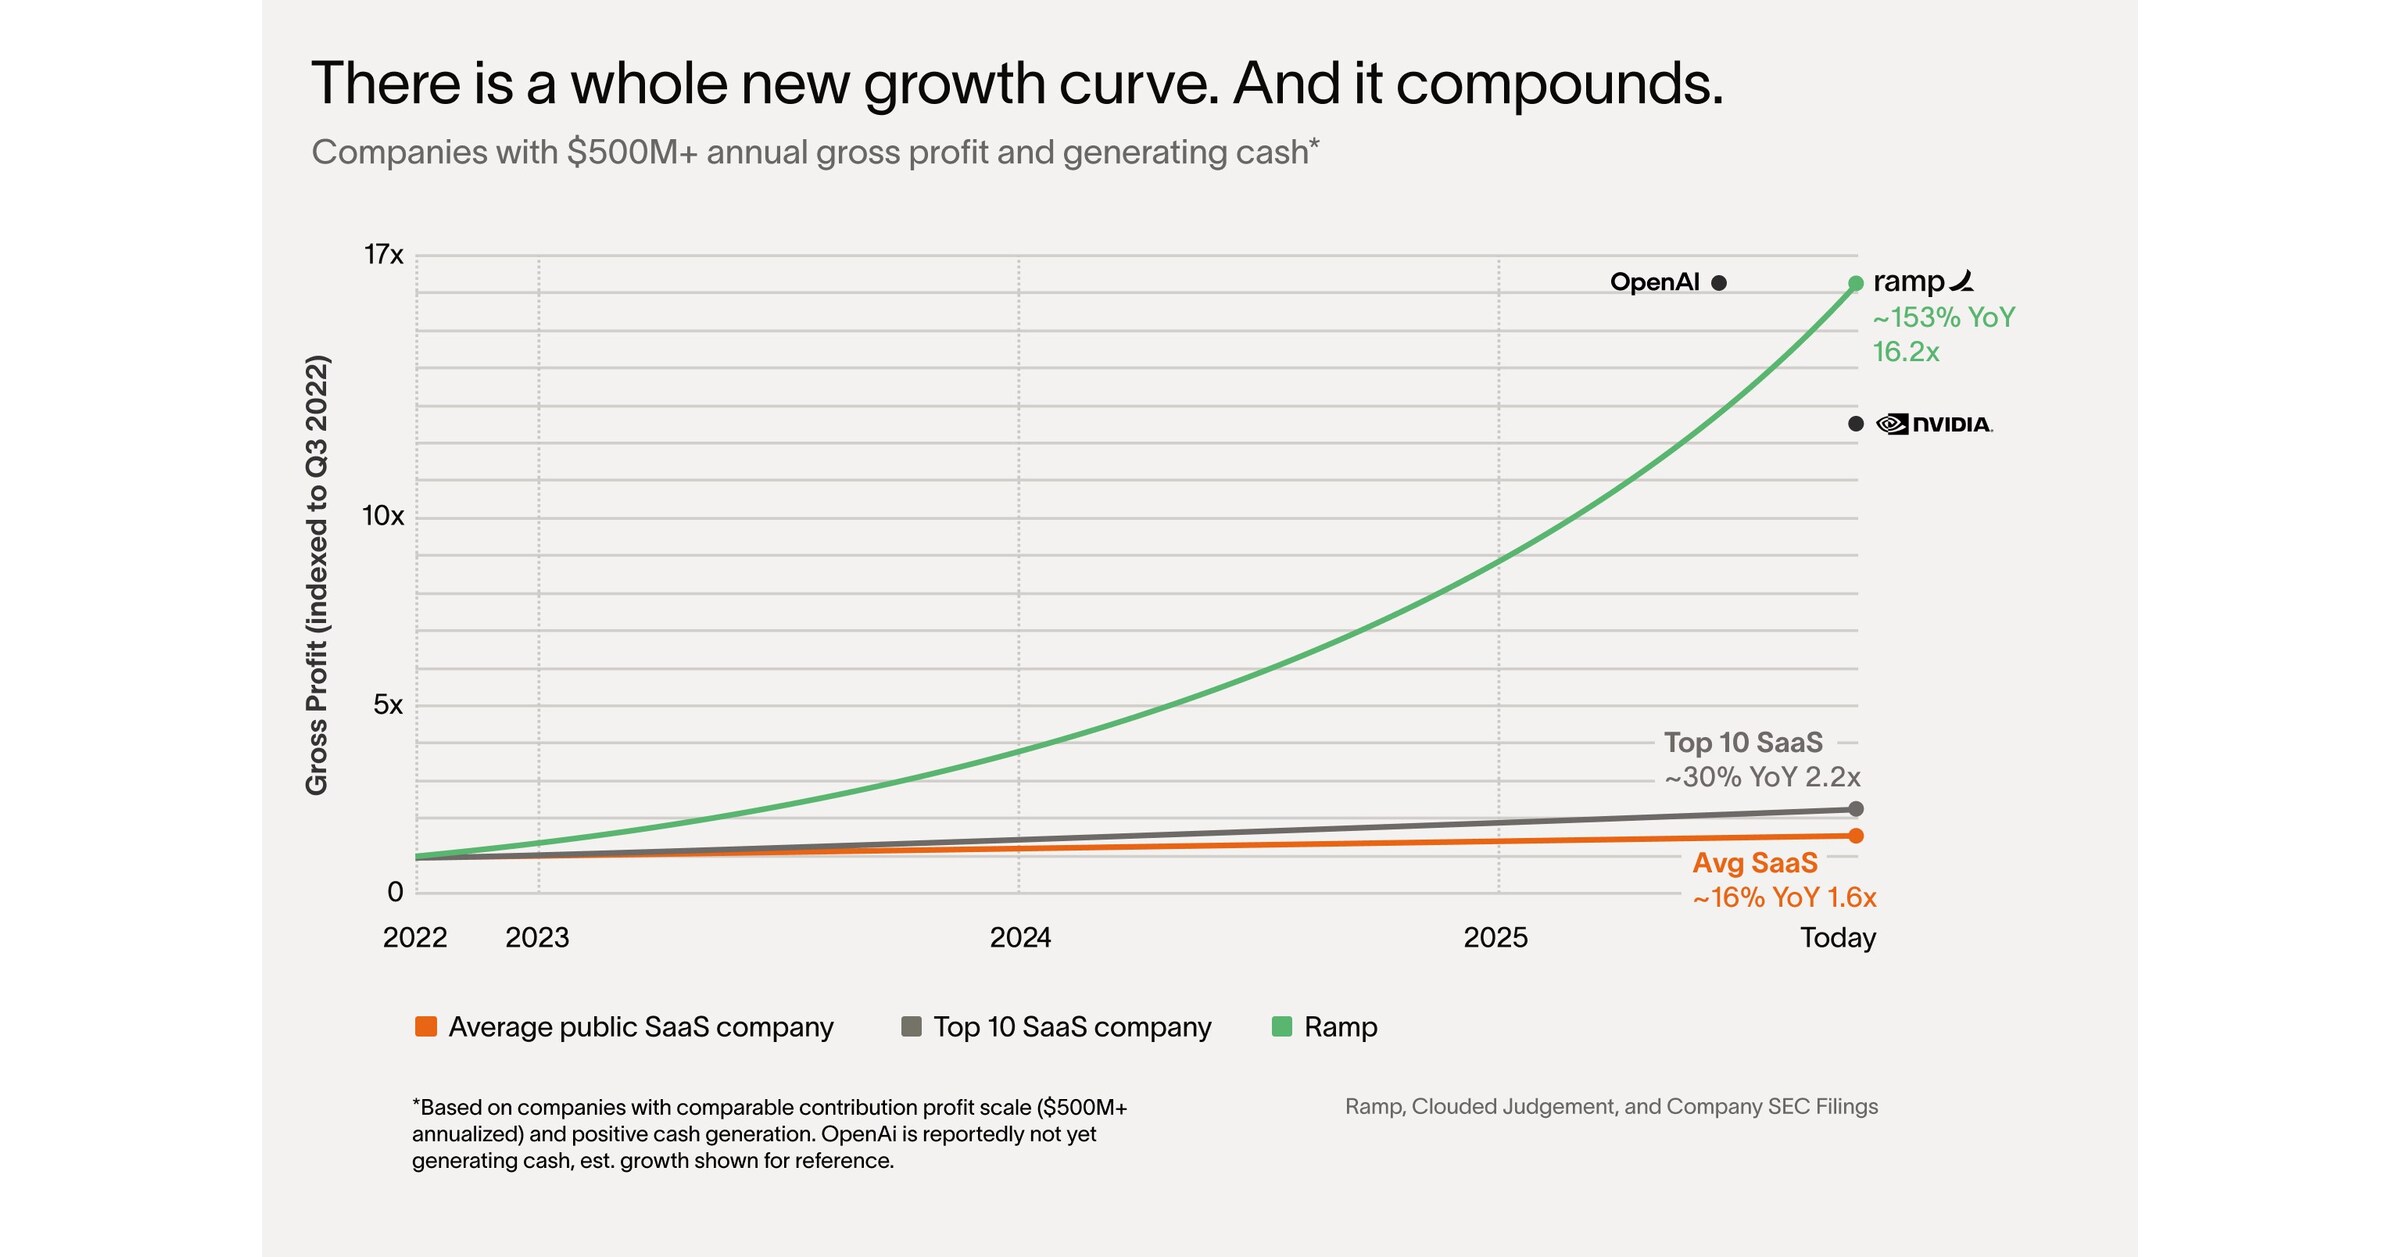
There’s a whole new growth curve
To date Ramp has saved customers over $10 billion and 27.5 million hours. These savings come from efficiencies driven within the finance function as well as across companies as a whole. In the past three months alone, Ramp has doubled the percentage of zero-touch transactions for employees — saving massive amounts of time for every individual and function.
In July, Ramp released its first agent: Agents for Controllers. In October, Ramp expanded agentic workflows with Agents for AP.
In October, Ramp’s AI made 26,146,619 decisions across over $10 billion in spend. Customers of every size are experiencing tangible benefits, including:
Our treasury agent moved $5.5 million from idle cash to 4% investments
Our fraud agent blocked a $49,000 AI-generated fake invoice
Our travel agent saved $113.34 for a customer on his upcoming trip
“I don’t want anyone at Sierra spending time on expense reports or invoices,” said Bret Taylor, Co-Founder and CEO of Sierra and Chairman of OpenAI. “Ramp’s AI has automated entire categories of work that used to slow us down. Because of Ramp, we now have more time to focus on what actually matters, building great products and growing the business.”
Key Company Stats as of Nov 1, 2025
Generating over $1 billion in annualized revenue and producing free cash flow.
Serving over 50,000 customers, doubling year-over-year, including CBRE, Shopify, Anduril, Figma, Notion, Cursor, The Chicago Blackhawks, The University of Tennessee, and Vercel.
Enabling more than $100 billion in annualized purchase volume.*
Grew enterprise customer base by 133% year-over-year, with over 2,200 customers contributing $100,000 or more in annualized revenue.
The majority of Ramp’s customers use two or more products across Ramp’s platform.
With this round, Ramp has raised $2.3 billion in total equity financing.
“Our goal is to make every customer more profitable,” said Eric Glyman, co-founder and CEO of Ramp. “On average, companies that switch to Ramp spend 5% less and grow 12% faster – results that outpace nearly every benchmark. The most disciplined and fastest-growing teams choose Ramp because it helps them scale more efficiently. We are working hard to bring that advantage to every business.”
What follows is a letter Eric Glyman, co-founder and CEO of Ramp, shared with customers here.
Ramp at $32 billion: Money talks. Now it thinks.
In the first year of business, every dollar is a decision.
A $500 software subscription is a discussion. A $5,000 research tool is a debate. Everyone knows who approved what — and whether it was worth it.
Ten years later, the same subscription has empty seats renewing on autopilot, and $5,000 of research slips away as miscellaneous. There’s also a $1.2 million SAP maintenance contract that nobody dares question because “it’s always been there.”
You used to run the business. Now the business runs you. And if you do question an expense, you get a spreadsheet, not an answer.
Every founder is adamant this will not happen to them — but it inevitably does. You start building a product. You end up building a bureaucracy.
Take the average publicly listed SaaS company. Big teams, lots of bloat. They’re growing at 16% per year. What about just the top 10? The best performers. They’re growing at 30% YoY. This is all public data.1
So when I tell you Ramp’s underlying profitability2 is growing 153% year over year, that sounds absurd. It’s 10x faster each year than the median publicly traded SaaS company. Our revenue was $500 million 12 months ago, over $1 billion today.
A whole new class of companies have come along. Heavyweights that move like lightweights.
Getting big no longer means getting slow. Let me explain.
The Age of “Thinking Money” (2025 —)
For millennia, money talked — but it didn’t think.
Then AI happened. Suddenly, money was no longer just a number in an Excel sheet. For the first time it understood context, could reason, and act.
Imagine a dollar wants to leave your company. Before “thinking money” it could simply walk out. No memory of what it funded, or knowledge if it was spent wisely.
Now, that same dollar has intelligence. So before it leaves it checks for fraud and if you have permission to spend it. It has memory. So as it moves it leaves a complete audit trail and updates budgets. And it can reason. So once it’s spent it tells you if it was well used, underused, or wasted.
That’s one dollar. The average publicly listed SaaS spends over five hundred million of them each year. What if each one a) was only spent if it should be, b) audited itself instantly, and c) flowed only to the highest-impact projects?
You had a bureaucracy. Now, you have a business again.
If money thinks, what does finance do?
Rather than have me explain, let me show you.
In October, Ramp’s AI made 26,146,619 decisions across more than $10 billion in spend. This is “thinking money” with intelligence, memory, and reason. Here are a few of those decisions:
Our treasury agent moved $5.5 million from idle cash to 4% investments.
Our fraud agent blocked a $49,000 AI-generated fake invoice.
Our travel agent saved $113.34 for Zain on his trip to New York.
What do all these decisions have in common? They’re objective! Put every accountant in America in a room, give them context and 10 minutes, and they’d all agree. But in practice, thousands of small would-be improvements slip through every day.
Now that all of this is automated, your finance team is free to make a smaller number of higher-leverage decisions. They’re strategists — not clerks. Not catching policy violations, they’re designing policy that enforces itself. Not coding transactions, they’re working out how best to allocate a $500 million budget.
Big decisions. Not the small stuff.
The return of economic productivity
Forty years ago, Robert Solow said “You can see the computer age everywhere but in the productivity statistics.”
And for decades he was right. From 1947 to 1973, U.S. productivity grew 2.8% a year. In the last three decades, just 1.4%. But that was the age of “money talks.”
Now it’s the age of “thinking money.” When thinking money automates the small stuff, companies run better. The median Ramp customer saves 5% while growing revenue 12% year over year.3 They’re closing books in days instead of weeks, running leaner teams, and compounding efficiency gains quarter after quarter.
The promise of the computer age — widely available, cheap intelligence — is only now coming to life, and helping everyday companies get more from their time and money. Finally, we’re proving Solow wrong.
A whole new growth curve
I’d started by telling you “there’s a whole new growth curve.” Well, I’d like to end by explaining it.
All the way back in 1967, there was a computer scientist named Melvin Conway. He was frustrated by how slowly software projects were moving at IBM, so he started researching the problem.
Two months later, he published the paper that introduced the now-infamous Conway’s law.
“Your product mirrors the system of the organization that built it.”
In plain terms: the reason IBM’s software was slow and complicated was because IBM was slow and complicated.
So, what if your staff no longer had to book travel, email receipts, update budgets, or chase approvals? What if there weren’t three layers of management between spend and strategy?
No, you won’t magically start growing at 100% YoY. But you’re building the kind of organization that can.
That’s the second growth curve. That’s “thinking money.”
– Eric
About Ramp Ramp is a financial operations platform designed to save companies time and money. Our all-in-one solution combines corporate cards and expense management, bill payments, procurement, travel booking, treasury, and automated bookkeeping with built-in intelligence to maximize the impact of every dollar and hour spent. Over 50,000 organizations, from family farms to space startups, have saved $10 billion and 27.5 million hours with Ramp. Founded in 2019, Ramp powers over $100 billion in purchases annually. Learn more at www.ramp.com.
* Ramp does not include bank transfers or non-monetized payments when calculating Total Purchase Volume.
Contact [email protected]
1 Based on current gross profit growth rates of 1) the top 10 SaaS companies and 2) the average SaaS company within Clouded Judgement‘s tracked universe. 2 Ramp’s underlying profitability is measured by contribution profit. 3 Based on anonymized Ramp customer data from Q3 2025, comparing pre- and post-adoption performance across 50,000+ companies. Revenue growth rate is more than double the national average for businesses in the U.S.
LONDON/NEW YORK, Nov 17 (Reuters) – London-headquartered law firm Ashurst and U.S.-based Perkins Coie on Monday announced they have agreed a merger which would create a combined firm of 3,000 lawyers with $2.7 billion in revenue, putting it in the top 20 worldwide.
Perkins Coie was among four law firms that successfully sued U.S. President Donald Trump’s administration this year to block executive orders targeting them over their links to Trump’s perceived political enemies.
Sign up here.
Ashurst’s global CEO Paul Jenkins told Reuters the two firms had been in merger discussions since February, and that “from the beginning our conversations have really focused on the future, not just the year or two, but the next decade and beyond”.
Perkins Coie’s managing partner Bill Malley said that Ashurst “complements our geographic reach”, adding that “we must strengthen our ability to deliver trusted legal guidance seamlessly across borders”.
He told Reuters that the combined firm will be “uniquely suited” to serve clients in areas including technology, financial services, and energy and infrastructure.
Jenkins and Malley will be global co-CEOs of the new firm, which will be called Ashurst Perkins Coie.
The announcement marks the latest major transatlantic merger of law firms in recent years, part of a move toward consolidation as firms seek scale to compete across major markets and practice areas.
It follows similar agreements between British and U.S. firms, including a deal between Herbert Smith Freehills and Kramer Levin announced last year, and the Allen & Overy and Shearman & Sterling tie-up announced in 2023.
The firms said the proposed merger is subject to approval by a vote of partners at each firm and, if approved, is expected to be completed in late 2026.
The combined firm will have 52 offices in 23 countries, and Jenkins told Reuters there was “no intention at this stage” to open more offices.
Perkins Coie, which had represented the campaign of 2016 Democratic presidential nominee Hillary Clinton, was targeted by Trump with an executive order in March that suspended security clearances for its employees and restricted their access to federal buildings and contracting work.
The order against Perkins Coie was struck down in May, though Trump’s administration is appealing. Similar executive orders against WilmerHale, Jenner & Block and Susman Godfrey were also struck down.
($1 = 0.7590 pounds)
Reporting by Sam Tobin in London and Sara Merken in New York; Editing by Toby Chopra and Jan Harvey
Our Standards: The Thomson Reuters Trust Principles., opens new tab
Thank you, President Schmid, for the kind introduction and for the invitation to speak here today.1 It is an honor to be in Kansas City and in the beautiful 10th District. I welcome the opportunity to attend events like this one because I believe it is essential for Federal Reserve policymakers to share their views with the public and, just as important, to hear directly from business leaders, workers, and families about how they are experiencing the economy.
In many ways, the Kansas City region is a perfect place to make those connections. Sitting at the confluence of the Kansas and Missouri rivers, this area has been a place where people met and shared ideas long before the United States existed. And that tradition of making connections has continued to present day. The Pony Express was founded just north of here in St. Joseph, this is the greeting card capital, and, next year, this area will bring people together from around the globe for soccer’s World Cup. I am happy to have the opportunity to continue the tradition of making connections in Kansas City with all of you.
Today I would like to share my economic outlook. I will discuss how I see recent economic activity and talk about developments pertaining to both sides of our dual mandate of maximum employment and price stability. I will then offer my current view of monetary policy including the Fed’s balance sheet before turning to our discussion.
Economic Outlook
In shaping my economic outlook, I consider a wide variety of government, administrative, and private-sector data, including data collected by the Kansas City Fed and fellow Reserve Banks across the country. Casting a wide net for information on the economy is especially important at this moment because the recent federal government shutdown has delayed the release of key economic indicators that I typically refer to in speeches like this one, including the monthly jobs report and the personal consumption expenditures price index. While I consider federal data to be the gold standard, other sources of information are also available for policymakers to do our jobs. And part of that information comes from meetings like this one and hearing from contacts around the country. For example, ahead of our next policy meeting, I look forward to reviewing the Beige Book, a report on economic conditions in each of the twelve Reserve Bank districts, which will be released next week.
Economic Activity
Before the government shutdown, available data indicated that the U.S. economy was on a trajectory of moderate growth this year. The shutdown has likely curtailed economic activity this quarter, reflecting furloughed federal workers and the suspension of government purchases of goods and services, including payments to contractors. There may also have been spillover effects to the private sector stemming from delays in federal payments, approvals, and other government activity. I see those effects as largely temporary and likely to reverse in the coming months. Thinking more broadly, I see the balance of risks in the economy as having shifted in recent months with increased downside risks to employment compared to the upside risks to inflation, which have likely declined somewhat recently.
Labor market
In the labor market, information available in recent weeks appears to be consistent with a gradual cooling in both labor demand and labor supply. For instance, unemployment insurance claims received from states have largely moved sideways in recent weeks. Anecdotal reports about the state of the labor market have been mixed, with some firms announcing a slower pace of hiring or cutbacks and others indicating they are ready to move forward with previously delayed hiring and investment.
I expect that the unemployment rate is likely to inch up slightly by the end of the year from the relatively low 4.3 percent rate recorded in August. While still solid, I continue to view the risk to my employment forecast as skewed to the downside.
Inflation
The latest available readings show that inflation is running at a rate similar to that of a year ago, a bit below 3 percent, indicating that progress toward our 2 percent target has stalled. This lack of progress appears to be due to tariff effects, with signs that inflation excluding the effects of tariffs may be continuing to make progress toward 2 percent. Some firms have indicated that they expect pass-through of pricing pressure from tariffs to pick up in the fourth quarter as the inventory of non-tariffed merchandise is depleted.
A reasonable base case is that tariffs result in a one-time shift in the price level, not an ongoing inflation problem. That view is reinforced by inflation expectations readings. Most measures of near-term inflation expectations have retraced their spring rise, and market-based long-term inflation expectations continue to be well anchored. Several factors will influence the size and persistence of the rise in inflation. Those include the final tariff rates that are implemented, the extent and timing of pass-through to consumer prices, the reaction of supply chains and domestic manufacturing, and overall economic conditions. I will continue to monitor these factors closely. I remain firmly committed to returning inflation to the Fed’s 2 percent target.
Monetary Policy
Given that outlook, I supported last month’s decision to reduce our policy rate by 1/4 percentage point. That step was appropriate because I see the balance of risks as having shifted in recent months as downside risks to employment have increased. The current policy stance is still somewhat restrictive, but we have moved it closer to its neutral level that neither restricts nor stimulates the economy. The evolving balance of risks underscores the need to proceed slowly as we approach the neutral rate.
At our past Federal Open Market Committee meeting, I also supported the decision to conclude the reduction of our aggregate securities holdings as of December 1. Over the course of balance sheet runoff that started in June 2022, we shrank our securities holdings by about $2.2 trillion. The Committee’s long-stated plan had been to stop balance sheet runoff when reserves were somewhat above the level judged as consistent with ample reserve conditions. Signs emerged ahead of the October meeting indicating that such a standard had been reached. In money markets, repurchase agreement (repo) rates moved up persistently relative to the interest on reserve balances (IORB) rate. In addition, more notable pressures on repo rates started to emerge on tax payment dates and on Treasury issuance days along with more frequent use of our standing repo facility. With repo rates trending up, the effective federal funds rate also began to move up steadily relative to the IORB rate. Those developments were what was expected to be seen as the size of the balance sheet declined and led me to support the decision to end runoff.
Starting in December, we intend to hold the size of our balance sheet steady for a time as reserve balances continue to decline passively even as other non-reserve liabilities, such as currency, rise. We will continue to allow agency securities to run off our balance sheet and will reinvest these proceeds in Treasury bills, furthering progress toward a portfolio consisting primarily of Treasury securities. Over the coming years, this reinvestment strategy will help move the weighted average maturity of our portfolio closer to that of the outstanding stock of Treasury securities.
I will also note that, heading into our next meeting, it remains unclear how much official data we will see before then. With respect to the path of the policy rate going forward, I will continue to determine policy based on the incoming data, the evolving outlook, and the balance of risks. I always take a meeting-by-meeting approach. This is an especially prudent approach at this time.
Thank you again to the Kansas City Fed for hosting me today. I look forward to our discussion.
1. The views expressed here are my own and are not necessarily those of my colleagues on the Federal Reserve Board or the Federal Open Market Committee. Return to text
(Reuters) -Amazon is looking to raise about $12 billion from the corporate bond market in its first such deal in U.S. dollars in about three years, Bloomberg News reported on Monday, citing people familiar with the matter.
The e-commerce giant filed for a six-part bond sale earlier in the day without disclosing a size, a regulatory filing showed.
Amazon did not immediately respond to a Reuters request for comment.
As artificial intelligence workloads grow in scale, big technology firms are turning to large-scale debt sales to fund expansion plans that cost tens of billions of dollars.
Last month, Meta Platforms announced its biggest bond sale of up to $30 billion, while cloud infrastructure and software maker Oracle is also reportedly looking to raise $15 billion in bond sales.
(Reporting by Harshita Mary Varghese in Bengaluru; Editing by Maju Samuel)