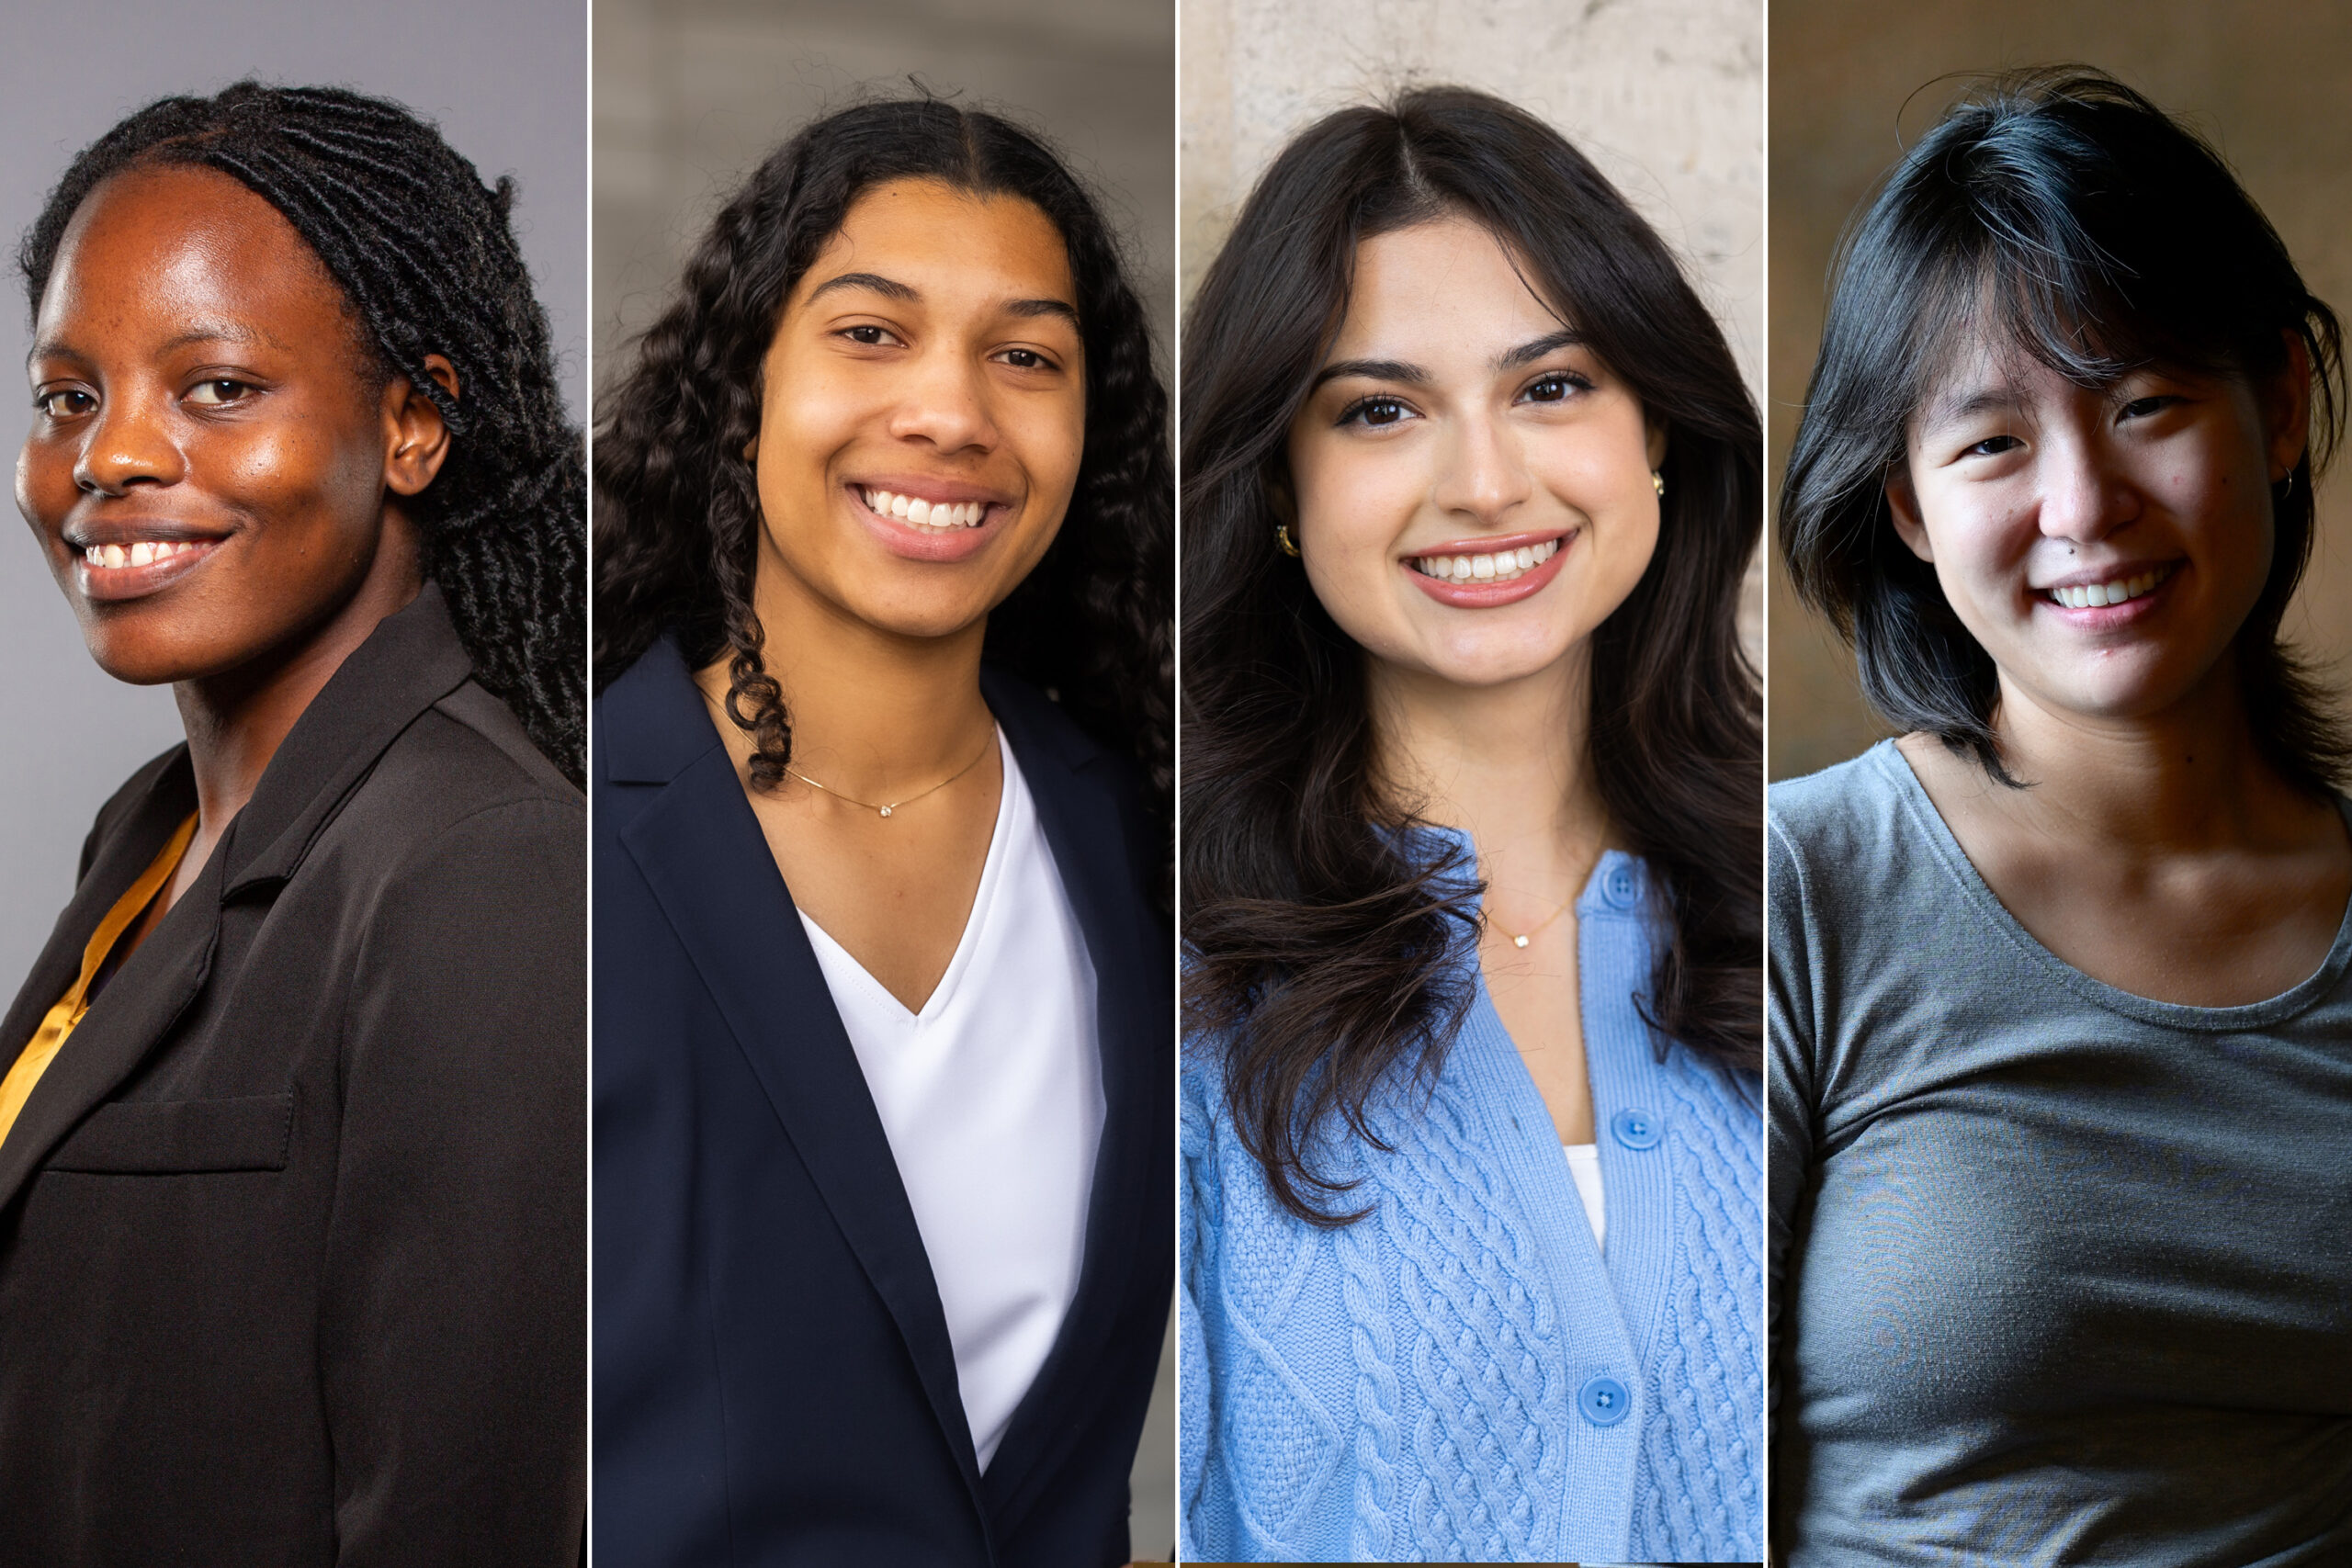
Category: 3. Business

  • Two Issues Open For Bidding This Week; PhysicsWallah Listing In Focus

    Two Issues Open For Bidding This Week; PhysicsWallah Listing In Focus

    The IPO rush has died down and only two new initial public offerings will hit the Dalal street in this week, while some existing IPOs will have their last day of subscription.

    Among the mainboard, only Excelsoft Technologies Ltd. IPO will open for subscription, while among the SMEs we will Gallard Steel Ltd. IPO making its debut.

    Besides this, Fujiyama Power Systems Ltd. will have its third and final day of subscription on Nov. 17. while Capillary Technologies Ltd.’s initial public offer will close on Nov. 18.

    Here are more details about the upcoming IPOs in this week:

    Continue Reading

  • Morgan Stanley Reaffirms Overweight Rating on Bank of America (BAC) After Investor Day

    Morgan Stanley Reaffirms Overweight Rating on Bank of America (BAC) After Investor Day

    Bank of America Corporation (NYSE:BAC) is included among the 15 Best Passive Income Stocks to Buy Right Now.

    Morgan Stanley Reaffirms Overweight Rating on Bank of America (BAC) After Investor Day

    Image by Alexsander-777 from Pixabay

    On November 7, Morga⁠n Stanl‌ey ke‌pt‍ its Overweight rating an‍d⁠ a $7‌0 price target on Bank of America Corporation (NYSE:BAC), according to a report by The Fly. T‌he firm also placed the bank a⁠mong its top picks in the large-cap banking group​ foll⁠owi​ng the company’s investor day. In its⁠ research note, the anal‌yst mentioned that man‌agement‌ laid ou⁠t a path towards a 16% to 18% return on tangib‍le common equity, support‌ed by steady rev⁠enue gro​wth and plans to bring⁠ the expen‌se r⁠atio d‍own to a range of 55% t⁠o⁠ 59%. The firm also po‌inted out that it sees the‌ bank enteri‌ng a s⁠tretch of consi‍stent operat‌in​g‌ leverage, which it bel⁠ieves should help Bank​ of America outp‌erform its⁠ peers.

    During‍ the inv‍estor day on November 5,‍ Chairman⁠ and CEO Bri‍an Moynihan highlighted that h‌e exp⁠ec‌ted earnings to grow at a​ stro⁠ng pace, with re‌turns rising accordingly⁠. In the Global Co⁠rporat‌e & Inves‍tment Banking‍ se⁠gment, the‍ bank aims to lift corporat‍e bankin‌g revenue‍ a⁠t a mid-sin‍gle-digit compound rate. Part of th‌at growth is e⁠xpected to c⁠ome from its⁠ overseas​ expansi‍on, where the company​ is t‌argeting ro‍ug⁠hly 20‍% growth in Latin America and around 40% in Europe, the Middle East, and⁠ Afri‍ca. The Global Investment Banking un‌it is working with similar mid-single-digit growth​ expectati‍ons.

    Bank of America Corporation (NYSE:BAC) ha‍s sp‌ent the past decad‍e expand‌ing its presence across the US. From 2014 thro⁠ugh 2024, it put more than $5 billi‌on into build⁠ing out financial centers and movi⁠n‍g into‌ n‍ew market‍s nation‌wide.

    Bank of America Corporation (NYSE:BAC) ra‌nks among the‍ lar‌ge‍st financia⁠l‍ in‌stitut⁠io‍ns in the country, offering a b⁠road range of banking, investment, and financial management services to in‌dividuals, small⁠ firms, and corporati⁠ons around the​ world.‍

    While we acknowledge the potential of BAC as an investment, we believe certain AI stocks offer greater upside potential and carry less downside risk. If you’re looking for an extremely undervalued AI stock that also stands to benefit significantly from Trump-era tariffs and the onshoring trend, see our free report on the best short-term AI stock.

    READ NEXT: 15 Extreme Dividend Stocks to Buy According to Hedge Funds and 15 Overlooked Dividend Stocks to Buy Right Now.

    Disclosure: None.

    Continue Reading

  • Wilmar International (SGX:F34) investors are sitting on a loss of 3.0% if they invested five years ago

    Wilmar International (SGX:F34) investors are sitting on a loss of 3.0% if they invested five years ago

    While it may not be enough for some shareholders, we think it is good to see the Wilmar International Limited (SGX:F34) share price up 14% in a single quarter. But if you look at the last five years the returns have not been good. You would have done a lot better buying an index fund, since the stock has dropped 22% in that half decade.

    So let’s have a look and see if the longer term performance of the company has been in line with the underlying business’ progress.

    AI is about to change healthcare. These 20 stocks are working on everything from early diagnostics to drug discovery. The best part – they are all under $10bn in marketcap – there is still time to get in early.

    There is no denying that markets are sometimes efficient, but prices do not always reflect underlying business performance. One way to examine how market sentiment has changed over time is to look at the interaction between a company’s share price and its earnings per share (EPS).

    During the five years over which the share price declined, Wilmar International’s earnings per share (EPS) dropped by 3.5% each year. Readers should note that the share price has fallen faster than the EPS, at a rate of 5% per year, over the period. So it seems the market was too confident about the business, in the past.

    You can see below how EPS has changed over time (discover the exact values by clicking on the image).

    SGX:F34 Earnings Per Share Growth November 16th 2025

    It’s probably worth noting we’ve seen significant insider buying in the last quarter, which we consider a positive. On the other hand, we think the revenue and earnings trends are much more meaningful measures of the business. Dive deeper into the earnings by checking this interactive graph of Wilmar International’s earnings, revenue and cash flow.

    As well as measuring the share price return, investors should also consider the total shareholder return (TSR). The TSR is a return calculation that accounts for the value of cash dividends (assuming that any dividend received was reinvested) and the calculated value of any discounted capital raisings and spin-offs. Arguably, the TSR gives a more comprehensive picture of the return generated by a stock. We note that for Wilmar International the TSR over the last 5 years was -3.0%, which is better than the share price return mentioned above. The dividends paid by the company have thusly boosted the total shareholder return.

    Wilmar International provided a TSR of 14% over the last twelve months. But that was short of the market average. On the bright side, that’s still a gain, and it is certainly better than the yearly loss of about 0.6% endured over half a decade. It could well be that the business is stabilizing. It’s always interesting to track share price performance over the longer term. But to understand Wilmar International better, we need to consider many other factors. For example, we’ve discovered 2 warning signs for Wilmar International (1 is significant!) that you should be aware of before investing here.

    Wilmar International is not the only stock insiders are buying. So take a peek at this free list of small cap companies at attractive valuations which insiders have been buying.

    Please note, the market returns quoted in this article reflect the market weighted average returns of stocks that currently trade on Singaporean exchanges.

    Have feedback on this article? Concerned about the content? Get in touch with us directly. Alternatively, email editorial-team (at) simplywallst.com.

    This article by Simply Wall St is general in nature. We provide commentary based on historical data and analyst forecasts only using an unbiased methodology and our articles are not intended to be financial advice. It does not constitute a recommendation to buy or sell any stock, and does not take account of your objectives, or your financial situation. We aim to bring you long-term focused analysis driven by fundamental data. Note that our analysis may not factor in the latest price-sensitive company announcements or qualitative material. Simply Wall St has no position in any stocks mentioned.

    Continue Reading

  • Japan Labor Productivity Up 0.2 Pct in FY 2024

    Japan Labor Productivity Up 0.2 Pct in FY 2024

    Economy

    Tokyo, Nov. 16 (Jiji Press)–Japanese labor productivity per worker in fiscal 2024, which ended in March this year, rose 0.2 pct from the previous year in inflation-adjusted real terms, up for four consecutive years, Japan Productivity Center data have shown.

    However, labor productivity “needs to increase more than 1 pct” to ensure that real wages keep rising by 1 pct as envisioned in a government target, an analyst at the think tank said.

    Labor productivity, or the amount of added value created by labor, improved in the sectors of transport and postal services, finance and insurance, and information and communications.

    The improvement reflected streamlining measures related to work style reform, automation in major logistics centers and the increasing use of self-checkout machines.

    Yasuhiro Kiuchi, senior principal researcher of the center, sees potential for growth in the learning-support service industry.

    [Copyright The Jiji Press, Ltd.]

    Jiji Press

    Continue Reading

  • Westlake (WLK): Evaluating Valuation Following Major Debt Refinancing and Capital Structure Shift

    Westlake (WLK): Evaluating Valuation Following Major Debt Refinancing and Capital Structure Shift

    Westlake (WLK) has just wrapped up a key refinancing move by issuing two sizable senior unsecured notes and repurchasing a meaningful chunk of its 3.6% Senior Notes due 2026. This step is designed to strengthen its debt maturity profile and optimize capital structure.

    See our latest analysis for Westlake.

    Despite Westlake’s efforts to shore up its balance sheet, most recently with major refinancing actions and a steady dividend, the market’s been cautious, reflecting in a 1-year total shareholder return of -49.5%. The stock’s momentum has faded considerably in recent months, with the share price closing at $62.56 after sliding more than 19% over the last month alone.

    If you want to see what else is trending and spot potential opportunities beyond the obvious names, now’s a perfect time to broaden your perspective and discover fast growing stocks with high insider ownership

    But with Westlake’s price still hovering well below analyst targets and recent financial moves fresh in mind, should investors see an undervalued opportunity? Or is the market already factoring in all the company’s future growth potential?

    Most Popular Narrative: 23.9% Undervalued

    With analyst consensus suggesting Westlake’s fair value is well above its current share price, the narrative paints a picture of notable upside, hinging on underlying structural trends and strategic changes. Let’s hear a key perspective that could be driving this outlook.

    The multi-year increase in municipal infrastructure spending in the U.S., fueled by the Infrastructure Act and ongoing underspend in water infrastructure, is structurally supporting long-term demand for Westlake’s HIP (Housing and Infrastructure Products) segment, particularly for PVC pipes and fittings, creating a reliable revenue and volume growth driver unaffected by near-term housing volatility.

    Read the complete narrative.

    Curious how these ambitious projections for long-term growth translate into that aggressive fair value? One of the narrative’s biggest surprises is how it relies on sharply higher future profit margins and analysts’ confidence that current pressures will reverse. Want to know the kind of growth assumptions that underpin those targets? The full narrative breaks down the bold call in detail.

    Result: Fair Value of $82.21 (UNDERVALUED)

    Have a read of the narrative in full and understand what’s behind the forecasts.

    However, ongoing global chemical oversupply and volatile raw material costs could undermine Westlake’s earnings recovery and threaten progress on margin resilience.

    Find out about the key risks to this Westlake narrative.

    Another View: Sizing Up Value with Multiples

    While the fair value estimate points to upside, looking at Westlake’s price-to-sales ratio tells a more nuanced story. Trading at 0.7 times sales puts it above the peer average of 0.5, but still below the US Chemicals industry average of 1.2, and just a shade under its fair ratio of 0.8. That small discount hints at limited margin for error, so is there really as much value here as the consensus suggests?

    See what the numbers say about this price — find out in our valuation breakdown.

    NYSE:WLK PS Ratio as at Nov 2025

    Build Your Own Westlake Narrative

    If you want a different angle or prefer digging into the numbers yourself, you can create your own Westlake narrative in just a few minutes. Do it your way

    A great starting point for your Westlake research is our analysis highlighting 3 key rewards and 1 important warning sign that could impact your investment decision.

    Looking for more investment ideas?

    Smart investors never limit themselves to just one company. Expand your horizons and get ahead with hand-picked stock ideas from the Simply Wall Street Screener before the next big opportunity passes you by.

    This article by Simply Wall St is general in nature. We provide commentary based on historical data
    and analyst forecasts only using an unbiased methodology and our articles are not intended to be financial advice.
    It does not constitute a recommendation to buy or sell any stock, and does not take account of your objectives, or your
    financial situation. We aim to bring you long-term focused analysis driven by fundamental data.
    Note that our analysis may not factor in the latest price-sensitive company announcements or qualitative material.
    Simply Wall St has no position in any stocks mentioned.

    Valuation is complex, but we’re here to simplify it.

    Discover if Westlake might be undervalued or overvalued with our detailed analysis, featuring fair value estimates, potential risks, dividends, insider trades, and its financial condition.

    Access Free Analysis

    Have feedback on this article? Concerned about the content? Get in touch with us directly. Alternatively, email editorial-team@simplywallst.com

    Continue Reading

  • How Investors May Respond To Oruka Therapeutics (ORKA) Positive Phase 1 Data and Expanded Funding Efforts

    How Investors May Respond To Oruka Therapeutics (ORKA) Positive Phase 1 Data and Expanded Funding Efforts

    • Oruka Therapeutics recently reported third quarter 2025 results, noting a net loss of US$30.28 million and closed a substantial shelf registration of approximately US$756 million for common stock.
    • Positive interim Phase 1 results for ORKA-001 in psoriasis, together with US$180 million in PIPE financing, have strengthened Oruka’s ability to advance multiple clinical trials and extend its cash runway past key milestones.
    • We’ll explore how encouraging Phase 1 efficacy data for ORKA-001 underpins a shifting investment narrative for Oruka Therapeutics.

    Trump’s oil boom is here – pipelines are primed to profit. Discover the 22 US stocks riding the wave.

    What Is Oruka Therapeutics’ Investment Narrative?

    For those looking at Oruka Therapeutics, the investment story hinges on belief in the company’s targeted therapies for autoimmune and inflammatory diseases. The positive interim Phase 1 results for ORKA-001 have set a new tone for the short-term, with efficacy signals and an extended dosing window potentially giving Oruka an edge if these results hold up in Phase 2 trials. Coupled with the recent US$180 million PIPE financing and the US$756 million shelf registration, there’s fresh confidence that Oruka’s cash position is strong enough to see it through upcoming clinical milestones. However, the business is still running at a loss with no revenue and a young management team, so any setback in clinical progress or further dilution could quickly re-focus attention on risk rather than opportunity. The news flow gives investors new reasons for optimism, but it also sharpens the spotlight on execution in the next year.

    But, if management’s short tenure raises questions, investors should weigh the implications for continuity and focus.

    In light of our recent valuation report, it seems possible that Oruka Therapeutics is trading beyond its estimated value.

    Exploring Other Perspectives

    ORKA Earnings & Revenue Growth as at Nov 2025

    You’ll find two fair value estimates from the Simply Wall St Community for Oruka, ranging from US$4.62 to US$46.20. Community members are weighing high clinical hopes against ongoing losses and frequent capital raisings, and their valuation views reflect these sharply different outlooks. Consider how these opinions and emerging risks could impact the company’s journey.

    Explore 2 other fair value estimates on Oruka Therapeutics – why the stock might be worth less than half the current price!

    Build Your Own Oruka Therapeutics Narrative

    Disagree with this assessment? Create your own narrative in under 3 minutes – extraordinary investment returns rarely come from following the herd.

    • A great starting point for your Oruka Therapeutics research is our analysis highlighting 5 important warning signs that could impact your investment decision.
    • Our free Oruka Therapeutics research report provides a comprehensive fundamental analysis summarized in a single visual – the Snowflake – making it easy to evaluate Oruka Therapeutics’ overall financial health at a glance.

    Contemplating Other Strategies?

    The market won’t wait. These fast-moving stocks are hot now. Grab the list before they run:

    This article by Simply Wall St is general in nature. We provide commentary based on historical data
    and analyst forecasts only using an unbiased methodology and our articles are not intended to be financial advice.
    It does not constitute a recommendation to buy or sell any stock, and does not take account of your objectives, or your
    financial situation. We aim to bring you long-term focused analysis driven by fundamental data.
    Note that our analysis may not factor in the latest price-sensitive company announcements or qualitative material.
    Simply Wall St has no position in any stocks mentioned.

    New: AI Stock Screener & Alerts

    Our new AI Stock Screener scans the market every day to uncover opportunities.

    • Dividend Powerhouses (3%+ Yield)
    • Undervalued Small Caps with Insider Buying
    • High growth Tech and AI Companies

    Or build your own from over 50 metrics.

    Explore Now for Free

    Have feedback on this article? Concerned about the content? Get in touch with us directly. Alternatively, email editorial-team@simplywallst.com

    Continue Reading

  • What Chevron (CVX)’s AI Power Expansion and Buyback Surge Mean for Shareholders

    What Chevron (CVX)’s AI Power Expansion and Buyback Surge Mean for Shareholders

    • At its recent Investor Day, Chevron unveiled a long-term roadmap targeting more than 10% annual free cash flow growth, US$10–20 billion in annual share buybacks through 2030, and entry into supplying natural gas-fired power for AI data centers, with its first project set for West Texas by 2027.
    • This marks a significant push by Chevron to build shareholder value while diversifying into new energy segments aligned with accelerating demand for data center power fueled by AI adoption.
    • We’ll explore how Chevron’s ambitious stock buyback plan and expansion into AI-driven energy solutions may alter its investment outlook.

    These 13 companies survived and thrived after COVID and have the right ingredients to survive Trump’s tariffs. Discover why before your portfolio feels the trade war pinch.

    Chevron Investment Narrative Recap

    To be a Chevron shareholder, you need confidence in the company’s ability to sustain oil and gas cash flows amid the energy transition and capitalize on production growth and efficiency gains as outlined in its 2030 roadmap. The recent announcement of leadership changes in Chevron’s finance team, notably the appointment of Amit R. Ghai as Controller effective March 2026, is unlikely to materially affect the company’s near-term catalysts, namely, integration of the Hess acquisition and execution on cost reductions, or meaningfully shift its largest risk, long-term oil demand pressure and slow diversification.

    Among recent milestones, Chevron’s outlined share buyback target of US$10–20 billion per year to 2030 stands out. This ambitious capital return plan is most relevant when assessing the company’s ability to deliver against its free cash flow growth targets and maintain high shareholder returns, especially as it addresses the evolving energy mix.
    Despite these strengths, investors should also be aware that unlike revenue growth, Chevron’s relative lack of rapid diversification leaves it exposed if…

    Read the full narrative on Chevron (it’s free!)

    Chevron’s outlook anticipates $196.0 billion in revenue and $21.8 billion in earnings by 2028. This scenario depends on a 1.2% annual revenue growth rate and a $8.1 billion increase in earnings from the current $13.7 billion.

    Uncover how Chevron’s forecasts yield a $172.04 fair value, a 9% upside to its current price.

    Exploring Other Perspectives

    CVX Community Fair Values as at Nov 2025

    Simply Wall St Community members offered 27 individual fair value estimates for Chevron, spanning US$125.69 to US$325.49 per share. While many anticipate production growth and cost reductions, opinions can differ widely, consider how slow movement into renewables may shape Chevron’s long-term resilience.

    Explore 27 other fair value estimates on Chevron – why the stock might be worth 20% less than the current price!

    Build Your Own Chevron Narrative

    Disagree with existing narratives? Create your own in under 3 minutes – extraordinary investment returns rarely come from following the herd.

    Seeking Other Investments?

    Every day counts. These free picks are already gaining attention. See them before the crowd does:

    This article by Simply Wall St is general in nature. We provide commentary based on historical data
    and analyst forecasts only using an unbiased methodology and our articles are not intended to be financial advice.
    It does not constitute a recommendation to buy or sell any stock, and does not take account of your objectives, or your
    financial situation. We aim to bring you long-term focused analysis driven by fundamental data.
    Note that our analysis may not factor in the latest price-sensitive company announcements or qualitative material.
    Simply Wall St has no position in any stocks mentioned.

    New: AI Stock Screener & Alerts

    Our new AI Stock Screener scans the market every day to uncover opportunities.

    • Dividend Powerhouses (3%+ Yield)
    • Undervalued Small Caps with Insider Buying
    • High growth Tech and AI Companies

    Or build your own from over 50 metrics.

    Explore Now for Free

    Have feedback on this article? Concerned about the content? Get in touch with us directly. Alternatively, email editorial-team@simplywallst.com

    Continue Reading

  • The Trend Of High Returns At Kencana Agri (SGX:BNE) Has Us Very Interested

    The Trend Of High Returns At Kencana Agri (SGX:BNE) Has Us Very Interested

    If you’re looking for a multi-bagger, there’s a few things to keep an eye out for. Firstly, we’d want to identify a growing return on capital employed (ROCE) and then alongside that, an ever-increasing base of capital employed. Put simply, these types of businesses are compounding machines, meaning they are continually reinvesting their earnings at ever-higher rates of return. So when we looked at the ROCE trend of Kencana Agri (SGX:BNE) we really liked what we saw.

    This technology could replace computers: discover the 20 stocks are working to make quantum computing a reality.

    For those who don’t know, ROCE is a measure of a company’s yearly pre-tax profit (its return), relative to the capital employed in the business. Analysts use this formula to calculate it for Kencana Agri:

    Return on Capital Employed = Earnings Before Interest and Tax (EBIT) ÷ (Total Assets – Current Liabilities)

    0.24 = US$46m ÷ (US$290m – US$96m) (Based on the trailing twelve months to June 2025).

    So, Kencana Agri has an ROCE of 24%. In absolute terms that’s a great return and it’s even better than the Food industry average of 13%.

    View our latest analysis for Kencana Agri

    SGX:BNE Return on Capital Employed November 16th 2025

    Above you can see how the current ROCE for Kencana Agri compares to its prior returns on capital, but there’s only so much you can tell from the past. If you’re interested, you can view the analysts predictions in our free analyst report for Kencana Agri .

    Kencana Agri is showing promise given that its ROCE is trending up and to the right. The figures show that over the last five years, ROCE has grown 107% whilst employing roughly the same amount of capital. So our take on this is that the business has increased efficiencies to generate these higher returns, all the while not needing to make any additional investments. On that front, things are looking good so it’s worth exploring what management has said about growth plans going forward.

    As discussed above, Kencana Agri appears to be getting more proficient at generating returns since capital employed has remained flat but earnings (before interest and tax) are up. And with the stock having performed exceptionally well over the last five years, these patterns are being accounted for by investors. With that being said, we still think the promising fundamentals mean the company deserves some further due diligence.

    Kencana Agri does come with some risks though, we found 3 warning signs in our investment analysis, and 1 of those is a bit concerning…

    High returns are a key ingredient to strong performance, so check out our free list ofstocks earning high returns on equity with solid balance sheets.

    Have feedback on this article? Concerned about the content? Get in touch with us directly. Alternatively, email editorial-team (at) simplywallst.com.

    This article by Simply Wall St is general in nature. We provide commentary based on historical data and analyst forecasts only using an unbiased methodology and our articles are not intended to be financial advice. It does not constitute a recommendation to buy or sell any stock, and does not take account of your objectives, or your financial situation. We aim to bring you long-term focused analysis driven by fundamental data. Note that our analysis may not factor in the latest price-sensitive company announcements or qualitative material. Simply Wall St has no position in any stocks mentioned.

    Continue Reading

  • A Look at Reinsurance Group of America’s Valuation Following New Mortality Projections from GLP-1 Study

    A Look at Reinsurance Group of America’s Valuation Following New Mortality Projections from GLP-1 Study

    Reinsurance Group of America (RGA) has captured investor interest after publishing its latest study estimating a 3.5% reduction in US mortality by 2045, attributed to widespread adoption of GLP-1 medications. This analysis offers fresh insight on long-term health trends shaping the insurance sector.

    See our latest analysis for Reinsurance Group of America.

    RGA’s fresh research on GLP-1 medications comes after their newly opened office in Midtown Manhattan, signaling both strategic growth and a strong operational presence. While the past year has brought a -17.1% total shareholder return, the stock has still delivered an impressive 82.9% total return over five years. This suggests that long-term momentum remains intact even if recent price action has softened.

    If you’re interested in what’s working for other insurance and financials leaders, it’s the perfect time to check out fast growing stocks with high insider ownership.

    With RGA’s long-term performance outpacing recent setbacks and its shares trading at a notable discount to analyst price targets, the key question is whether investors are overlooking future upside or if potential growth is already reflected in the current price.

    The most closely followed narrative now sets fair value for Reinsurance Group of America at $236.89, well ahead of the last closing price of $188.71. The current fair value points to a significant gap in expectations, and sharp focus falls on what is driving confidence behind this premium.

    The company’s leadership in digital underwriting solutions and customized reinsurance products, bolstered by data analytics and exclusive arrangements, enhances efficiency and pricing power, which is likely to improve net margins and generate higher earnings as these tech-enabled capabilities scale.

    Read the complete narrative.

    What secret sauce does this popular narrative see in RGA’s fundamentals? There is a quantum leap projected in profits, with digital and global expansion fueling surging margins. Want to know which assumptions are pushing its value to new highs? Uncover the blockbuster growth projections and hidden catalysts driving this valuation surprise.

    Result: Fair Value of $236.89 (UNDERVALUED)

    Have a read of the narrative in full and understand what’s behind the forecasts.

    However, persistent volatility in U.S. life claims and rising healthcare costs could temper RGA’s projected earnings momentum, which may challenge consensus expectations.

    Find out about the key risks to this Reinsurance Group of America narrative.

    If you want to see the numbers for yourself and shape your own view, you can build your personal narrative in just a few minutes. Do it your way.

    A good starting point is our analysis highlighting 5 key rewards investors are optimistic about regarding Reinsurance Group of America.

    Don’t wait on the sidelines while fresh opportunities pass by. Use the Simply Wall Street Screener to pinpoint investments with real upside potential and unique growth stories.

    This article by Simply Wall St is general in nature. We provide commentary based on historical data and analyst forecasts only using an unbiased methodology and our articles are not intended to be financial advice. It does not constitute a recommendation to buy or sell any stock, and does not take account of your objectives, or your financial situation. We aim to bring you long-term focused analysis driven by fundamental data. Note that our analysis may not factor in the latest price-sensitive company announcements or qualitative material. Simply Wall St has no position in any stocks mentioned.

    Companies discussed in this article include RGA.

    Have feedback on this article? Concerned about the content? Get in touch with us directly. Alternatively, email editorial-team@simplywallst.com

    Continue Reading

  • IFCA MSC Berhad (KLSE:IFCAMSC) Might Have The Makings Of A Multi-Bagger

    IFCA MSC Berhad (KLSE:IFCAMSC) Might Have The Makings Of A Multi-Bagger

    What are the early trends we should look for to identify a stock that could multiply in value over the long term? Typically, we’ll want to notice a trend of growing return on capital employed (ROCE) and alongside that, an expanding base of capital employed. Ultimately, this demonstrates that it’s a business that is reinvesting profits at increasing rates of return. So on that note, IFCA MSC Berhad (KLSE:IFCAMSC) looks quite promising in regards to its trends of return on capital.

    This technology could replace computers: discover the 20 stocks are working to make quantum computing a reality.

    If you haven’t worked with ROCE before, it measures the ‘return’ (pre-tax profit) a company generates from capital employed in its business. The formula for this calculation on IFCA MSC Berhad is:

    Return on Capital Employed = Earnings Before Interest and Tax (EBIT) ÷ (Total Assets – Current Liabilities)

    0.14 = RM18m ÷ (RM154m – RM30m) (Based on the trailing twelve months to June 2025).

    Thus, IFCA MSC Berhad has an ROCE of 14%. That’s a relatively normal return on capital, and it’s around the 13% generated by the Software industry.

    View our latest analysis for IFCA MSC Berhad

    KLSE:IFCAMSC Return on Capital Employed November 16th 2025

    Historical performance is a great place to start when researching a stock so above you can see the gauge for IFCA MSC Berhad’s ROCE against it’s prior returns. If you want to delve into the historical earnings , check out these free graphs detailing revenue and cash flow performance of IFCA MSC Berhad.

    IFCA MSC Berhad’s ROCE growth is quite impressive. Looking at the data, we can see that even though capital employed in the business has remained relatively flat, the ROCE generated has risen by 5,779% over the last five years. So our take on this is that the business has increased efficiencies to generate these higher returns, all the while not needing to make any additional investments. The company is doing well in that sense, and it’s worth investigating what the management team has planned for long term growth prospects.

    To bring it all together, IFCA MSC Berhad has done well to increase the returns it’s generating from its capital employed. And since the stock has fallen 21% over the last five years, there might be an opportunity here. That being the case, research into the company’s current valuation metrics and future prospects seems fitting.

    One more thing, we’ve spotted 3 warning signs facing IFCA MSC Berhad that you might find interesting.

    If you want to search for solid companies with great earnings, check out this free list of companies with good balance sheets and impressive returns on equity.

    Have feedback on this article? Concerned about the content? Get in touch with us directly. Alternatively, email editorial-team (at) simplywallst.com.

    This article by Simply Wall St is general in nature. We provide commentary based on historical data and analyst forecasts only using an unbiased methodology and our articles are not intended to be financial advice. It does not constitute a recommendation to buy or sell any stock, and does not take account of your objectives, or your financial situation. We aim to bring you long-term focused analysis driven by fundamental data. Note that our analysis may not factor in the latest price-sensitive company announcements or qualitative material. Simply Wall St has no position in any stocks mentioned.

    Continue Reading