February 10, 2026
NTT DATA, Inc.
DUBAI – 10 February 2026 – NTT DATA, a global leader in AI, digital business and technology services, has acquired Zero&One, the first homegrown Amazon Web Services (AWS) Premier Tier Services Partner in the Middle East and North Africa (MENA). The acquisition significantly strengthens NTT DATA’s cloud capabilities and positions it to tap into the rapidly expanding Middle East cloud services market.
Founded in 2017 and headquartered in Dubai, Zero&One is a leading regional cloud consultancy. The company holds nine AWS competencies and was the first in the MENA to achieve AWS Generative AI Competency. In 2025, Zero&One was named AWS’s MENA Consulting Partner of the Year and received the Rising Star Partner of the Year and Design Partner of the Year awards at the EMEA level.
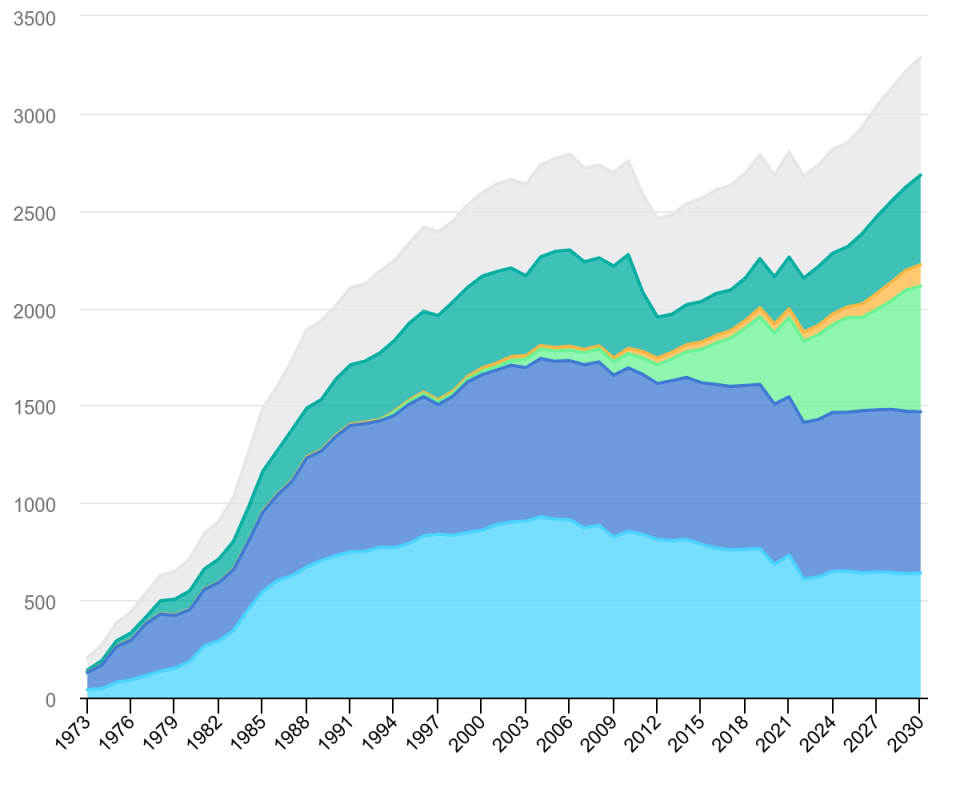
The acquisition supports NTT DATA’s regional growth ambitions as the Middle East cloud market enters a period of significant growth, e.g. Saudi Arabia’s cloud services market was valued at $4.77 billion last year and is expected to more than double by the early 2030s, with AWS set to open its first data center there in 2026.
“This acquisition enables us to deliver high-impact solutions and enhance the value we bring to organizations in the Middle East. Zero&One’s expertise strengthens our ability to deliver the speed, scale and technical depth clients need in today’s cloud-first environment,” said Burcak Soydan, Managing Director for the Middle East at NTT DATA.
“Joining NTT DATA is the natural next step in our growth journey,” said Ali El Kontar, CEO of Zero&One. “We’ve built our reputation on delivering world-class cloud expertise to organizations across the Middle East. As part of NTT DATA, we can now combine our regional knowledge and AWS specialization with global resources, expanded service offerings and the ability to support clients on an even larger scale. Our teams share a commitment to innovation and client success, making this an ideal partnership”
The acquisition enables NTT DATA to offer comprehensive cloud services to Middle East and African clients, including cloud migration, application modernization, cloud-native development, data analytics and AI solutions.
About NTT DATA
NTT DATA is a $30+ billion business and technology services leader, serving 75% of the Fortune Global 100. We are committed to accelerating client success and positively impacting society through responsible innovation. We are one of the world’s leading AI and digital infrastructure providers, with unmatched capabilities in enterprise-scale AI, cloud, security, connectivity, data centers and application services. Our consulting and industry solutions help organizations and society move confidently and sustainably into the digital future. As a Global Top Employer, we have experts in more than 70 countries. We also offer clients access to a robust ecosystem of innovation centers as well as established and start-up partners. NTT DATA is part of NTT Group, which invests over $3 billion each year in R&D.
Visit us at nttdata.com
About Zero&One
Zero&One is the first homegrown AWS Premier Tier Services Partner in the MENA region, specializing in cloud-native services and solutions including application modernization, cloud operations, AI and machine learning and data analytics. Founded in 2017 and headquartered in Dubai, the company serves clients across multiple industries including financial services, retail, media and entertainment, healthcare and government. Zero&One holds nine AWS competencies and was the first in MENA to achieve AWS Generative AI Competency. For more information, visit www.zeroandone.me