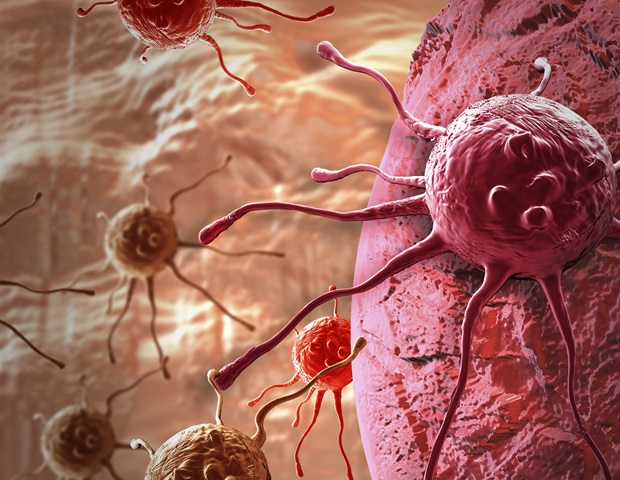
SYDNEY, Feb. 4 (Xinhua) — Scientists in Australia have mapped the “neighborhoods” of lung cancer cells and found that cell metabolism plays a key role in determining how patients respond to immunotherapy.
Researchers from the University of…
SYDNEY, Feb. 4 (Xinhua) — Scientists in Australia have mapped the “neighborhoods” of lung cancer cells and found that cell metabolism plays a key role in determining how patients respond to immunotherapy.
Researchers from the University of…

In a city obsessed with efficiency, optimisation and results, walking has rarely been focused on as a health intervention. Yet across Hong Kong, a quiet reframing is taking place. Increasingly, it is being described not as light exercise or…
A multidisciplinary team of University of Cincinnati Cancer Center researchers has received a $40,000 Ride Cincinnati grant to study a delayed release preparation, or wafer, of an immunostimulatory molecule to stimulate the central…

Supplementing the guts of older mice with poop from younger ones has revealed the key role microbes play in intestinal stem cell function.
After receiving a fecal microbiota transplant from younger mice, one aspect of age-related decline in…

The Pan American Health Organization (PAHO) has released a new clinical booklet aimed at strengthening tobacco and nicotine cessation services in primary health care, as countries in the Americas face shifting consumption patterns, rising chronic…

Infants given acetaminophen (also called paracetamol; brand name, Tylenol) for pain or fever relief in their first year were no more likely to develop eczema or bronchiolitis by age 1 than those given ibuprofen (eg, Advil), according to a…
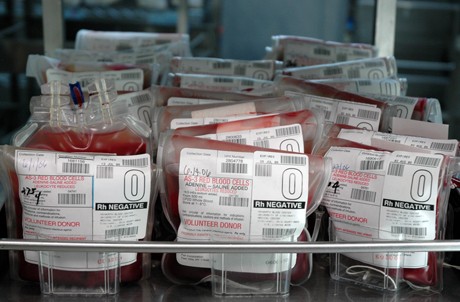
All blood donations undergo extensive testing to screen for infections and ensure safety for the recipient. Deferrals and pre-screening help protect both donors and recipients before this step. If a donation tests positive for an infection,…

Experiencing multiple acute stresses at the same time, as in natural disasters or mass shootings, can leave lasting memory scars. New research from the University of California, Irvine suggests that levels of estrogen in the brain…