Worldwide (Vax-Before-Travel News)
In a stark reminder that the fight against polio is far from over, several countries reported new cases of the crippling disease in 2026, according to the latest update from the Global Polio Eradication…
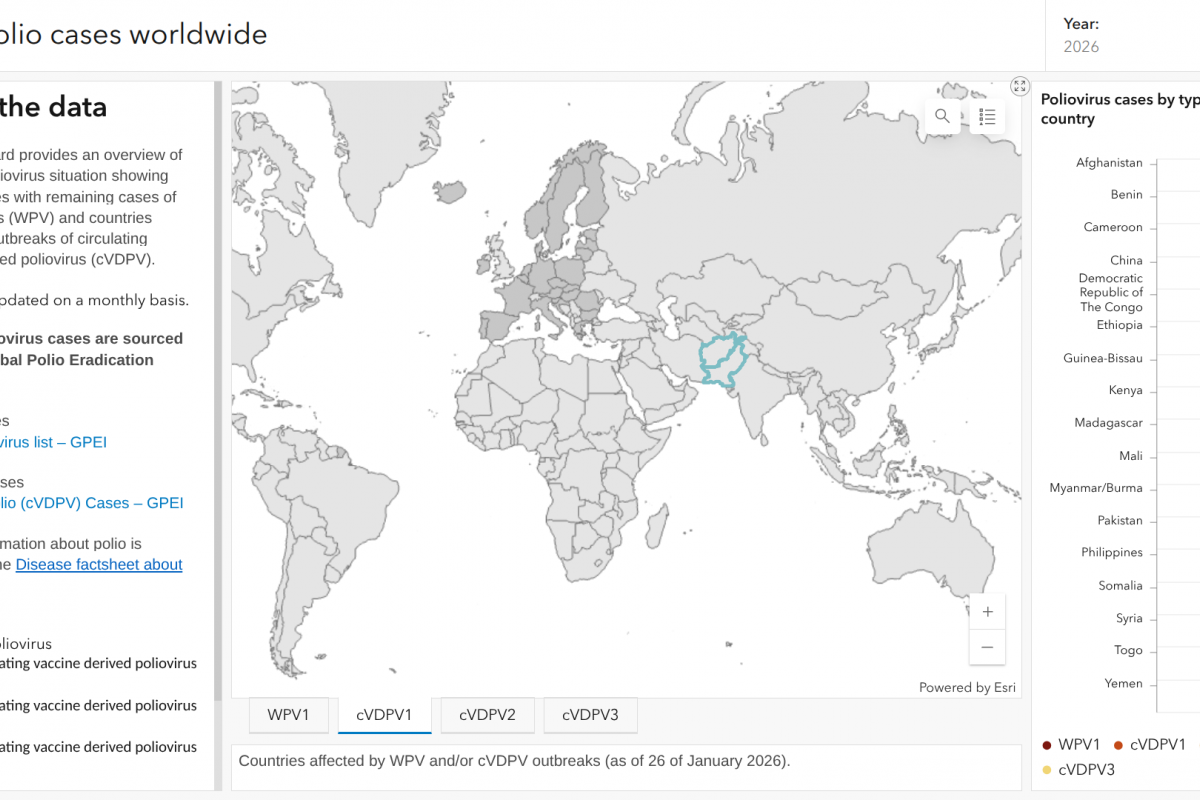
In a stark reminder that the fight against polio is far from over, several countries reported new cases of the crippling disease in 2026, according to the latest update from the Global Polio Eradication…
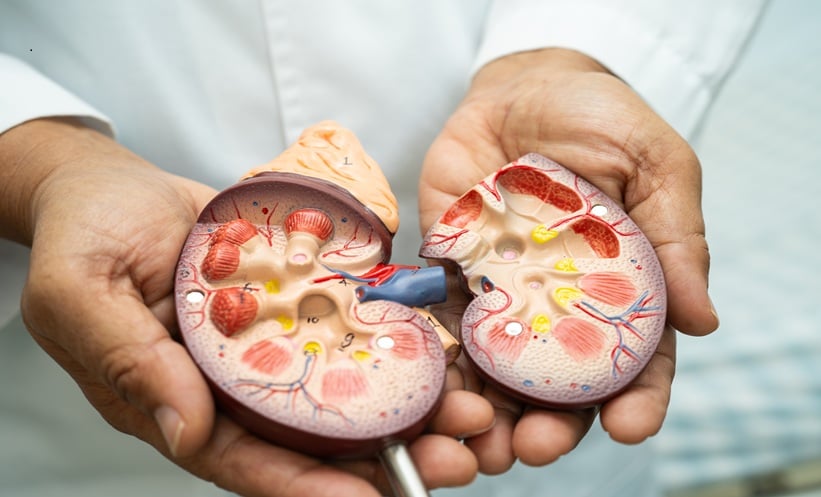
INITIATING treatment with sodium–glucose cotransporter-2 inhibitors (SGLT2i) is associated with improved kidney outcomes compared with glucagon-like peptide-1 receptor agonists (GLP-1RA) in…

People suffering from depression demonstrate strength in dealing with their illness on a daily basis, but this is often not perceived as such. Previous studies have shown that instead, they often encounter a contrary narrative in…

A recent international research project has used advanced microscopy techniques and computational modeling to discover why virus infection changes the nuclear structures and biomechanical forces affecting the nucleus.
Researchers at…
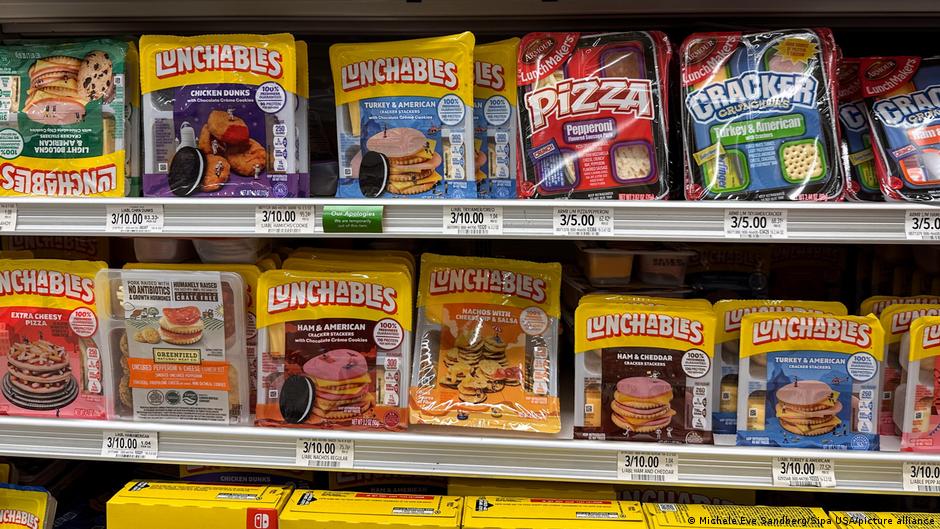
A study by researchers at three United States universities claims to have identified similarities between the addictive characteristics of ultra-processed foods (UPFs) and cigarettes, and has recommended similar levels of regulation.
According…

Scientific experts are calling on employers who use diesel powered plant, equipment and vehicles to ensure that they understand the best way of controlling emissions or obtain expert competent advice to assist them.
“Diesel engines power…

Scientists have discovered a hidden communication system inside bacteria that allows them to share genetic information and develop resistance to multiple antibiotics.

Biologists have identified a previously unknown mode of…

Emerging research in plant-based food and environmental health encourages people to consume less meat and fish. Researchers also highlight this diet’s benefits for lowering communicable disease risks.
Nutrition Insight examines findings…