A new study has found that as little as 10 minutes of daily exercise may help slow the growth of bowel cancer while also repairing damage to DNA.
Researchers at Newcastle University discovered that even a short…

A new study has found that as little as 10 minutes of daily exercise may help slow the growth of bowel cancer while also repairing damage to DNA.
Researchers at Newcastle University discovered that even a short…
It was just a scratch. Among all the feelings and thoughts that she has had to wrestle with since the summer, disbelief is the emotion that Robyn Thomson still struggles with the most. “You never think it would happen to you,” said Robyn….
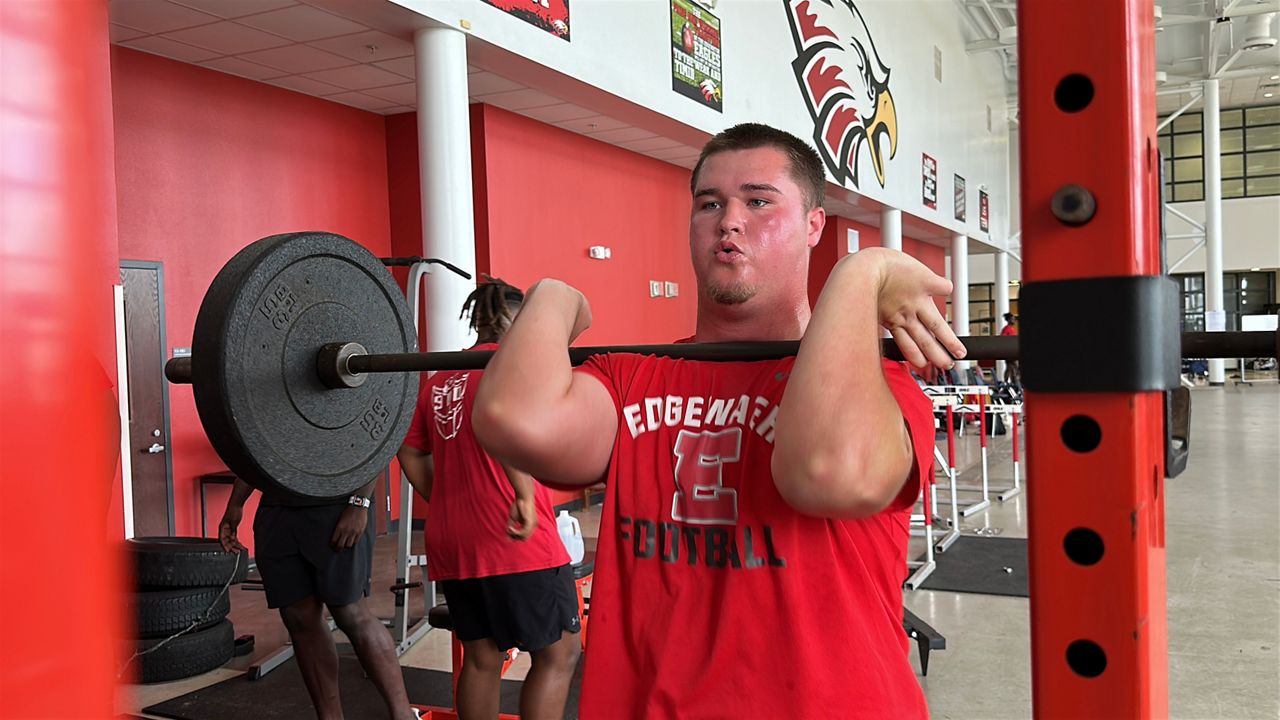
ORANGE COUNTY, Fla. — With Orange County seeing an uptick in Legionnaires’ disease cases, an infectious disease expert is sharing how gym goers can avoid getting infected.
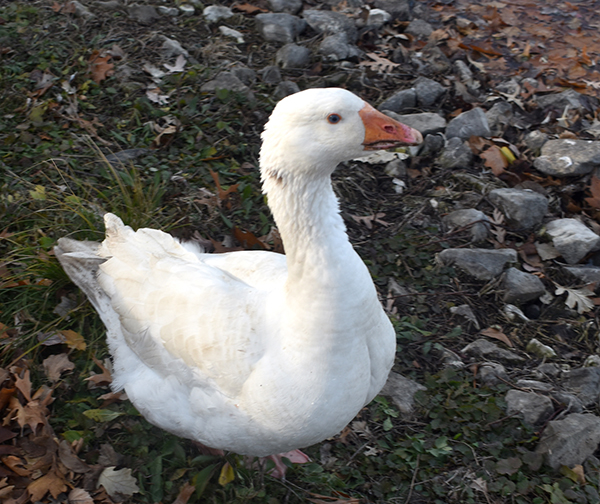
T-R FILE PHOTO
Scout prepares to get on the water upon her November arrival at Riverside Cemetery. Serving as a new companion for fellow goose Frankie, Scout was found dead last Sunday and has…
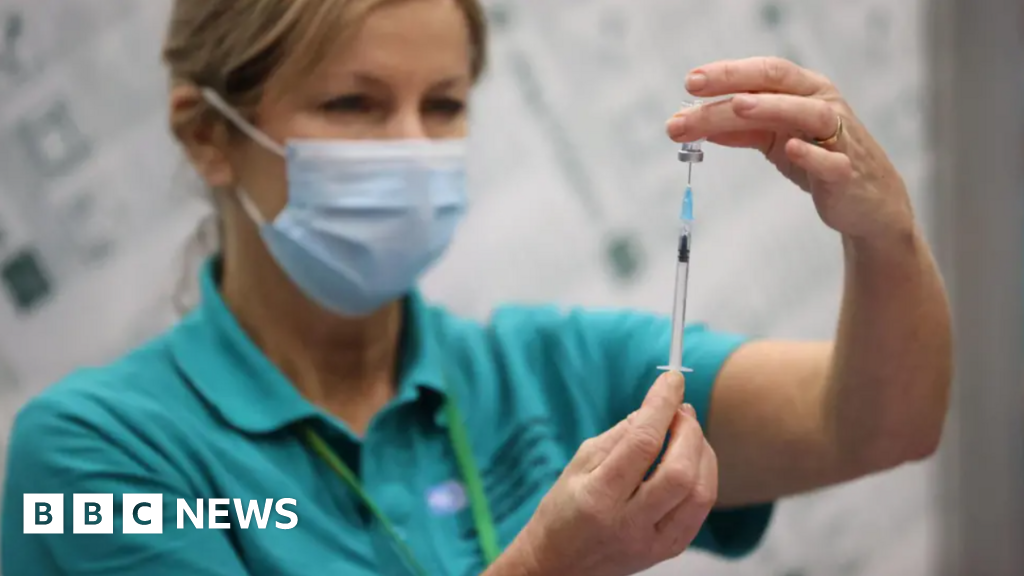
Children in the South West can now get what has been described as a “historic” free vaccination against chickenpox from the NHS, health bosses say.
The Joint Committee on Vaccination and Immunisation, which advises UK health departments,…

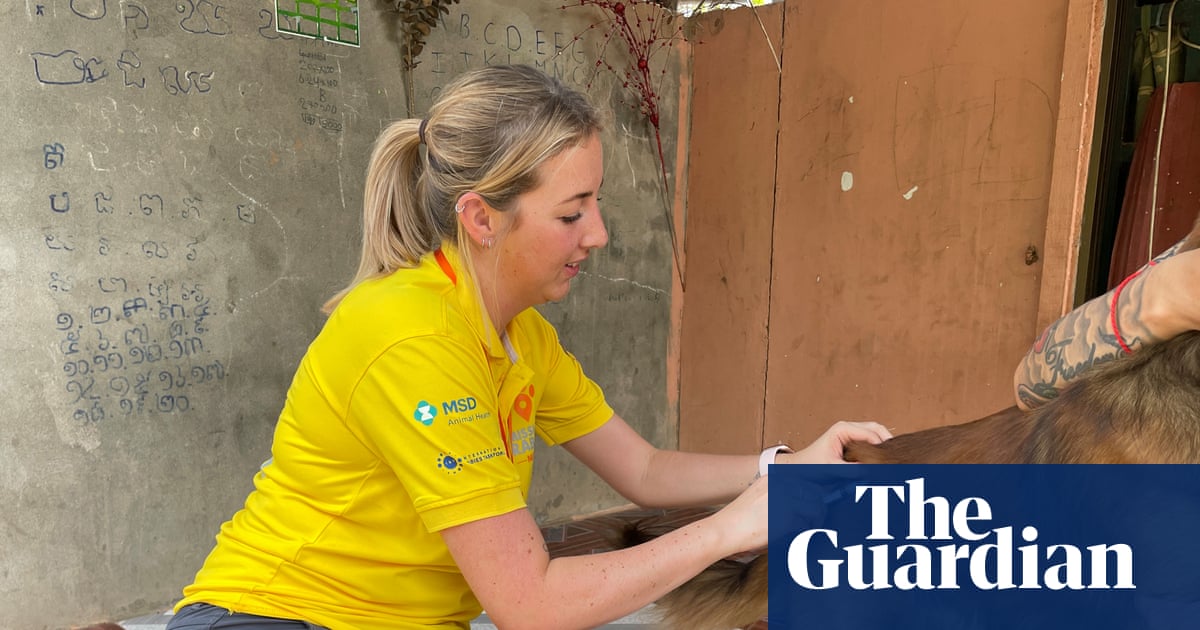
The problem with vaccines is they need to be refrigerated. In some of the more remote clinics, without easy road access or reliable power supplies, they are vulnerable, especially if there are issues with the on site fridges.
If the power fails…

In parts of Africa almost a quarter of vaccine doses are thrown away because they have not been stored at the right temperature.
Research from the University of Birmingham suggests delivery by drone could stop this.
In Rwanda, commercial drone…

For decades, nutrition experts and health officials have warned against eating too much saturated fat.
Red meat, full-fat dairy products, fried foods and other big sources of the nutrient can raise your cholesterol, they have said, and with it the…