Category: 8. Health

  • Vidutolimod Combo Therapy Shows Promise in Treating Advanced Melanoma

    Vidutolimod Combo Therapy Shows Promise in Treating Advanced Melanoma

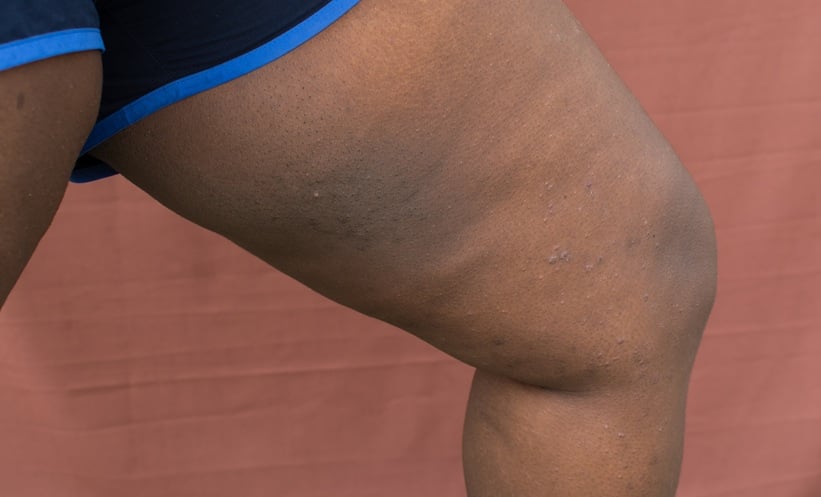
    Image Credit: © dermnetnz.org

    A recently concluded phase 1b clinical trial offers renewed hope for patients with advanced melanoma resistant to programmed cell death 1 (PD-1) blockade. The study evaluated intratumoral vidutolimod, a Toll-like receptor 9 (TLR9) agonist, administered either alone or in combination with pembrolizumab.1 A specific formulation (PS20-A) combined with pembrolizumab was well tolerated and showed improved efficacy.

    “For PD-1 blockade–resistant melanoma, new immunotherapy combinations are needed to simultaneously target multiple cancer immune evasion mechanisms,” the authors wrote.

    PD-1 resistance in melanoma is commonly associated with a non-inflamed tumor microenvironment lacking sufficient CD8+ T-cell infiltration.2 Vidutolimod aims to convert these tumors by activating plasmacytoid dendritic cells and inducing type I interferon responses. By directly injecting vidutolimod into tumors, the researchers sought to stimulate local and systemic antitumor immunity. Combining this with pembrolizumab, a PD-1 inhibitor, could potentially overcome immune resistance mechanisms.

    This open-label, multicenter phase 1b trial (NCT02680184) consisted of two parts. Part 1 tested vidutolimod with pembrolizumab in 159 patients, and part 2 tested vidutolimod monotherapy in 40 patients. Two formulations of vidutolimod were assessed, PS20-A (0.005%–0.01% polysorbate 20) and PS20-B (0.00167%), at dose levels from 1 to 10 mg. The drug was injected intratumorally weekly for 7 weeks, followed by every 2 or 3 weeks thereafter. Included lesions had diameters of ≥0.5 cm.

    There was a clinical focus on patients with metastatic and/or unresectable melanoma, including those who were previously treated with ipilimumab. Each had an Eastern Cooperative Oncology Group performance status of 0 or 1, and measurable disease per Response Evaluation Criteria in Solid Tumors, version 1.1 (RECIST v1.1). All were enrolled between April 14, 2016, and April 26, 2021. Primary clinical endpoints revolved around safety and adverse events. Tumor assessments were evaluated at baseline screening, every 12 weeks, and then post-treatment.

    The most clinically meaningful responses were observed with the PS20-A formulation. Over 7.1% of patients had a complete response with the best objective response rate of 23.5%. The median duration of response was 25.2 months with median overall survival of 16.3 months. Responses were seen in both injected and noninjected lesions, including in visceral metastases, suggesting systemic immune activation. Notably, 12 patients treated with PS20-A plus pembrolizumab had responses lasting over a year, with two maintaining responses beyond 36 months.

    In contrast, the PS20-B formulation had a lower efficacy of 11.5%. The median duration of response was 11.4 months. According to the authors, this formulation is no longer in clinical development. When used as a monotherapy, vidutolimod showed an objective response rate of 20.0%. All responses were partial. The median duration of response was 5.6 months.

    Any-grade treatment-emergent adverse events were common but manageable, occurring in 100.0% of patients. Grade ≥3 treatment-emergent adverse effects occurred in 55.3% (combination therapy) and 37.5% (monotherapy) of patients. The most frequently observed events were transient injection site reactions and flu-like symptoms such as chills, fever, fatigue, and nausea. Hypotension and hypertension were the most common severe (grade ≥3) events. In part 1, 3 patients (1.9%) had a treatment-emergent adverse event resulting in death. A patient with a past history of infected neoplasm died of sepsis, and 2 patients with baseline lung metastases died of respiratory failure. No treatment-related deaths occurred in part 2.

    This study provides compelling early-phase evidence that intratumoral vidutolimod, especially in its PS20-A formulation, can generate durable clinical responses in patients with PD-1–resistant melanoma, in combination with pembrolizumab. Vidutolimod PS20-A is now being prioritized for further clinical development. Larger randomized trials with a control group and longer follow-up. are needed to validate these findings and establish the optimal treatment schedule.

    References

    1. Milhem MM, Zakharia Y, Davar D, et al. Intratumoral vidutolimod as monotherapy or in combination with pembrolizumab in patients with programmed cell death 1 blockade-resistant melanoma: Final analysis from a phase 1b study. Cancer. 2025;131(15):e70022. doi:10.1002/cncr.70022

    2. Kim JM, Chen DS. Immune escape to PD-L1/PD-1 blockade: seven steps to success (or failure). Ann Oncol. 2016;27(8):1492-1504. doi:10.1093/annonc/mdw217

    Continue Reading

  • RespiClear Becomes 2025’s Most Talked-About Lung Support Ritual as “7s Mucus Flush” Trend Explodes Across TikTok and Long COVID Forums

    RespiClear Becomes 2025’s Most Talked-About Lung Support Ritual as “7s Mucus Flush” Trend Explodes Across TikTok and Long COVID Forums

    RespiClear

    Backed by 78,000+ Daily Users, This Clean-Label Lung Ritual Taps 2025’s Mucus Reset Trend—No Inhalers, No Prescriptions, Just 7 Seconds a Day

    Tampa, Aug. 04, 2025 (GLOBE NEWSWIRE) — DISCLAIMER: This press release is for informational purposes only. The information contained herein does not constitute medical advice, diagnosis, or treatment and has not been evaluated by the Food and Drug Administration (FDA). RespiClear is not intended to diagnose, treat, cure, or prevent any disease. Always consult your physician or qualified healthcare provider before beginning any new supplement, routine, or health program.
    Some links in this release may be promotional in nature and may lead to third-party websites. The publisher or author may receive compensation through affiliate commissions if a purchase is made through these links. This compensation does not affect the price you pay and helps support continued research and content publication. Results described or implied may not be typical and should not be interpreted as guarantees.
    Statements made about ingredients or outcomes reflect public discussion and historical usage only, and are not endorsed by medical professionals or regulatory agencies. Always do your own research and make informed decisions.

    RespiClear Becomes 2025’s Most Talked-About Lung Support Ritual as “7s Mucus Flush” Trend Explodes Across TikTok and Long COVID Forums
    RespiClear Becomes 2025’s Most Talked-About Lung Support Ritual as “7s Mucus Flush” Trend Explodes Across TikTok and Long COVID Forums

    RespiClear Becomes 2025’s Most Talked-About Lung Support Ritual as “7s Mucus Flush” Trend Explodes Across TikTok and Long COVID Forums

    In an era where environmental stress, urban air quality, and post-viral fatigue dominate wellness conversations, one ritual is quietly changing the way Americans think about breathing. The buzz? A simple 7-second daily lung routine powered by RespiClear, a clean-label formula now used by over 78,000 Americans.
    Formulated with mucolytic herbs like Mullein, Ginger, and Cordyceps, RespiClear supports those seeking clearer breath, lighter mornings, and long-term respiratory confidence — without prescriptions, powders, or pills.

    Explore the Full RespiClear Formula

    Why Interest in “7s Ritual Clears Stuck Mucus” Is Surging in 2025

    The viral interest in short-form rituals and natural breathing remedies has collided with the global need for respiratory recovery. As more people turn away from pharmaceutical-first approaches, they are embracing simple, integrative health routines they can control. RespiClear fits into this evolving health narrative by providing a structured, easy-to-implement ritual that aligns with what digital audiences want: low friction, high impact.

    Social platforms are increasingly flooded with testimonials and trend-spotting videos featuring phrases like “mucus flush,” “breathing hack,” and “clean lung ritual.” The rise in attention is not merely hype — it reflects a growing concern over residual respiratory symptoms post-illness, as well as an increased desire to offset everyday air pollution, wildfire exposure, and indoor toxin buildup. These conversations, while anecdotal, are informing how millions view respiratory health in 2025.

    RespiClear’s Ingredient-First Response to These Trends

    What sets RespiClear apart in this movement isn’t just what’s inside the formula — it’s how the product is positioned. RespiClear does not promise medical outcomes, but rather contributes to a broader movement of proactive daily wellness. The sublingual format delivers the plant-based ingredients quickly, a nod to both modern efficiency and traditional herbalism.

    As part of a trend emphasizing radical transparency, RespiClear lists every ingredient, dose, and third-party verification step. Consumers can trace the product from source to supplement — a critical factor in building trust at a time when misinformation and wellness fatigue are rampant.

    More than a product, RespiClear is a reflection of what today’s health-conscious individual wants: simplicity, integrity, and data-backed natural formulations. In addition to excluding stimulants, allergens, and questionable additives, the formula is designed for long-term daily use, reinforcing the shift from reactive care to continuous support.

    Ingredient Spotlight – What’s Inside the Formula

    RespiClear’s formulation is a showcase of historically relevant, globally respected ingredients that have seen renewed interest in recent years. Each ingredient is dosed in a way that reflects its respected usage in wellness traditions and is supported by observational discussion in public health forums.

    • Mullein Leaf Extract (1,000 mg) – Used for centuries as a tea for easing cough and congestion, mullein is currently enjoying a renaissance. RespiClear’s version is highly bioavailable, liquified for easy delivery and maximal absorption.

    • Ginger Root Extract (100 mg) – Popular in both Eastern and Western traditions, ginger is associated with circulation, digestive relief, and airway clarity. Its inclusion is based on its role in helping users feel open-chested and warmed.

    • Bromelain (50 mg) – Often found in sports recovery products, bromelain supports the breakdown of proteins and is valued for tissue wellness — particularly in high-stress respiratory situations.

    • Lemon Peel Extract (25 mg) – With high concentrations of natural antioxidants, lemon peel is a crowd-favorite in discussions around immune resilience and cellular protection.

    • Cordyceps militaris (25 mg) – As an adaptogen, cordyceps has grown popular among performance optimizers and long-COVID recoverees alike. It is explored for its relationship with oxygen processing and vitality.

    Collectively, these ingredients form a coherent and intentional stack. They’re not designed to replace medicine — they offer a structured entry point for those seeking lung support via natural routes.

    View Full Ingredient Transparency

    What Reddit, Podcasts & TikTok Creators Are Saying

    RespiClear’s rise in popularity isn’t driven by advertising — it’s fueled by thousands of anecdotal micro-mentions from communities that trade wellness tips peer-to-peer. On TikTok, creators frequently highlight the product in morning ritual videos or “what’s in my bag” wellness rundowns. Reddit’s wellness subforums feature in-depth user experiences detailing RespiClear’s impact on congestion, focus, and even emotional clarity.

    Podcasts hosted by holistic health educators, performance coaches, and yoga therapists often include RespiClear in “non-invasive support tools” lists. The language is consistent: RespiClear doesn’t fix everything — but it helps people feel more in control of their breath, especially after difficult seasons of respiratory stress.

    Importantly, users are not framing the product in clinical terms. Instead, the product shows up as part of a mindset shift — one where simplicity, consistency, and breath awareness are becoming foundational.

    Who Might Be Drawn to This Type of Supplementation in 2025

    While the audience for RespiClear is wide-ranging, certain demographics are leading adoption:

    • Post-viral recovery groups who want gentle, everyday routines that feel empowering

    • Older adults and ex-smokers focused on daily lung hygiene and resilience

    • Urban professionals navigating poor indoor air quality, wildfire smoke, and long hours

    • Fitness and wellness enthusiasts who use breath as a foundation for movement and recovery

    • Spiritual communities drawn to breath as a sacred component of calm, control, and emotional stability

    These audiences are not defined by illness — they are defined by a desire to optimize wellness preventatively. For this reason, RespiClear often becomes part of broader lifestyle rituals that include stretching, mindfulness, hydration, and clean eating.

    5 Steps to Support Lung Health (and Why RespiClear Complements Them)

    While no supplement can replace smart lifestyle choices, RespiClear is structured to align perfectly with the five most recommended practices in 2025 for protecting respiratory integrity:

    1. Quit Smoking: The #1 recommendation. Removing tobacco toxins allows the lungs to regenerate over time. RespiClear users who have recently quit say it helps them stay motivated by giving them an immediate, supportive action each day.

    2. Daily Movement: Light cardiovascular exercise expands lung capacity, clears stale air, and supports circulation. RespiClear’s energizing, clear-breath feel pairs well with morning walks, yoga, or breathwork.

    3. Antioxidant Nutrition: Flavonoids reduce systemic inflammation. RespiClear complements these effects with ingredients like ginger and lemon, which are already valued for their antioxidant properties.

    4. Clean Air Exposure: In urban areas where clean air is rare, RespiClear users report a sense of protection after returning from travel, fires, or heavily polluted cities.

    5. Breath Practice: Deep breathing resets the nervous system. Users often take their RespiClear dose right before meditation or breath training for synergy.

    This is what makes RespiClear unique: it is not positioned as a cure — it is an amplifier of the most essential health habits.

    Start the RespiClear Ritual That Reinforces Better Breathing Habits

    Spiritual Optimization & Detox Culture: Where RespiClear Fits In

    Wellness is not just about the body — it’s about mental, emotional, and spiritual lightness in 2025. RespiClear appears increasingly in conversations about:

    • “Third-lung cleansing” in energy work

    • Daily routines designed to calm the nervous system through somatic breathing

    • Post-psychedelic integration practices where breath is used to ground and center

    Its presence in these communities is not because of marketing, but because it fulfills a demand: something subtle, safe, and supportive. With no caffeine, no overstimulation, and no gut disturbance, RespiClear is often used during fasting windows, pre-sleep wind-downs, or pre-yoga grounding.

    Public Debate Around “Mucus Formulas” — Caution Meets Curiosity

    RespiClear’s popularity has not shielded it from scrutiny. Critics have raised questions about the legitimacy of mucus-targeting products and whether claims made by influencers overstate the experience.

    The brand has responded by doubling down on transparency. Their website includes detailed sourcing, dosage explanations, and third-party test protocols — uncommon in the supplement space. It’s a bet on intelligence and trust: by giving users all the facts, they invite scrutiny as a sign of integrity.

    Wellness forums now often cite RespiClear as a “test case” for whether natural lung supplements can carve out a legitimate category — not as miracle pills, but as daily partners in long-term breath clarity.

    About RespiClear

    RespiClear is a U.S.-manufactured natural formula designed to support daily breath clarity, mucus management, and clean-label supplementation. The company behind RespiClear believes in empowering individuals with proactive tools that foster calm, clarity, and long-term wellness.

    Every batch is:

    • GMP certified and third-party tested

    • Packaged with a 180-day satisfaction guarantee

    • Shipped within the U.S. with transparent customer support

    With a mission to improve breathing for 1,000,000 Americans, RespiClear is a quiet but growing part of 2025’s shift toward breathable living.

    Contact

    • RespiClear – Clean-Label Lung Support Backed by Transparency

    • Email: support@respiclear.com

    • Phone: (833) 576-9777

    • Website: https://respiclear.com

    FINAL DISCLAIMER

    This press release is for informational purposes only. The information contained herein does not constitute medical advice, diagnosis, or treatment and has not been evaluated by the Food and Drug Administration (FDA). RespiClear is not intended to diagnose, treat, cure, or prevent any disease. Always consult your physician or qualified healthcare provider before beginning any new supplement, routine, or health program.

    Some links in this release may be promotional in nature and may lead to third-party websites. The publisher or author may receive compensation through affiliate commissions if a purchase is made through these links. This compensation does not affect the price you pay and helps support continued research and content publication. Results described or implied may not be typical and should not be interpreted as guarantees.

    Statements made about ingredients or outcomes reflect public discussion and historical usage only, and are not endorsed by medical professionals or regulatory agencies. Always do your own research and make informed decisions.

    CONTACT: Email: support@respiclear.com Phone: (833) 576-9777

    Continue Reading

  • Characterizing sarcopenia and sarcopenic obesity in patients aged 65 years and over, at risk of mobility disability: a multicenter observational trial (SARA-OBS) | BMC Geriatrics

    Characterizing sarcopenia and sarcopenic obesity in patients aged 65 years and over, at risk of mobility disability: a multicenter observational trial (SARA-OBS) | BMC Geriatrics

    This observational trial was designed to examine changes in physical function and mobility in older adults with sarcopenia by collecting and analyzing data on the natural evolution of their physical functioning and muscle strength over a 6-month period.

    The included sample is from a true geriatric population (age = 79.2 ± 7.5) with gender distribution as expected (women = 60.0%) and a relatively high BMI (29.58 ± 6.98 kg/m²).

    The most frequent adverse event was falls, a further recognized hallmark of an at-risk sarcopenic geriatric population.

    GS at the 400MWT was chosen as primary endpoint. Gait speed slower than 1.0 m/s has been predictive of negative outcomes, like frailty, mortality, mobility limitations, falls and decreased quality of life [30, 31]. This is a continuous variable that expresses in a reliable manner the grade of residual (lower limbs) muscular function in older persons. Both GS and 6MWD decreased after 6 months in participants with GS ≥ 0.8 m/sec and SPPB = 8 at baseline. This may be due to a higher amplitude of deterioration in these better performers’ subgroups, easier to detect compared to the most severe subgroups (floor effect). Interestingly, the SO subgroup showed a significant decrease in the 6MWD, close to clinically meaningful change of 20 m as defined in [31]. The association of obesity and sarcopenia could be detrimental to the deterioration rate of the gait speed, and may need a specific focus following the effect of new therapies targeting obesity showing a loss of fat mass and lean mass [32]. Conversely, HGS and SarQoL did not significantly change from baseline to Month 6/EOS in the overall population or any analyzed subgroups. These data suggested that in the study population, a subgroup of sarcopenic patients with a potential for rapid functional loss could be identified and corresponds to those individuals with a “residual” functional reserve. These findings may help to better characterize the sarcopenic population and facilitate the design of RCT targeting the sarcopenic subjects who are most likely to benefit from an intervention.

    Nevertheless, the inclusion of low GS (≤ 0.8 m/s) has recently reached a consensus among recommendations of working groups [6, 12] to define sarcopenia. Low GS has been shown to be associated with many relevant clinically important outcomes in older adults including physical disability, hospitalization, fall risk, and death [33, 31, 34], and is part of the definition of severe sarcopenia from the EWGSOP2 [6]. However, it is possible that patients with a very low function may have already reached a floor, thereby being relatively insensitive to further decline, at least in the time window of a comparative clinical trial, and thus unsuitable for testing a therapeutic intervention. The 400MWT and 6MWD were initially developed and used to assess cardiorespiratory fitness [35, 36]. The 6MWD has gained importance in the assessment of functional exercise capacity in participants with chronic respiratory disease and in many studies of older adults. The 6MWD has proved to be reliable, inexpensive, safe and easy to apply [1]. In addition, it correlates well with important outcomes including death [37, 38]. Correlation between 6MWD and 400MWT at M6 End of study was r = 0.78, statistically significant (p value < 0.001).

    Compared to SPPB which includes a 4-meter walk test, the mean usual GS calculated from completion time is less prone to variability and to ceiling effects in older adults [30, 39]. Results from this observational study suggest that a more severe subgroup of sarcopenic population, at risk of mobility disability, can be selected using the threshold of SPPB ≤ 8. The latter point was the main difference from other previous studies like LIFE [40] and its preparatory trial LIFE-P [41] or SPRINTT [42], which had a SPPB threshold ≤ 9. These studies compared a structured physical intervention arm with health education and showed an increased risk of mobility disability when sarcopenic participants had a baseline SPPB of 8 or lower. The threshold of SPPB ≤ 8 is now part of the definition of sarcopenia [6].

    HGS is a proxy measurement for overall muscle strength and a primary parameter, together with LMM, to diagnose sarcopenia in the latest EWGSOP2 [6]. The different consortia suggest a wide range of cut-offs that is confusing, given the importance of LMS in the characterization of the pathology. In our study, the population could be considered sarcopenic or not according to the definition of low grip strength (Means ± SD at baseline were 19.2 ± 8.2 kg in women and 29.4 ± 10.9 kg in men). EWGSOP2 [6] and ESCEO [12] recommended cut-off values of ≤ 27 kg and 16 kg, for men and women, respectively. This threshold was based on normative data for grip strength across the life course in men and women in the UK from 12 British studies (almost 5,000 participants, aged 4 to 90 years), the cut-off being based on T-Score of ≤-2.5 [43] but no association was shown with physical performance or higher risk of adverse outcomes. Some other groups proposed cut-off values based on association with slow measured walking speed and self- reported difficulty with mobility: Lauretani and colleagues proposed 30 kg and 19 kg in males and females, respectively [44], Sallinen and colleagues proposed 37 kg and 21 kg in males and females, respectively [45]. More recently, the SDOC group analyzed data from more than 18,000 community-dwelling older adults [11]. Grip strength was identified as a primary discriminator from classification and regression trees (CART) and receiver operator characteristics (ROC) curves including area under the curve (AUC) were used to identify variables (and cut-off points in these variables) that best discriminated older adults with slowness (usual walking speed < 0.8 m/s) from those without. The resulting cut-off for grip strength was 35.5 kg and 20 kg in males and females, respectively. More importantly, this group showed an association between HGS variables with incident clinical outcomes of falls, self-reported mobility limitation, hip fracture, and mortality. The retrospective analysis of international datasets showed the better performance characteristics (i.e. sensitivity and specificity) of this test using the proposed cut-off compared to cut-offs proposed by FNIH (< 26 kg for men and < 16 kg for women) and EWGSOP [46]. Our data did not highlight any deterioration in HGS in the SARA-OBS population, which could be explained partly by the short follow-up period (only 6 months). Of note, we did not apply any eligibility criteria based on this parameter.

    The Short Form-36 (SF-36) is one of the most widely used, validated generic measures of health-related quality of life and has been shown to discriminate between patients with different chronic conditions and between patients with different severity levels of the same disease. Low SF-36 score has been shown related to severe sarcopenia [47]. In the current study, no change from baseline to Month 6/EOS was detected, whatever the subgroup analyzed. This might be explained by the short follow-up period in this study.

    SarQoL has been reported to be responsive and correlated with the change in GS [48]. During a validation study of the SarQoL, the authors reported in a cohort of 42 sarcopenic patients, a significant median change in the GS of -0.10 (IQR − 0.26; 0.14; p = 0.032) and a median change in SarQoL score of 5.23 (IQR − 12.46; 1.61; p = 0.002) during a 2-year interval.

    In SARA-OBS population, SarQoL score did not significantly change over time. Similar results were observed in the subgroup of participants with a baseline GS ≥ 0.8 m/s, while they did experience a significant decline in their GS and the 6MWD. This suggests that the physical function decline was either still too early to translate into an alteration of the quality of life, the measurement instrument is not sensitive enough and/or may have ceiling effects, psychological adaptation of older persons to the very gradual decline in physical performance that is not reflected significantly in terms of QOL and/or the period of observation was too short. Another explanation could be the large difference between the sample size (up to ten times less in SO group versus no-SO group, for instance).

    Recently, a study suggested a correlation between the SarQoL score and the risk level of suffering sarcopenia [49]. The cut-off between high and moderate risk of sarcopenia was set to 60 points. This is consistent with the definition of sarcopenia applied in the SARA-OBS study for the SarQol baseline values of the most vulnerable subgroups (SPPB < 8 and GS ≤ 0.8 m/s at baseline). Based on that we can understand the SARA-OBS population have a moderate risk for sarcopenia.

    The identification of specific biomarkers allowing the early identification of Sarcopenia and the monitoring of this pathology overtime is still needed. In this study, no correlation was observed between biomarkers and no difference from baseline at 6-Months for assessed biomarkers. The short duration of the study may explain this result.

    Myostatin has been associated with reduction in muscle mass and its mRNA expression was shown to be higher in sarcopenic population and associated with BMI [50]. In SARA-OBS study, patients with a “high” level of myostatin (based on median level at baseline) had a statistically significant reduction in the GS/400MWT change from baseline to Month 6/EOS of -0.05 ± 0.208 m/s (p = 0.044) unlike the group with a “low” level of myostatin (-0.005 ± 0.12 m/s; p = 0.732).

    Association between chronic low-grade inflammation, CRP and sarcopenia remains unclear since correlation with muscle strength was shown but not with muscle mass. A high level of hsCRP was independently associated with an impairment of muscle strength, but this relationship was not observed in low muscle mass [29]. In this study, patients with a low hsCRP level showed a significant reduction with a mean ± SD change of GS (-0.04 ± 0.14 m/sec; p = 0.018) and 6MWT (-24.2 ± 81.2 m; p = 0.008). However, no significant changes were observed in HGS.

    SARA-OBS will be used to define the target population, endpoints, and duration of treatment in the forthcoming pivotal clinical trials for a New Chemical Entity (NCE) in sarcopenia, with SARA-INT, a phase2b study for the evaluation of the safety and efficacy of BIO101 (20-hydroxyecdysone) in sarcopenic patients.

    Study limitations

    Observational by nature, the control of the daily activity and physical exercise (both prescribed or performed) was limited.

    Missing data were observed in this observational study, which is unfortunately inherent to observational studies. Another limitation of this trial is related to the definition of SO, based on an observational study [27]. Since then, the ESPEN group showed the limit of this definition in a meta-analysis [51] and suggested a new consensual definition of SO [52]. New studies will necessarily consider this new approach to SO.

    Considering the importance of nutritional status in the evolution of sarcopenia, the lack of information on patients’ nutritional status, as well as in the use of nutritional supplements, such as proteins, is a limitation of the study.

    The observation duration of 6 months may be considered as relatively short to detect worsening of functional outcomes in a slowly progressing disease such as age-related sarcopenia. The SarcoPhAge study has brought interesting results on the long-term follow-up on 534 older participants and did not show a difference after 1 year [53] in mean HGS but rather after 5 years, even though the level of physical activity was increased [54]. Likewise, SPPB score did not evolve after 1 year of follow-up, but the GS was significantly lower after 5 years. Note that GS was measured over 4 m, a hundred time shorter than in our study.

    Recently, a meta-analysis showed that prevalence of sarcopenia concerns more men than women using the EWGSOP2 criteria [55]. However, in this work, but also in general, more women are included in the studies.

    Since SARA-OBS was an observational study, no prior hypothesis was set and multiple outcomes and subgroups analyses were performed without adjustment to control type I error inflation. Thus, interpretation and conclusions drawn from this study should be considered with precautions. In SARA-OBS, the non-SO participants were a very small number in some groups at Month 6/EOS, further complicating the interpretation of the findings.

    Continue Reading

  • Determining population-specific risk factors for COVID-19 susceptibility and severity to inform future individual-level integrated risk scoring | BMC Infectious Diseases

    Determining population-specific risk factors for COVID-19 susceptibility and severity to inform future individual-level integrated risk scoring | BMC Infectious Diseases

    Baseline characteristics

    A total of 2,128 individuals from Israel responded to the survey between July 2021 and August 2022. Table 1 provides a description of demographic factors, comorbidities, habits, and socioeconomic variables available for the study participants. The participants had a mean age of 49.83 years, with 61.14% being female and 75.94% identifying as Jewish, which is in line with the national average. Among them, 823 individuals (38.67%) tested positive for SARS-CoV-2. Of the infected participants, 744 (90.4%) reported symptoms, whereas 79 (9.6%) were asymptomatic. Based on the reported infection dates of the participants, the peak of COVID-19 infections occurred in January 2022, coinciding with the fifth wave driven by the Omicron variant.

    Table 1 Description and overview of various demographic factors, comorbidities, and behaviors among the study participants

    Regarding BMI distribution, 23.2% of participants were classified as obese (BMI > 30, Table 1). At the time of being surveyed, 43.4% had received three or more doses of a COVID-19 vaccine and 22.6% were not vaccinated. In terms of chronic conditions, 12.6% reported hypertension, followed by 7.5% with diabetes. Other chronic conditions such as asthma (4.7%), COPD (2%), chronic kidney disease (2.3%), and immunosuppression (2.7%) were also reported (Table 1).

    Comparison with published literature

    Based on our search, 408 articles were initially identified from the electronic database searches. After scanning titles and abstracts, 361 articles were excluded for lack of relevance. This left 47 potentially relevant MAs for full review. Of these, 27 MAs were excluded due to lack of relevance and failure to adhere to PRISMA guidelines. Consequently, 20 MAs were retained (see Fig. 1S). Of these, 7 MAs did not match our prespecified criteria for outcomes, while 13 MAs did: 3 MAs matched infection outcomes, 5 matched hospitalization outcomes and 5 matched both infection and hospitalization outcomes. Of these 13 MAs, six examined risk factors that were obtained in our dataset and were therefore selected for direct comparison with our findings.

    The impact of epidemiological factors on COVID-19 infection rates

    In the univariate analysis, gender, age, number of children, ethnicity, education, BMI, vaccination status, hypertension, COPD, smoking, alcohol consumption and physical activity were significantly associated with COVID-19 susceptibility (p < 0.05, Table 2).

    Table 2 COVID-19 susceptibility analysis

    In the multivariate logistic regression model, after adjusting for other factors, ethnicity, education level, BMI, vaccination status and the presence of COPD remained significantly associated with COVID-19 susceptibility (Table 2). BMI and vaccination status remained significantly associated with COVID-19 infection in the subsequent time period (supplementary Table 1).

    Our study did not find a significant association between gender and susceptibility to infection. A published MA of 41 studies [9] reported that men have a slightly higher risk of infection RR = 1.14 (95% CI: 1.07–1.21) (Figs. 2S-A). Similarly to our study, 14 of the 41 papers included did not identify an association.

    Regarding differences between minorities and the general population, the Arab minority was more likely to be infected than the Jewish majority (aOR = 1.48, 95% CI: 1.02–2.15), a result similar to other settings where minority groups experience higher susceptibility. A MA of 68 studies showed that African American and Hispanic individuals were almost two times as likely to test positive for COVID-19 as White individuals (African American: RR, 2.01; 95% CI, 1.04–3.88; P = 0.04; Hispanic: RR, 2.09; 95% CI, 1.13–3.88; P = 0.02) [11].

    In our study, participants with a BMI over 30 had increased odds of COVID-19 infection compared to those with a normal BMI (aOR = 1.54, 95% CI: 1.02–2.32), a finding compatible with a MA of 7 studies [12] reported an OR of 2.73 (95% CI: 1.53–4.87) for COVID-19 infection among individuals with higher BMI (Fig. 2S-B). Our study also found that being underweight was associated with increased susceptibility (Table 2) but we could not identify a MA specifically focusing on low BMI as a risk factor.

    Our results suggested a significantly reduced likelihood of infection among vaccinated individuals, with 2 doses (aOR = 0.09, 95% CI: 0.06–0.13, p < 0.0001), a protective effect compatible with a pooled estimate of a MA of 21 studies [2] (Fig. 2S-C), reporting a RR of 0.19 (95% CI: 0.13–0.27, p < 0.0001).

    A MA of 17 studies [18] suggested a reduced risk of COVID-19 infection among smokers, with a RR of 0.74 (95% CI of 0.58–0.93) (Fig. 2S-D). Although our OR was very similar (0.82), smoking was not associated with a change in the odds of COVID-19 infection in our study, like 8/17 studies included in the MA.

    A MA of 5 studies [17] reported a small but statistically significant reduction in infection risk associated with physical activity (RR = 0.89, 95% CI: 0.84–0.95) (Fig. 2S-E). Our study did not identify any effect (OR = 0.69, p > 0.05).

    To assess the consistency of our findings across different phases of the pandemic, we conducted a supplementary analysis comparing associations between key variables and infection status before and after January 1st 2022 (supplementary Table 1). While the primary analysis was restricted to infections occurring before this date, when testing was more systematic and the force of infection lower, we recognize that risk factor dynamics may evolve over time. The analysis showed that while certain associations (e.g., BMI, physical activity, vaccination status) were consistent across both periods, overall the total number of significant associations decreased after January 1st 2022, possibly reflecting the difficulty in identifying risk factors in a high force of infection scenario where almost everyone is infected. Findings of this additional analysis should be interpreted with caution.

    The impact of epidemiological factors on COVID-19 severity (hospital admission rates)

    In the univariate analysis, gender, age, ethnicity, education, BMI and vaccination status were significantly associated with COVID-19 severity as measured by hospitalization (p < 0.05, Table 3). After adjusting for significant confounders, age, education level, and vaccination status remained significantly associated with the severity of the disease.

    Table 3 COVID-19 severity analysis

    A MA of 22 studies [9](Figure 3S-A) identified an elevated risk of hospitalization among males (OR =1.33, p<0.05). Although our study had a similar OR (1.48), the association was not significant. Likewise, a MA of 5 studies [12](Figure 3S-B) reporting an overall positive association between obesity and disease severity (OR=1.72, CI: 1.55-1.92, p<0.05). Our study found a similar OR of 1.82 for the association between obesity (BMI>30) and COVID-19 hospitalization, though the association was not significant.

    Our study found a decrease of 21% in the odds of hospitalization in vaccinated individuals (2 doses and 3 or more doses) and a 63% decrease for those who received 3 or more doses, compared to unvaccinated individuals, compared to unvaccinated (95% CI:0.41-1.52 and CI: 0.17-0.81, respectively), compatible with the findings of a MA of 7 studies [26] (Figure 3S-C) showing a 93% reduction with full vaccination (2 doses; RR =0.07 (95% CI: 0.03-0.17).

    Continue Reading

  • UK begins gonorrhea vaccination program – CIDRAP

    UK begins gonorrhea vaccination program – CIDRAP

    1. UK begins gonorrhea vaccination program  CIDRAP
    2. Gonorrhoea vaccine roll-out begins across the UK  BBC
    3. Free STI vaccines now being offered across England  The Independent
    4. The NHS Is Rolling Out a Free Gonorrhoea Vaccine After Record Infections  Men’s Health
    5. Gonorrhoea vaccine national roll out  Local Government Association

    Continue Reading

  • Superpowers of Hibernating Animals Could Lie Hidden in Human DNA

    Superpowers of Hibernating Animals Could Lie Hidden in Human DNA

    Two new studies by University of Utah researchers provide clues on how to unlock these hibernating abilities, opening the door to someday developing treatments that could reverse neurodegeneration and diabetes.

    Studying the evolution of hibernators like some hedgehogs, bats, ground squirrels, and lemurs could reveal the secrets of their remarkable resilience. Image credit: Chrissy Richards.

    A gene cluster called the fat mass and obesity (FTO) locus plays an important role in hibernators’ abilities. Intriguingly, humans have these genes too.

    “What’s striking about this region is that it is the strongest genetic risk factor for human obesity,” said University of Utah’s Professor Chris Gregg, senior author on both studies.

    “But hibernators seem able to use genes in the FTO locus in new ways to their advantage.”

    Professor Gregg and his colleagues identified hibernator-specific DNA regions that are near the FTO locus and that regulate the activity of neighboring genes, tuning them up or down.

    They speculate that adjusting the activity of neighboring genes, including those in or near the FTO locus, allows hibernators to pack on the pounds before settling in for the winter, then slowly use their fat reserves for energy throughout hibernation.

    Indeed, the hibernator-specific regulatory regions outside of the FTO locus seem crucial for tweaking metabolism.

    When the researchers mutated those hibernator-specific regions in mice, they saw changes in the mice’s weight and metabolism.

    Some mutations sped up or slowed down weight gain under specific dietary conditions; others affected the ability to recover body temperature after a hibernation-like state or tuned overall metabolic rate up or down.

    Intriguingly, the hibernator-specific DNA regions the researchers identified weren’t genes themselves.

    Instead, the regions were DNA sequences that contact nearby genes and turn their expression up or down, like an orchestra conductor fine-tuning the volume of many musicians.

    “This means that mutating a single hibernator-specific region has wide-ranging effects extending far beyond the FTO locus,” said University of Utah’s Dr. Susan Steinwand, first author on the first study.

    “When you knock out one of these elements — this one tiny, seemingly insignificant DNA region — the activity of hundreds of genes changes. It’s pretty amazing.”

    Understanding hibernators’ metabolic flexibility could lead to better treatments for human metabolic disorders like type 2 diabetes.

    “If we could regulate our genes a bit more like hibernators, maybe we could overcome type 2 diabetes the same way that a hibernator returns from hibernation back to a normal metabolic state,” said University of Utah’s Dr. Elliott Ferris, first author on the second study.

    Finding the genetic regions that may enable hibernation is a problem akin to excavating needles from a massive DNA haystack.

    To narrow down the regions involved, the scientists used multiple independent whole-genome technologies to ask which regions might be relevant for hibernation.

    Then, they started looking for overlap between the results from each technique.

    First, they looked for sequences of DNA that most mammals share but that had recently changed in hibernators.

    “If a region doesn’t change much from species to species for over 100 million years but then changes rapidly and dramatically in two hibernating mammals, then we think it points us to something that is important for hibernation, specifically,” Dr. Ferris said.

    To understand the biological processes that underlie hibernation, the researchers tested for and identified genes that turn up or down during fasting in mice, which triggers metabolic changes similar to hibernation.

    Next, they found the genes that act as central coordinators, or hubs, of these fasting-induced changes to gene activity.

    Many of the DNA regions that had recently changed in hibernators also appeared to interact with these central coordinating hub genes.

    Because of this, the authors expect that the evolution of hibernation requires specific changes to the controls of the hub genes.

    These controls comprise a shortlist of DNA elements that are avenues for future investigation.

    Most of the hibernator-associated changes in the genome appeared to break the function of specific pieces of DNA, rather than confer a new function.

    This hints that hibernators may have lost constraints that would otherwise prevent extreme flexibility in the ability to control metabolism.

    In other words, it’s possible that the human thermostat is locked to a narrow range of continuous energy consumption. For hibernators, that lock may be gone.

    Hibernators can reverse neurodegeneration, avoid muscle atrophy, stay healthy despite massive weight fluctuations, and show improved aging and longevity.

    The researchers think their findings show that humans may already have the needed genetic code to have similar hibernator-like superpowers — if we can bypass some of our metabolic switches.

    “Humans already have the genetic framework,” Dr. Steinwand said.

    “We just need to identify the control switches for these hibernator traits.”

    “By learning how, researchers could help confer similar resilience to humans.”

    “There’s potentially an opportunity — by understanding these hibernation-linked mechanisms in the genome — to find strategies to intervene and help with age-related diseases,” Professor Gregg said.

    “If that’s hidden in the genome that we’ve already got, we could learn from hibernators to improve our own health.”

    The results appear in two paper in the journal Science.

    _____

    Susan Steinwand et al. 2025. Conserved noncoding cis elements associated with hibernation modulate metabolic and behavioral adaptations in mice. Science 389 (6759): 501-507; doi: 10.1126/science.adp4701

    Elliott Ferris et al. 2025. Genomic convergence in hibernating mammals elucidates the genetics of metabolic regulation in the hypothalamus. Science 389 (6759): 494-500; doi: 10.1126/science.adp4025

    Continue Reading

  • MS Therapy Management for Pregnancy May Raise Relapse Risk – MedPage Today

    1. MS Therapy Management for Pregnancy May Raise Relapse Risk  MedPage Today
    2. Multiple Sclerosis and Pregnancy Concerns May Stop Women From Getting Needed Medications  Everyday Health
    3. Women less likely than men to receive MS drugs, reveals research  Medical Dialogues
    4. Women Less Likely to Get MS Meds Than Men  U.S. News & World Report

    Continue Reading

  • Relationship between gut microbiota dysbiosis and bile acid in patients with hepatitis B-induced cirrhosis | BMC Gastroenterology

    Relationship between gut microbiota dysbiosis and bile acid in patients with hepatitis B-induced cirrhosis | BMC Gastroenterology

    Comparative analysis of basic data between the HBC and control groups

    The clinical characteristics of the patients are presented in Table 1. Comparisons were made between 33 patients in the control group and 46 patients with HBC. Compared with patients in the control group, patients in the HBC group presented significantly lower white blood cell counts; hemoglobin, platelet, and albumin levels; and cholinesterase and prothrombin times. Conversely, thrombin times; international normalized ratios; and glutamyl transpeptidase, aspartate aminotransferase, alkaline phosphatase, total bilirubin, direct bilirubin, indirect bilirubin, bile acid, and D-dimer levels were significantly elevated in the HBC group.

    Table 1 Baseline characteristics of the groups

    Comparative analysis of the gut microbiota between the HBC and control groups

    The total length of the sequences read by both forward and reverse double-end sequencing was 500 bp, after which 24 bp molecular markers were subtracted, for a total of 476 bp. Sequences with double-end reads that were correctly spliced and between 382 bp and 442 bp in length were determined to be valid sequences. The average fragment length of all the samples was 410.68 bp.

    The species accumulation curves flattened or reached a plateau, suggesting the sequencing depth basically covered all the species in the sample, and no additional OTUs could be identified by increasing the sequencing data (Fig. 1A). The Shannon‒Wiener curves appeared to plateau, suggesting that the amount of sequencing data was large enough to reflect information about the vast majority of the microbial species in the sample (Fig. 1B).

    In total, 17 phyla, 24 classes, 46 orders, 85 families, and 315 genera were identified. The entire sample contained 2,842 operational taxonomic units (OTUs), of which 1,892 were shared between the two groups. A total of 609 and 341 unique OTUs were identified in the control and HBC groups, respectively (Fig. 2A). The α diversity indices included the Ace, Chao1, Shannon and Simpson indices. The ACE and Chao1 indices are commonly used to assess species richness, and the Shannon and Simpson indices are used to measure species diversity. Analysis of α diversity revealed significantly reduced species richness in the experimental group, evidenced by decreased ACE (p < 0.05), and Chao1 (p < 0.05), indices compared with those in the control group. In contrast, the Simpson and Shannon diversity indices showed no statistically significant intergroup differences (p > 0.05) (Fig. 2B). Principal component analysis (PCA) of the β diversity (Fig. 2C) revealed differences in the composition of the gut microbiota between the two groups (p > 0.05).

    Fig. 1

    Species accumulation curves (A) and Shannon‒Wiener curves (B)

    Fig. 2
    figure 2

    Characteristics of the gut microbiota in the control and HBC groups. A Overall, 2842 OTUs were identified in both groups. The control group had 2501 OTUs, and the HBC group had 2233 OTUs. B α diversity index analysis of the ACE p < 0.05), Chao1 (p < 0.05), Shannon p > 0.05) and Simpson (p > 0.05) indices. C βdiversity analysis via PCA (p > 0.05)

    Compared with the HBC group, the HBC group presented significantly more Bacilli Lactobacillus, Prevotellaceae and Streptococcus and fewer Verrucomicrobiales, Bacteroides and Akkermansia (Table 2).

    Table 2 Differences in the relative abundance of the gut microbiota in the control and HBC groups

    We used the linear discriminant analysis effect size (LEfSe) model to identify microbiota with differential abundances between the groups (Fig. 3). In the control group, Eggerthellaceae, Aeromonadaceae, Bacillaceae, Acidaminococcaceae and Bacteroidaceae were more abundant. Conversely, in the HBC group, Bacilli, Lactobacillales, Streptococcaceae, Veillonellaceae, Micrococcales, Enterobacteriales, Enterobacteriaceae, Micrococcaceae, Gammaproteobacteria and Aeromonadales presented relatively high relative abundances.

    Fig. 3
    figure 3

    Comparison of groups of microflora differences via the LEfSe online tool. A Histogram of the linear discriminant analysis (LDA) scores for differentially abundant genera between the control and HBC groups. B Taxonomic cladogram for significant differences between the control and HBC groups

    Comparative analysis of basic data between the BA-N and BA-H groups

    Bile acid (BA) metabolism is also a key mediator of the liver‒gut axis [6]. We further divided the HBC group into two subgroups on the basis of BA: the BA-N group (n = 24) and the BA-H group (n = 22). The results revealed that as BA levels increased, the Child‒Pugh scores of patients also increased. The duration of antiviral therapy and viral load status were not significantly different between the two groups. Comparative analysis revealed that elevated BA levels were correlated with increased Child‒Pugh scores. Furthermore, progressive BA elevation was associated with increasing levels of WBC, RBC, CHE, ALB and PT%, alongside decreasing levels of ALP, DBIL, BA, PT, APTT, D-DI and INR, indicating progressive disease severity in HBC with BA elevation (Table 3).

    Table 3 Baseline characteristics of the groups

    Comparative analysis of the gut microbiota between the BA-N and BA-H groups

    In the HBC group, 2,233 OTUs were identified, of which 1,805 were shared between the two groups. A total of 260 and 168 unique OTUs were identified in the BA-N and BA-H groups, respectively (Fig. 4A). The α diversity indices ACE (p > 0.05), Chao1 (p > 0.05), Shannon (p < 0.05) and Simpson (p < 0.05) suggested significant differences in the microbial species diversity of the α diversity between the two groups (Fig. 4B). PCA-based β diversity analysis (p < 0.05) revealed significant differences in the microbial community composition (Fig. 4C).

    Fig. 4
    figure 4

    Characteristics of the gut microbiota in the BA-N and BA-H groups. (A) There were 2,219 OTUs in both groups. A total of 260 and 168 unique OTUs were identified in the BA-N and BA-H groups. (B) α diversity index analysis of the ACE (p > 0.05), Chao1 (p > 0.05), Shannon (p < 0.05) and Simpson (p < 0.05). (C) β diversity analysis via PCA (p < 0.05).

    Compared with the BA-N group, the BA-H group presented increased Bacilli, Lactobacillales, Streptococcus, Veillonella and Enterobacteriaceae and decreased Clostridiales. Akkermansiaceae had a decrease in mean relative abundance, although this reduction did not reach statistical significance (p > 0.05) (Table 4).

    Table 4 Differences in the relative abundance of the gut microbiota in the BA-N and BA-H groups

    Using the LEfSe model, we identified microbiota with differential abundances between the BA-N and BA-H groups (Fig. 5). Clostridia and Clostridiales were more abundant in the BA-N group, whereas Aeromonadaceae, Enterobacteriales, Streptococcaceae, Bacilli and Lactobacillales were more abundant in the BA-H group.

    Fig. 5
    figure 5

    Comparison of differences in the microflora via the LEfSe online tool. A Histogram of the linear discriminant analysis (LDA) scores for differentially abundant genera between the BA-N and BN-H groups. B Taxonomic cladogram for significant differences between the BA-N and BN-H groups

    Continue Reading

  • Chronic Respiratory Diseases Linked to Other Noncommunicable Diseases in Vulnerable Countries

    Chronic Respiratory Diseases Linked to Other Noncommunicable Diseases in Vulnerable Countries

    Despite their devastating global impact, chronic respiratory diseases remain a hidden threat in low- and middle-income countries, often going undiagnosed in adults who are already battling other noncommunicable diseases. | Image Credit: Tipapat – stock.adobe.com

    Chronic respiratory diseases (CRDs) are present in adults with other noncommunicable diseases (NCDs) in low- and middle-income countries (LMICs), but the overall prevalence varies depending on the specific NCD studied, according to a study published in BMC Pulmonary Medicine.1

    Asthma, chronic obstructive pulmonary disease (COPD), and occupational lung diseases are among some of the most common CRDs.2 Around 2 billion people are exposed to toxic biomass fuels, while another 1 billion are impacted by outdoor air pollution. An additional 1 billion smokers expose a similar number of people to harmful secondhand smoke, contributing to the roughly 4 million premature deaths from CRDs each year.

    Oftentimes, CRDs occur in combination with other NCDs because of shared factors like socioeconomic disadvantage, noxious respiratory exposures, and aging.1 It is predicted that the most prevalent NCD will lead to global economic losses totaling $47 trillion by 2030.

    “This review aims to identify the prevalence of CRD and/or abnormal spirometry results identified through case-finding tools in adults with NCD living in LMIC,” study authors stated.

    After an initial screening of 8939 studies, researchers narrowed their focus to 13 for a more detailed review. Of those, 9 were ultimately excluded for various reasons, including 5 that lacked sufficient data, 2 that had inadequate outcome measurements, 2 that were conducted in developing countries, and 1 that included patients who had already been diagnosed with COPD.

    Only 3 studies met the inclusion criteria, with 1 from India and 2 from Brazil. There were 2 of these studies that used convenience sampling, including 255 people, while the third recruited 1162 participants from the general population at Basic Health Units. Spirometry was the primary diagnostic tool in 2 studies, while the third used a combination of case-finding tools.

    Researchers in the review analyzed a study of 1162 adults with hypertension in Brazil and found that 12 also had undiagnosed asthma (95% CI, 0.59-1.9), 19 had asthma-COPD overlap (95% CI, 1.0-2.5), and 60 had undiagnosed COPD (95% CI, 4.0-6.6). The average age of the participants was 62.3 years, and about a third were men (32.5%).

    In a study from the review, researchers performed spirometry on 50 patients with end-stage kidney disease at a tertiary hospital. The average age of the participants was 45.8 years, and 64% were men. The results showed that 41 people had restrictive spirometry (95% CI, 69.2-90.2), and 3 had obstructive or mixed spirometry (95% CI, 2.0-16.2).

    In a separate study of 205 patients being evaluated for coronary artery disease, 23 met the criteria for COPD (95% CI, 7.5-16.2), and 35 showed impaired spirometry (95% CI, 12.5-22.8) with a preserved ratio. The majority of participants were men (55%), but the average age was not reported.

    The high prevalence of NCDs in LMICs places a heavy burden on already struggling economies, often pushing families and communities into poverty.3 Preventing these diseases requires a comprehensive approach, including policies that acknowledge their devastating societal effects. Public health experts must build alliances with diverse sectors and work with policymakers to ensure these policies are implemented. Still, proposing large-scale policy changes remains difficult without carefully considering their potential impact on affected populations and the specific policy environment.

    The review has several limitations, starting with its small sample size.1 The researchers were only able to include 3 studies, all from a limited geographical area, which restricts the findings from being generalized to other LMICs. Additionally, the original articles did not include 95% confidence intervals for prevalence estimates, so these had to be calculated from the provided data. The review also excluded unpublished “grey literature” and studies that were not available in full text. Finally, the use of artificial intelligence models was an unexpected part of the study’s process and was not included in the initial registration.

    “Future research should aim to expand geographical coverage and methodological quality, while further exploring the interplay between NCDs and CRDs to inform targeted screening and early intervention strategies in LMIC,” study authors concluded.

    References

    1. Petrolini-Mateus A, Araujo GHG, Schafauser-Segundo NS, et al. Prevalence of chronic respiratory disease using case-finding tools in adults living with noncommunicable disease in low- and middle-income countries: a systematic review. BMC Pulm Med. 2025;25(1). doi:10.1186/s12890-025-03697-8
    2. Soriano JB, Kendrick PJ, Paulson KR, et al. Prevalence and attributable health burden of chronic respiratory diseases, 1990–2017: a systematic analysis for the Global Burden of Disease Study 2017. Lancet Respir Med. 2020;8(6):585-596. doi:10.1016/S2213-2600(20)30105-3
    3. Ndubuisi NE. Noncommunicable diseases prevention in low- and middle-income countries: an overview of health in all policies (HiAP). Inquiry. 2021;58:46958020927885. doi:10.1177/0046958020927885

    Continue Reading

  • Millions of women get UTIs each year. An antibiotic 30 years in the making is finally offering hope.

    Millions of women get UTIs each year. An antibiotic 30 years in the making is finally offering hope.

    Most UTIs, or urinary tract infections, are anything but subtle. When you’ve got one, you constantly feel like you need to pee even if you just went, it burns when you go and your urine looks suspiciously cloudy. UTIs are also quite common: More than 50% of women will deal with at least one in their lifetime, and what’s worse is that these infections can come back in a matter of months. Treating them has also become trickier. That’s because there’s a growing number of antibiotic-resistant UTIs, meaning the drugs commonly used to kill the bacteria behind the infection no longer work as well.

    “Not only are these infections painful and unpleasant, they are becoming more difficult to treat,” says Dr. Cynthia DeTata, an ob-gyn at Stanford Medicine Children’s Health and a clinical assistant professor in maternal-fetal medicine at Stanford Medicine, tells Yahoo. She explains that the most common cause of antibiotic resistance is taking the medications improperly, such as not finishing the entire course of pills as prescribed. “Partially treating an infection allows rebound growth of bacteria that are now resistant to that antibiotic,” she explains.

    Experts say there’s an increasing need for new treatments to get UTIs back under control. The challenge? “The last time a new antibiotic was approved for an uncomplicated UTI was 30 years ago. Our treatments have remained unchanged, while bacteria have continued to evolve,” Dr. Gil Weiss, an ob-gyn at the Association for Women’s Health Care and assistant professor of clinical medicine in the department of obstetrics and gynecology at Northwestern Memorial Hospital in Chicago, tells Yahoo.

    Now for some good news: There’s a new antibiotic on the market called gepotidacin (sold under the brand name Blujepa) that gives doctors a new way to fight pesky UTIs. It’s the first new class of antibiotics since the 1990s, and experts say it can help treat UTIs with a lower risk of resistance.

    The problem: While there are effective drugs for UTIs, antibiotic-resistant infections are making them harder to treat.

    By the numbers: UTIs affect up to 16 million women in the U.S. annually, and for 30 to 44% of them, the infection will come back in a matter of months. Studies suggest that 92% of bacteria behind UTIs are resistant to at least one antibiotic, and nearly 80% don’t respond to at least two antibiotics.

    The solution: In March 2025, the Food and Drug Administration approved gepotidacin to treat uncomplicated UTIs. (Drugs Pivya and Orlynvah were approved in 2024 to treat UTIs, but they fall into existing antibiotic classes.) “Gepotidacin is part of a new class of antibiotics called triazaacenaphthylenes,” DeTata says. “This class is so new that currently, gepotidacin is the only one in it.”

    Antibiotics fight bacteria in two main ways: They can kill bacteria (bactericidal) or they can prevent them from multiplying (bacteriostatic), says DeTata. For example, some antibiotics interfere with the formation of bacteria cell walls, causing the wall to burst and killing the bacteria, while others disrupt the synthesis of proteins, which bacteria need to survive. “Gepotidacin works in an entirely new way by acting on enzymes called topoisomerases, leading to breaks in the DNA strands of bacteria,” DeTata says. “So gepotidacin is bactericidal, as these breaks in the DNA strands kill the bacteria.”

    The drug’s main side effects in clinical trials were diarrhea (16% of participants) and nausea (9%), both which are common side effects for antibiotics in general. The research also found that gepotidacin performs just as well as (if not better than) nitrofurantoin, which is a frontline treatment for UTIs.

    Added bonus: Gepotidacin “has the potential to be used for the treatment of gonorrhea, which has also been difficult to treat due to multi-antibiotic resistance,” says DeTata.

    For Weiss and many other doctors, having a new treatment option for UTIs is something to celebrate. “I’m very excited that a new medication has come to market,” he says. “Any new medication for something so common is a win-win situation.”

    Continue Reading