Glaucoma, often referred to as the “silent thief of sight” is because it damages the…
Category: 6. Health
-

Homer1 gene discovery could lead to new ADHD therapies
A new study published has demonstrated that reducing background brain activity can sharpen attention, identifying the Homer1 gene as key to developing new targeted treatments for ADHD and related disorders.

Attention disorders…
Continue Reading
-
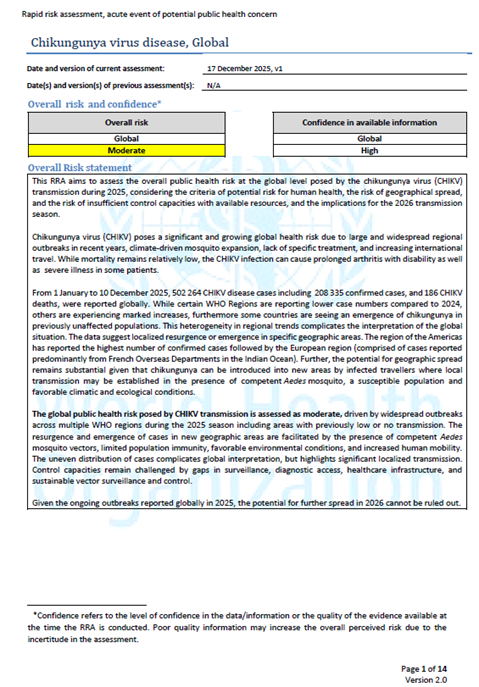
WHO Rapid Risk Assessment – Chikungunya virus, Global v.1
Overview
This Rapid Risk Assessment (RRA) aims to assess the risk of chikungunya virus at the global level, considering the public health impact, the risk of geographical spread and the risk of insufficient control capacities with…
Continue Reading
-

Neuroscientist suggests 3 simple brushing-time habits that may help lower dementia risk |
There are many ways that daily routines might actually help the cognitive brain. In an Instagram reel, neuroscientist Jules has recently emphasised a few practices that might easily be implemented in the seemingly monotonous exercise of…
Continue Reading
-

Vixarelimab Advances Treatment for Prurigo Nodularis
VIXARELIMAB, a monoclonal antibody targeting the oncostatin M receptor β, demonstrated significant and sustained clinical benefit in patients with moderate to severe prurigo nodularis (PN), according to results from a phase 2b randomised…
Continue Reading
-

Common food group can prevent Type 2 diabetes, Alzheimer’s and ALS: Here’s the research
Calcium is one of the most important minerals for body as…
Continue Reading
-

A-Listers inspire surge in Brits opting for pescatarian-style diets
The eating habits of celebrities including Harry Styles, Victoria Beckham, Natalie Portman and Amanda Holden are sparking a surge in pescatarian-style diets among UK consumers this January, according to new research from Young’s…
Continue Reading