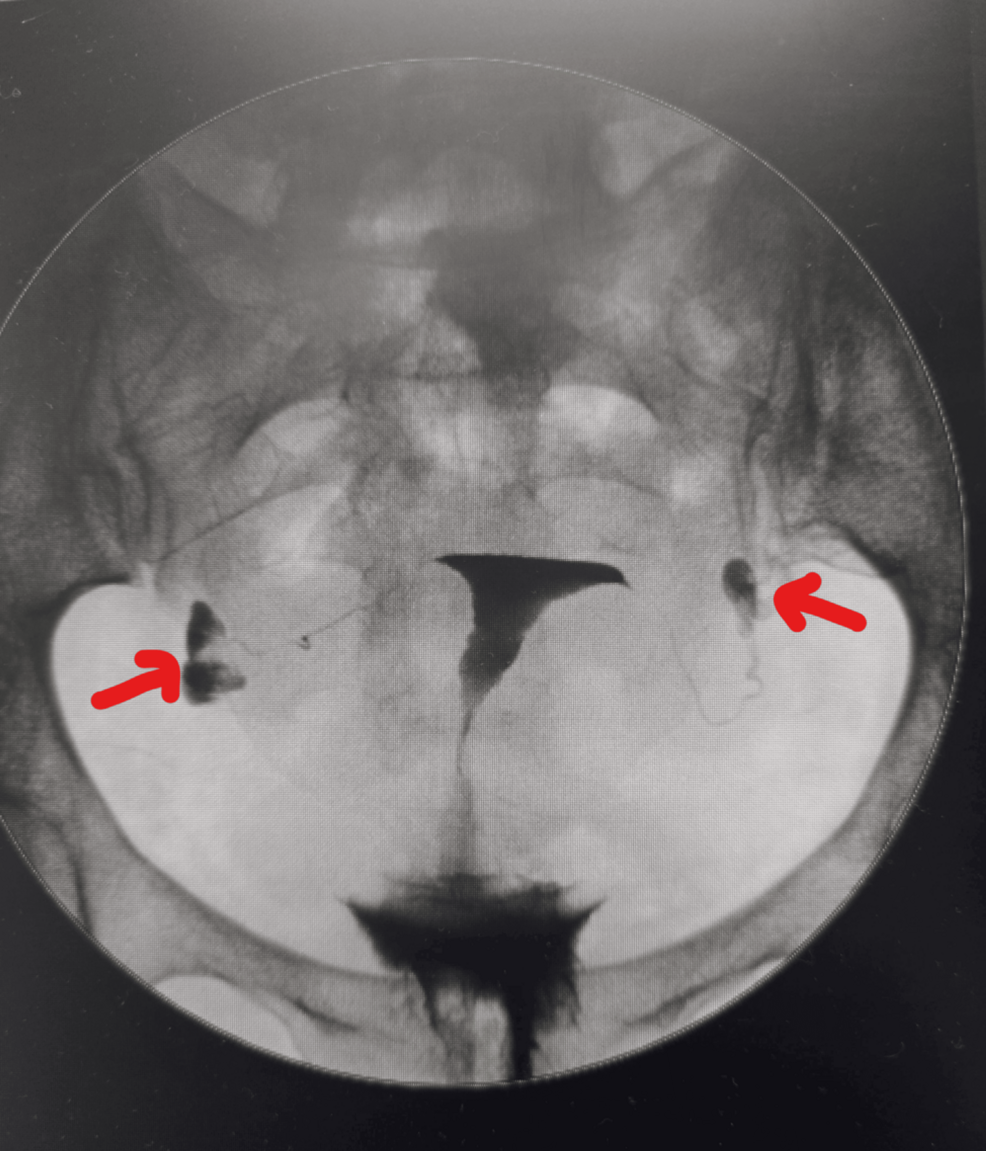
When patients ask, “What is the testicular cancer cure rate?”, the answer is reassuring. More than 95% of all patients are cured, and for many, treatment leads to a normal life expectancy. These excellent outcomes reflect…
Category: 6. Health
-
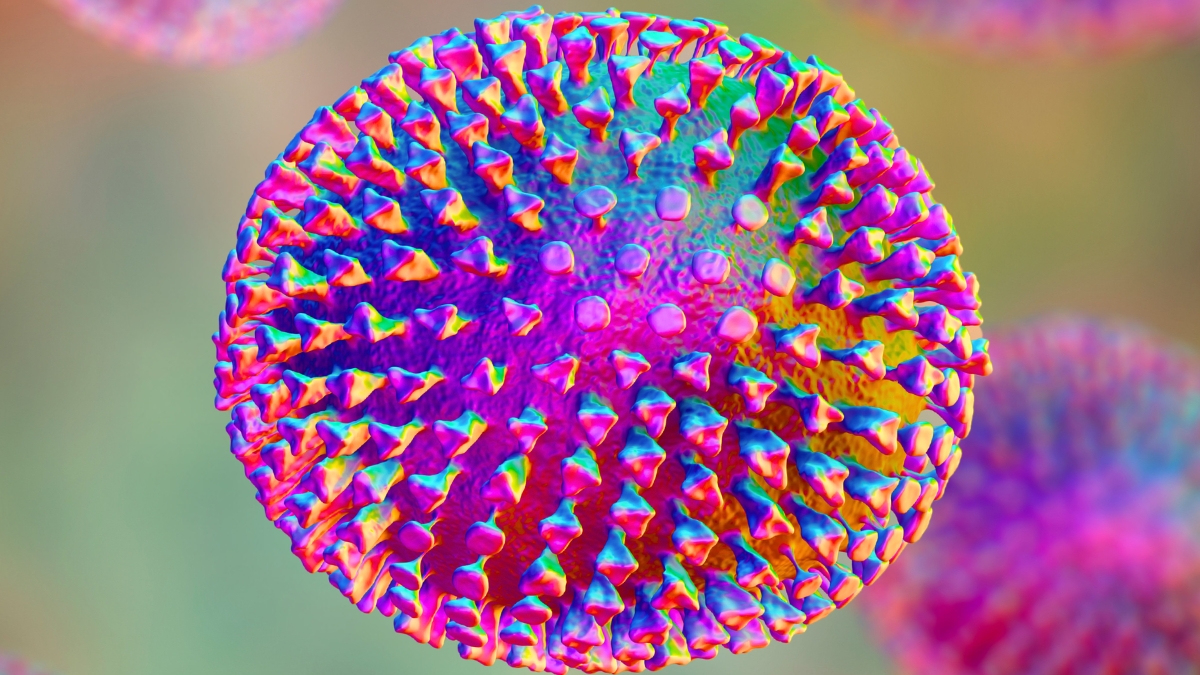
The World Is Sleeping on Bird Flu, Expert Warns : ScienceAlert
There’s an unwritten rule in publishing, or so I’ve been told: Don’t write about COVID. Our collective attention span has been saturated by those endless months holed up in attics and cramped corners of apartments, staring out at a world we…
Continue Reading
-
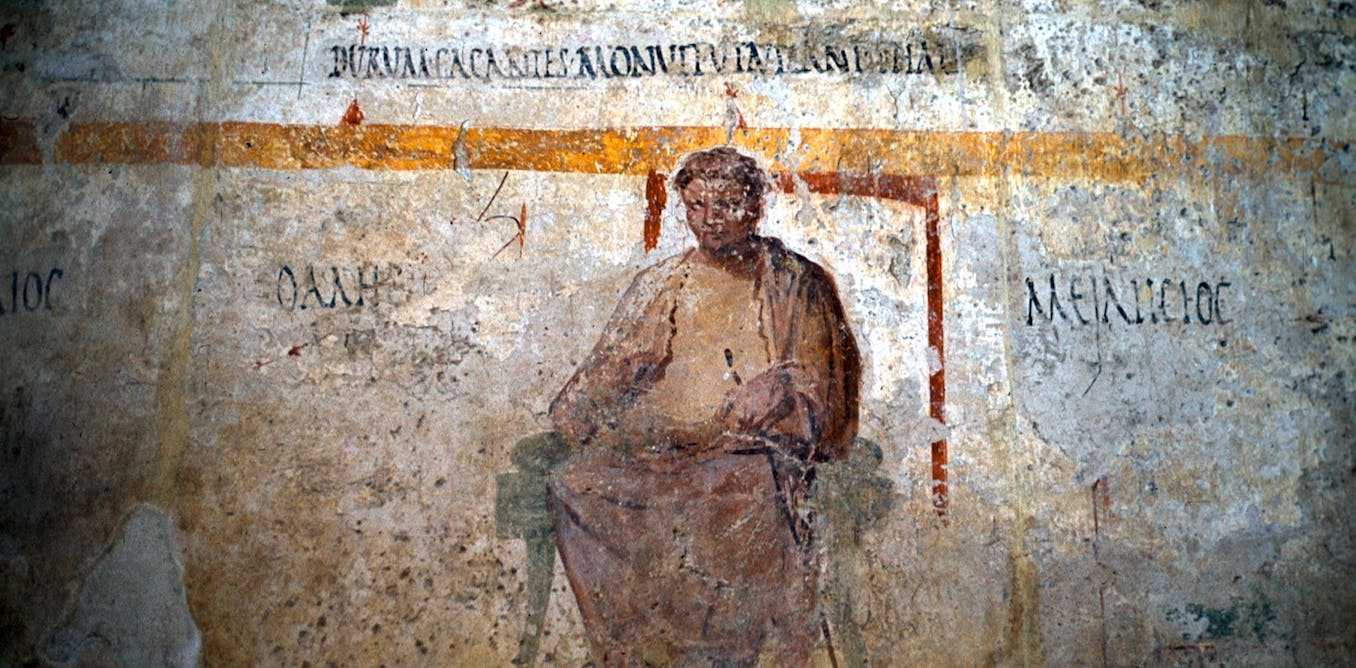
5 lessons about misinformation from ancient Greek and Roman scientists
Ancient scientists can be easy to dismiss.
Greek philosopher Thales of Miletus, often described as the West’s first scientist, believed the whole Earth was suspended on water. Roman encyclopaedist Pliny the Elder recommended entrails,…
Continue Reading
-

How Each Root Vegetable Supports Your Health
Not only are the colors and textures of parsnips and carrots different, but their nutritional makeup also varies. Parsnips are higher in carbs and folate, while carrots are packed with vitamin A. Here is what you need to know about the…
Continue Reading