
Winning the world’s health lottery is a lonely business in the current climate. “It’s like being an orphan in a space where there used to be many kids playing – suddenly everybody’s gone and you’re just there with a ball,” says Dr…
Category: 6. Health
-

Measles Outbreak Challenges States
Measles cases continue to rise amid holiday preparations and celebrations, inciting an increasing need for infection control and prevention protocols. Recently, South…
Continue Reading
-

Integrating the genome and exposome for precision health in Kuwait – News
Pedestrians cross a road amidst a severe dust storm in Kuwait City on May 23, 2022.YASSER AL-ZAYYAT/AFP via Getty Images
In the heart of the Arabian…
Continue Reading
-
Saffron as a natural modulator of reverse cholesterol transport genes in atherosclerotic rabbits, with molecular docking insights
Nedkoff, L., Briffa, T., Zemedikun, D., Herrington, S. & Wright, L. F Global trends in atherosclerotic cardiovascular disease. Clin. Ther. 45 (11), 1087–1091 (2024).
Megan, L. et al. E. LK,….
Continue Reading
-
Maternal RSVpreF Vaccination Reduces Hospitalization Risk in Infants
Real-world data show maternal vaccination with the respiratory syncytial virus pre-fusion F (RSVpreF) vaccine is associated with a substantial reduction in hospitalizations among young infants, according to study findings…
Continue Reading
-

High-Dose Rifampin Not Beneficial for Tuberculosis Meningitis
HealthDay News — No benefit of high-dose versus standard-dose rifampin is seen among adults with tuberculosis meningitis, according to a study published online Dec. 17 in the New England Journal of…
Continue Reading
-
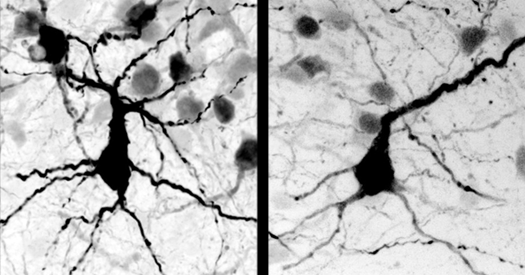
Autism in Kenya, organoid research, and more
Autism in Kenya, organoid research: In this week’s roundup, check out several papers on autism-linked genes, including PTEN, MECP2 and SYNGAP1. The list also includes a new paper documenting the prevalence of neurodevelopmental…
Continue Reading
-
The world risks forgetting one of humanity's greatest triumphs as polio nears global eradication – Medical Xpress
- The world risks forgetting one of humanity’s greatest triumphs as polio nears global eradication Medical Xpress
- The Conversation | Carl Kurlander | The world risks forgetting one of humanity’s greatest triumphs as polio nears global eradication
Continue Reading
-

Wearable AI device detects early signs of frailty in older adults
University of Arizona researchers in the Gutruf Lab have developed a comfortable, easy-to-use wearable device that incorporates artificial intelligence to detect subtle warning signs of frailty, signifying a leap forward in elderly…
Continue Reading
-
Menopause hormone therapy not linked to dementia risk in women
A major review of prior research has found no evidence that menopause hormone therapy either increases or decreases dementia risk in post-menopausal women, in a new study led by University College London (UCL) researchers.
The…
Continue Reading