- PSMA-PET Cuts Need for Biopsy in Suspected Prostate Cancer MedPage Today
- Prostate cancer scans make cells glow: can eliminate invasive biopsies and false diagnoses valleyvanguardonline.com
- EAU 2026: AI Support Enhances Prostate Cancer Biopsy…
Category: 6. Health
-
PSMA-PET Cuts Need for Biopsy in Suspected Prostate Cancer – MedPage Today
-
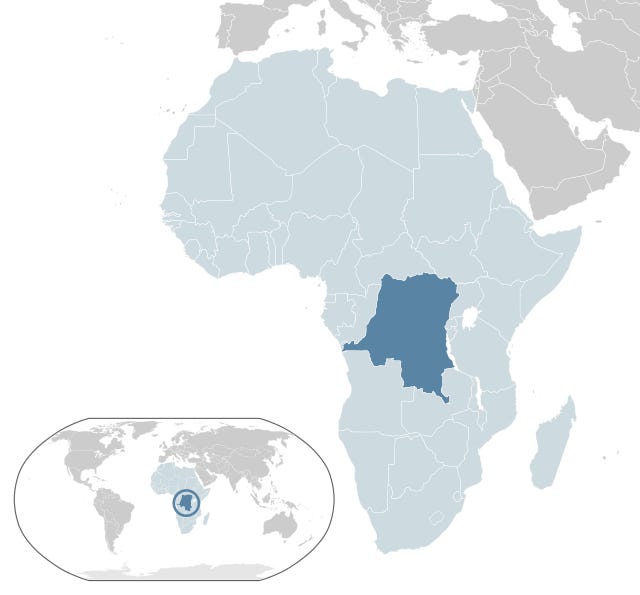
Bacterial meningitis outbreak reported in Kongo Central province, DRC
The Democratic Republic of the Congo (DRC) Ministry of Health (MOH) reports a bacterial meningitis outbreak in Mangembo health zone, Kongo Central province in late February.
The outbreak was initially detected among secondary school students,…
Continue Reading
-

DARE Trial: Phase II Study of ctDNA-Guided Intervention in ER+/HER2− Early Breast Cancer — Investigator Perspective
In estrogen receptor–positive, HER2-negative early breast cancer, disease recurrence may occur many years after initial diagnosis despite completion of standard adjuvant therapy. Circulating tumor DNA (ctDNA) monitoring has…
Continue Reading
-
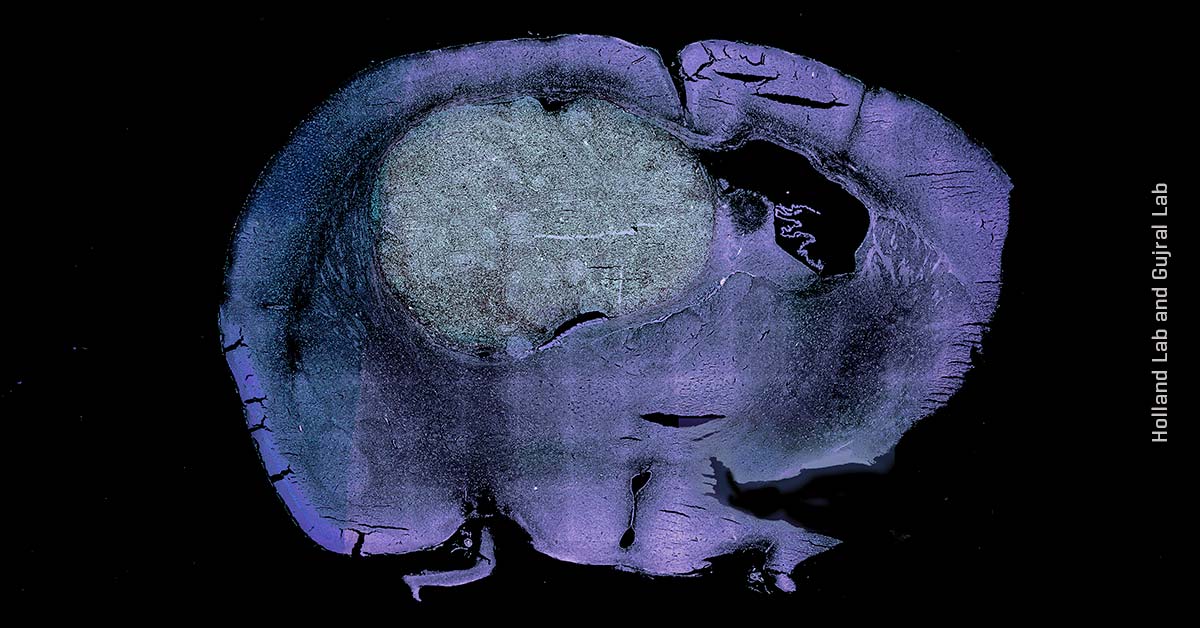
Fred Hutch collaboration reveals molecular vulnerability in rare childhood brain cancer
When broken strands of DNA get repaired improperly, they can stitch together in new “Frankengene” fusions that can cause cancer.
Researchers from two labs in the Human Biology division at Fred Hutch Cancer Center are working together to…
Continue Reading
-

New polygenic risk scores improve prediction of metabolic disease outcomes
Type 2 diabetes (T2D) and obesity are metabolic conditions with many causes, including overlapping and distinct genetic features. A polygenic risk score (PRS) can capture multiple genetic risk factors to provide an estimate for…
Continue Reading
-
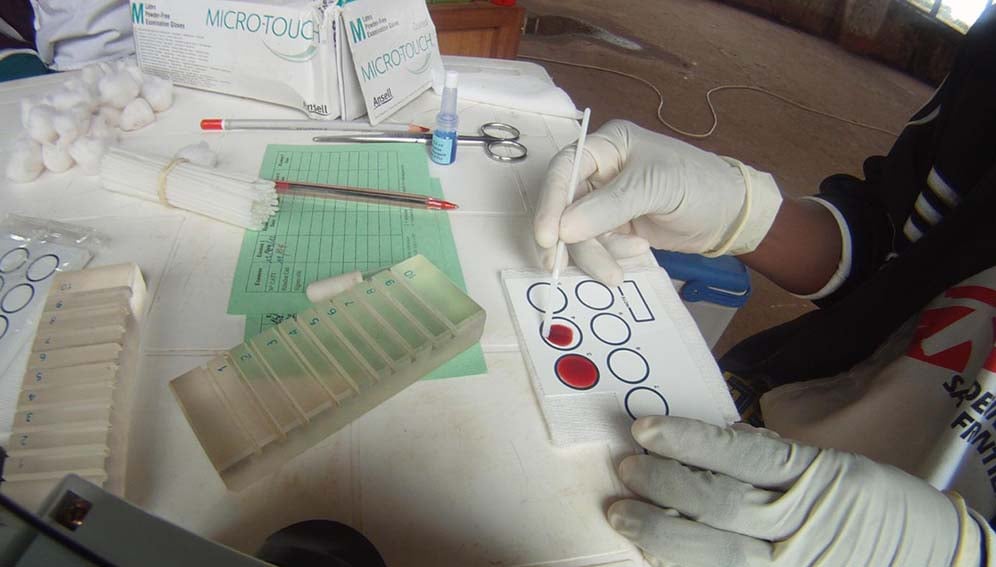
Why sleeping sickness pill is raising hopes in Africa
[NAIROBI, SciDev.Net] Sleeping sickness has been killing people across Africa for generations. A disease with no vaccine, spread by the bite of a tsetse fly, it was once treated with injections of an arsenic derivative, a cure that could be as…
Continue Reading
-

Meningitis outbreak live: Students queue for antibiotics as tribute paid to teenager who died in Kent
Vaccines and meningitis – what we knowpublished at 11:51 GMT
Malu Cursino
Live reporterLast October, the government warned that, external vaccinations offer “crucial protection” against meningitis. The remarks were made as the UK…
Continue Reading
-

Council for Responsible Nutrition says nutrition is foundational for health care
There is a growing scientific consensus that nutrition should be recognized as a foundational component of health care — alongside medications, procedures, and diagnostics — which is underscored in a new report by the Council for Responsible…
Continue Reading