Researchers have found that live bacteria from the gut can travel directly into the brain when a high-fat diet weakens the intestinal barrier.
The discovery reveals a previously unknown route linking gut microbes to neurological health and…
Researchers have found that live bacteria from the gut can travel directly into the brain when a high-fat diet weakens the intestinal barrier.
The discovery reveals a previously unknown route linking gut microbes to neurological health and…

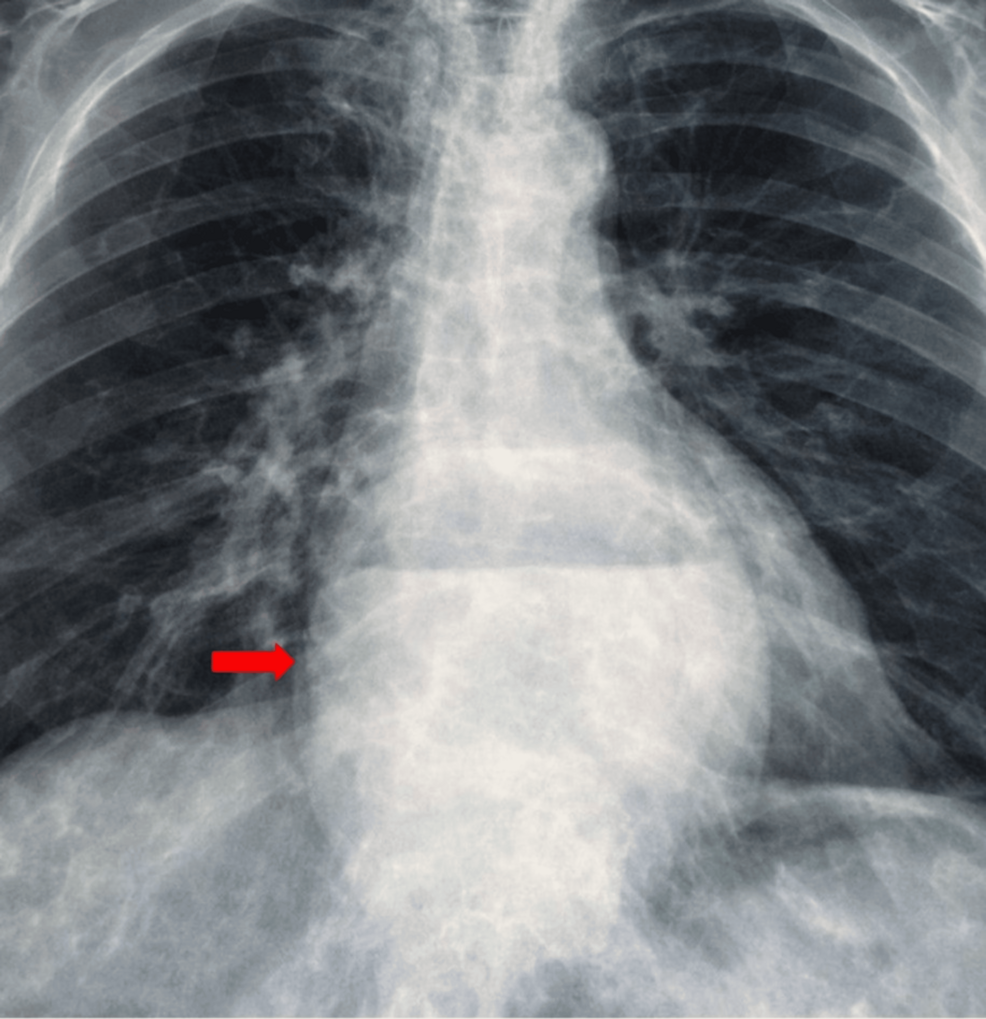
The Health Ministry issued a public warning after a person carrying the measles virus attended the central synagogue in the Shikun Heh neighborhood on Zevulun Hammer Street in Bnei Brak.
According to the ministry, the individual was present at the…
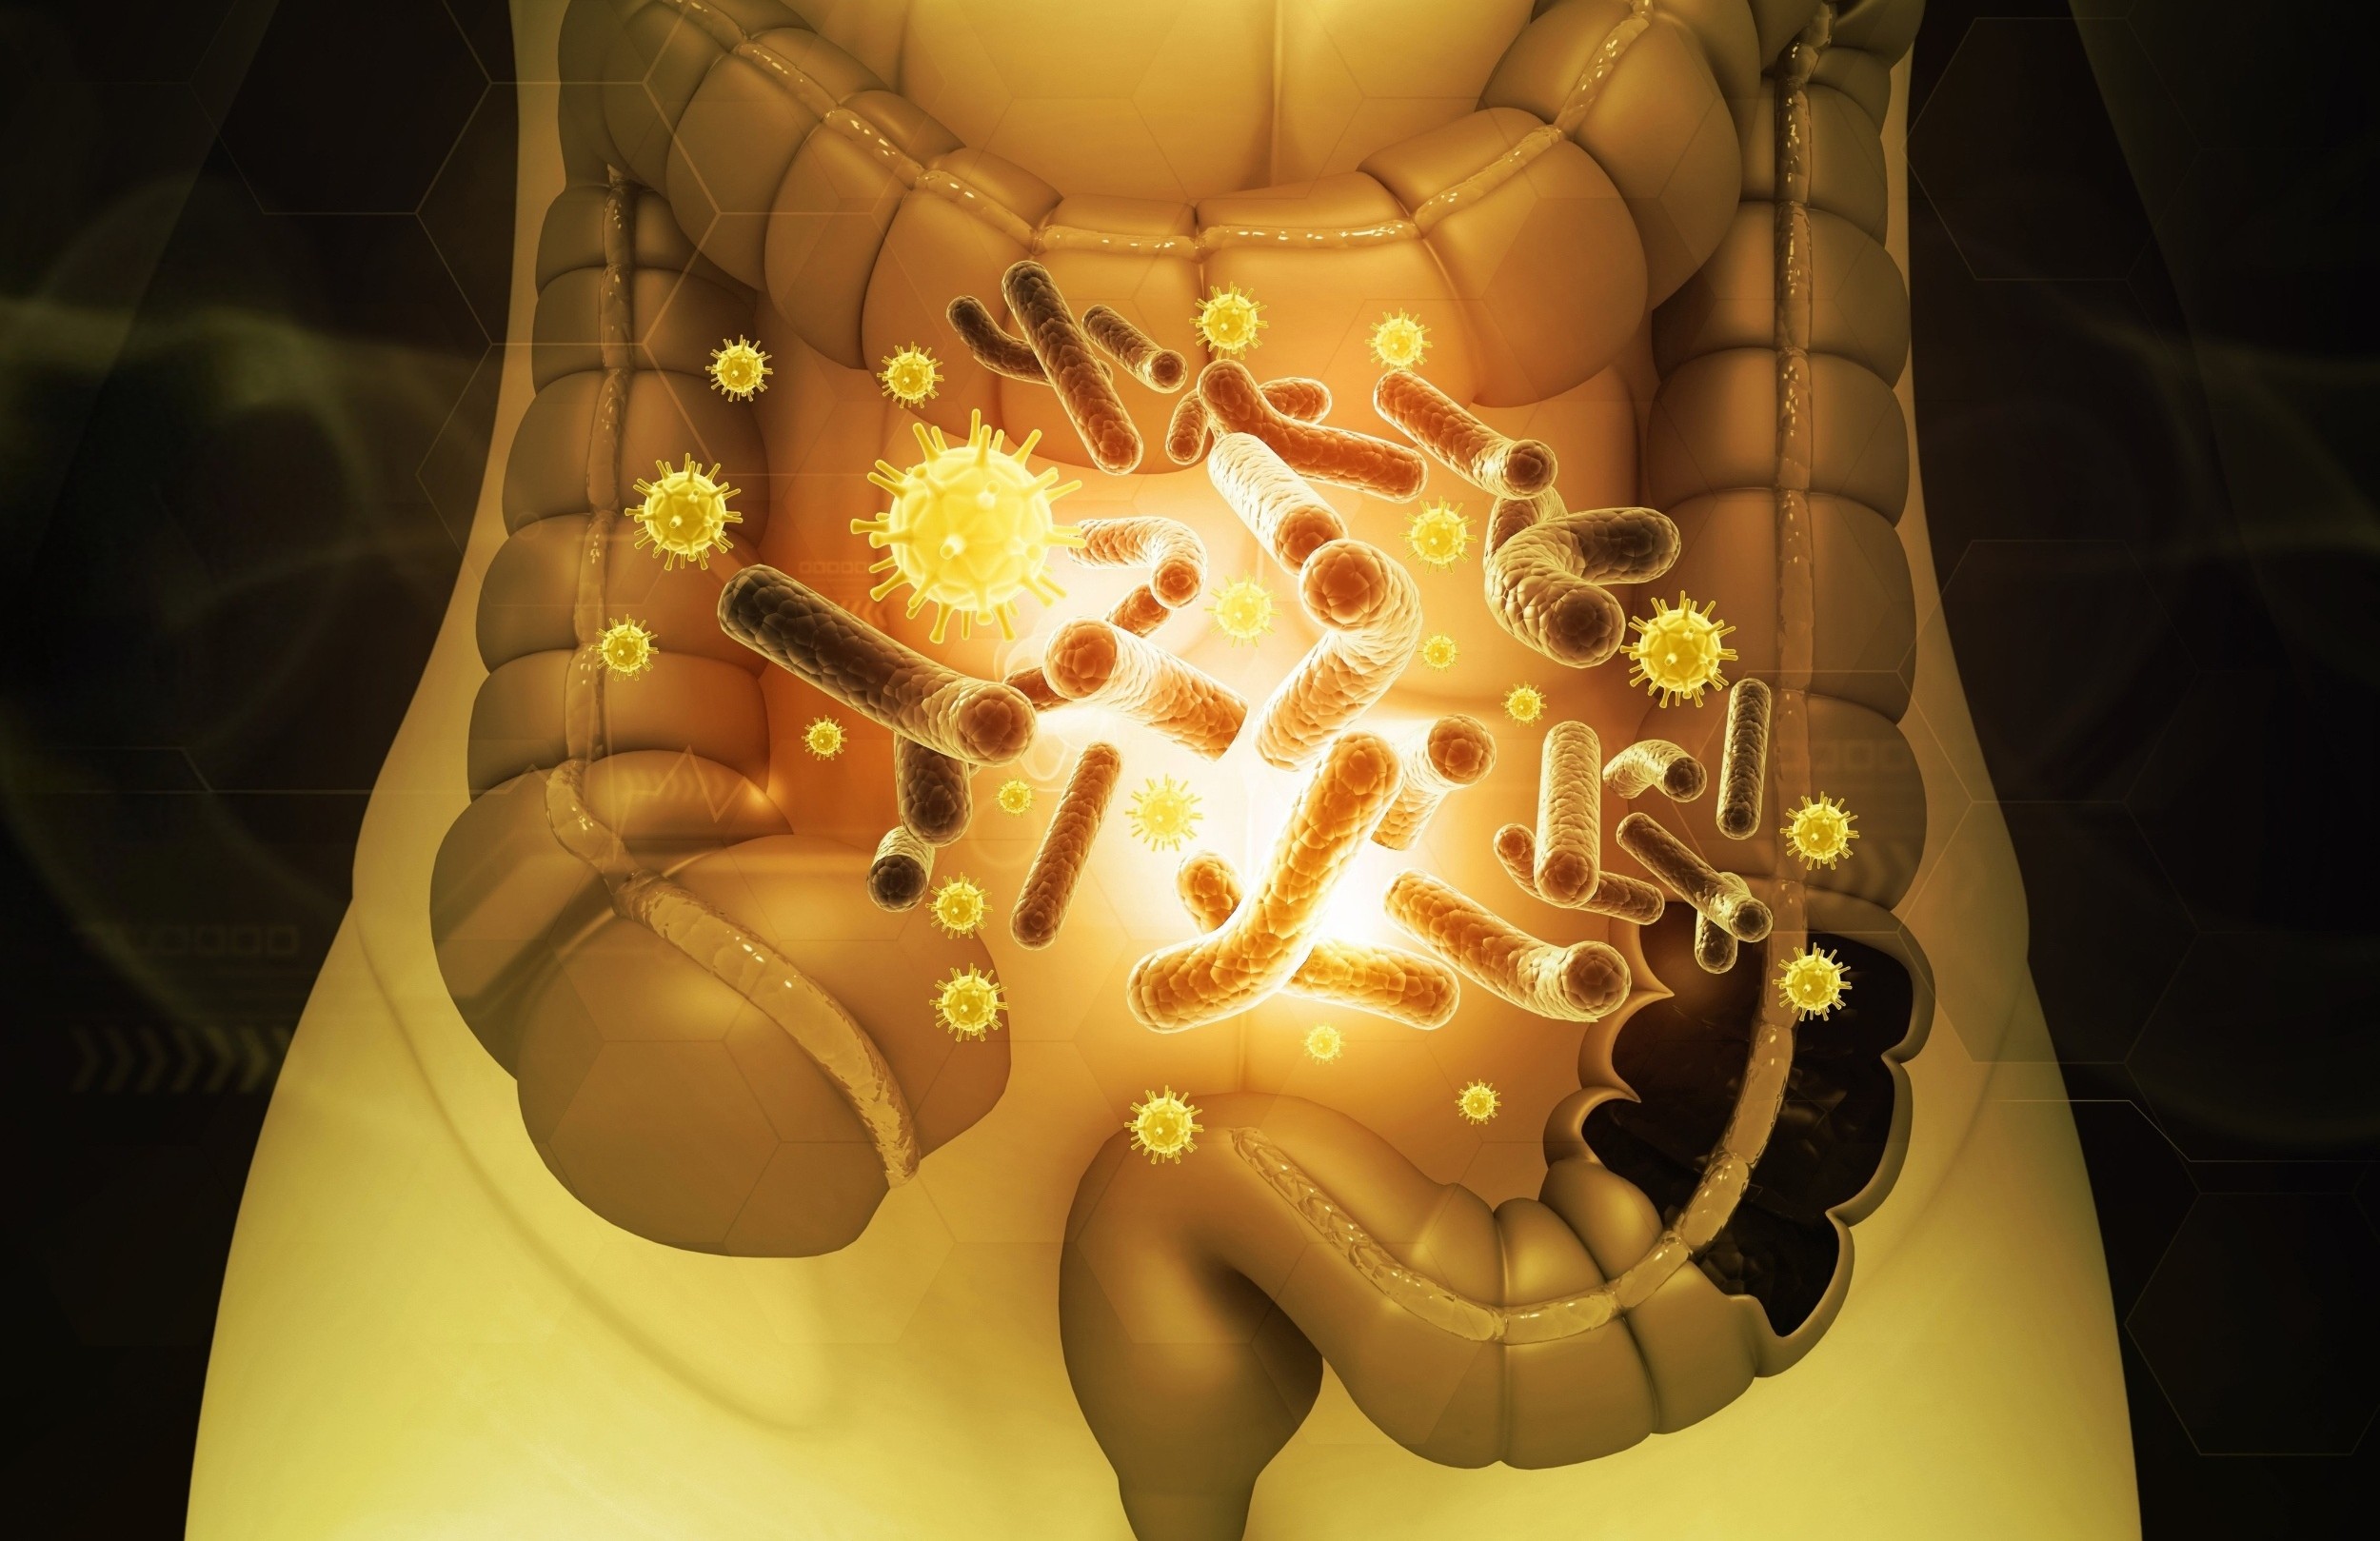
Tiny microbes live in the human gut. They help digest food, support the immune system, and affect how the body uses energy. Scientists now think they may also influence muscle strength.
Muscles often weaken with age. Exercise and diet help, but…

In 2024, Sydney tech entrepreneur Paul Conyngham found out his dog Rosie had cancer. But after attacking the diagnosis with chemotherapy and surgery, the tumors persisted and Rosie got sicker.
So he turned to AI and eventually developed a…

Researchers have found that extracts from the South African kanna plant, a small succulent long used in traditional medicine, can alter key brain signals across multiple regions of the brain.
The discovery suggests that certain versions of this…
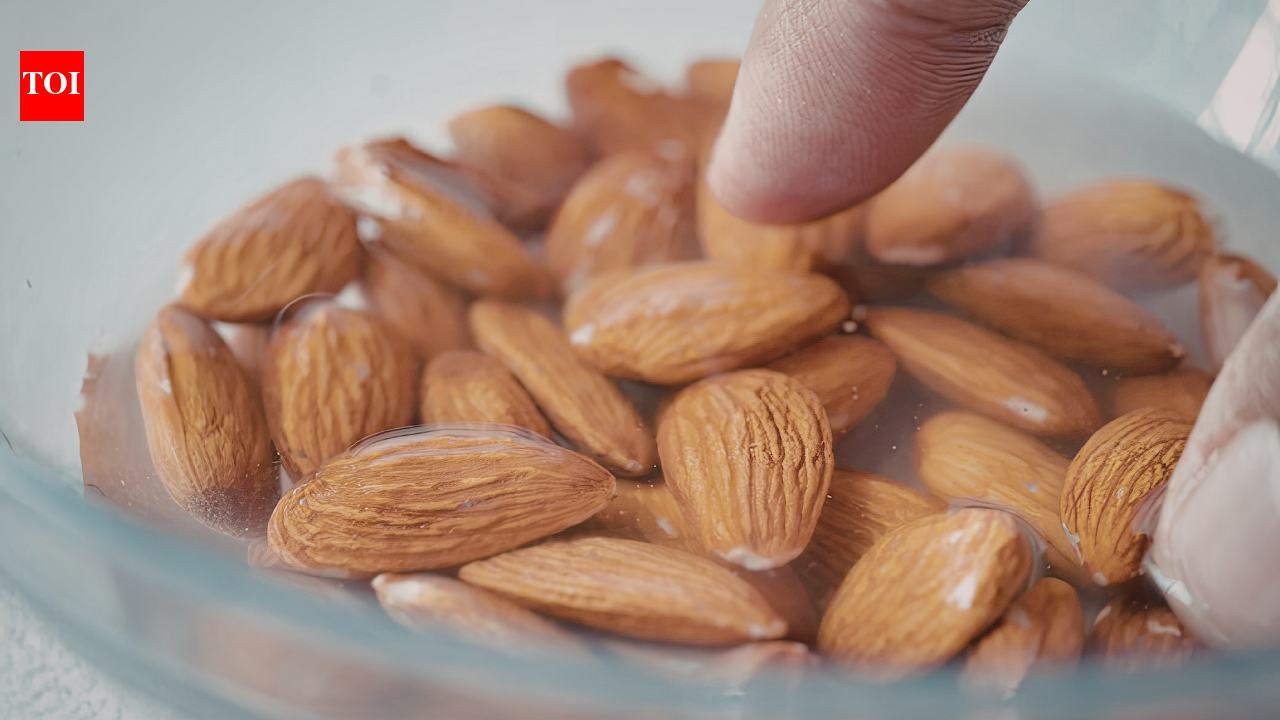
The process is simple and takes less than a minute.
Take 5-8 raw almonds.
Place them in a bowl of clean water before bedtime.
Let them soak for 7-8 hours overnight.
In the morning, peel the skin if desired and eat them on an empty stomach.
People with…

ANAPHYLAXIS is a life-threatening allergic emergency, yet adrenaline auto-injectors remain underused as a treatment option, prompting renewed interest in developing improved devices. A new survey of allergy-trained physicians across Europe has…

Almost seven years into his retirement, David Bulteel should be enjoying the fruits of his 40-year career in the City. On paper, he has the lot: a tidy pension, delightful grandkids, a big house in the Buckinghamshire commuter belt. He’s…