
Good sleep is one of the most important pillars of overall wellbeing. Getting enough sleep and good sleep quality can play an important role in your weight, emotional wellbeing, blood pressure, diabetes, mental and physical performance, and…
Category: 6. Health
-

Living with stigma, state inaction: What it’s like for some of Indonesia’s HIV-positive kids
December 15, 2025
SOLO, CENTRAL JAVA – The squat, one-storey school building near the Bengawan Solo (Solo River) appears unremarkable from the outside. Inside, rows of bunk beds line former classrooms, the blackboards and chalk replaced with…
Continue Reading
-
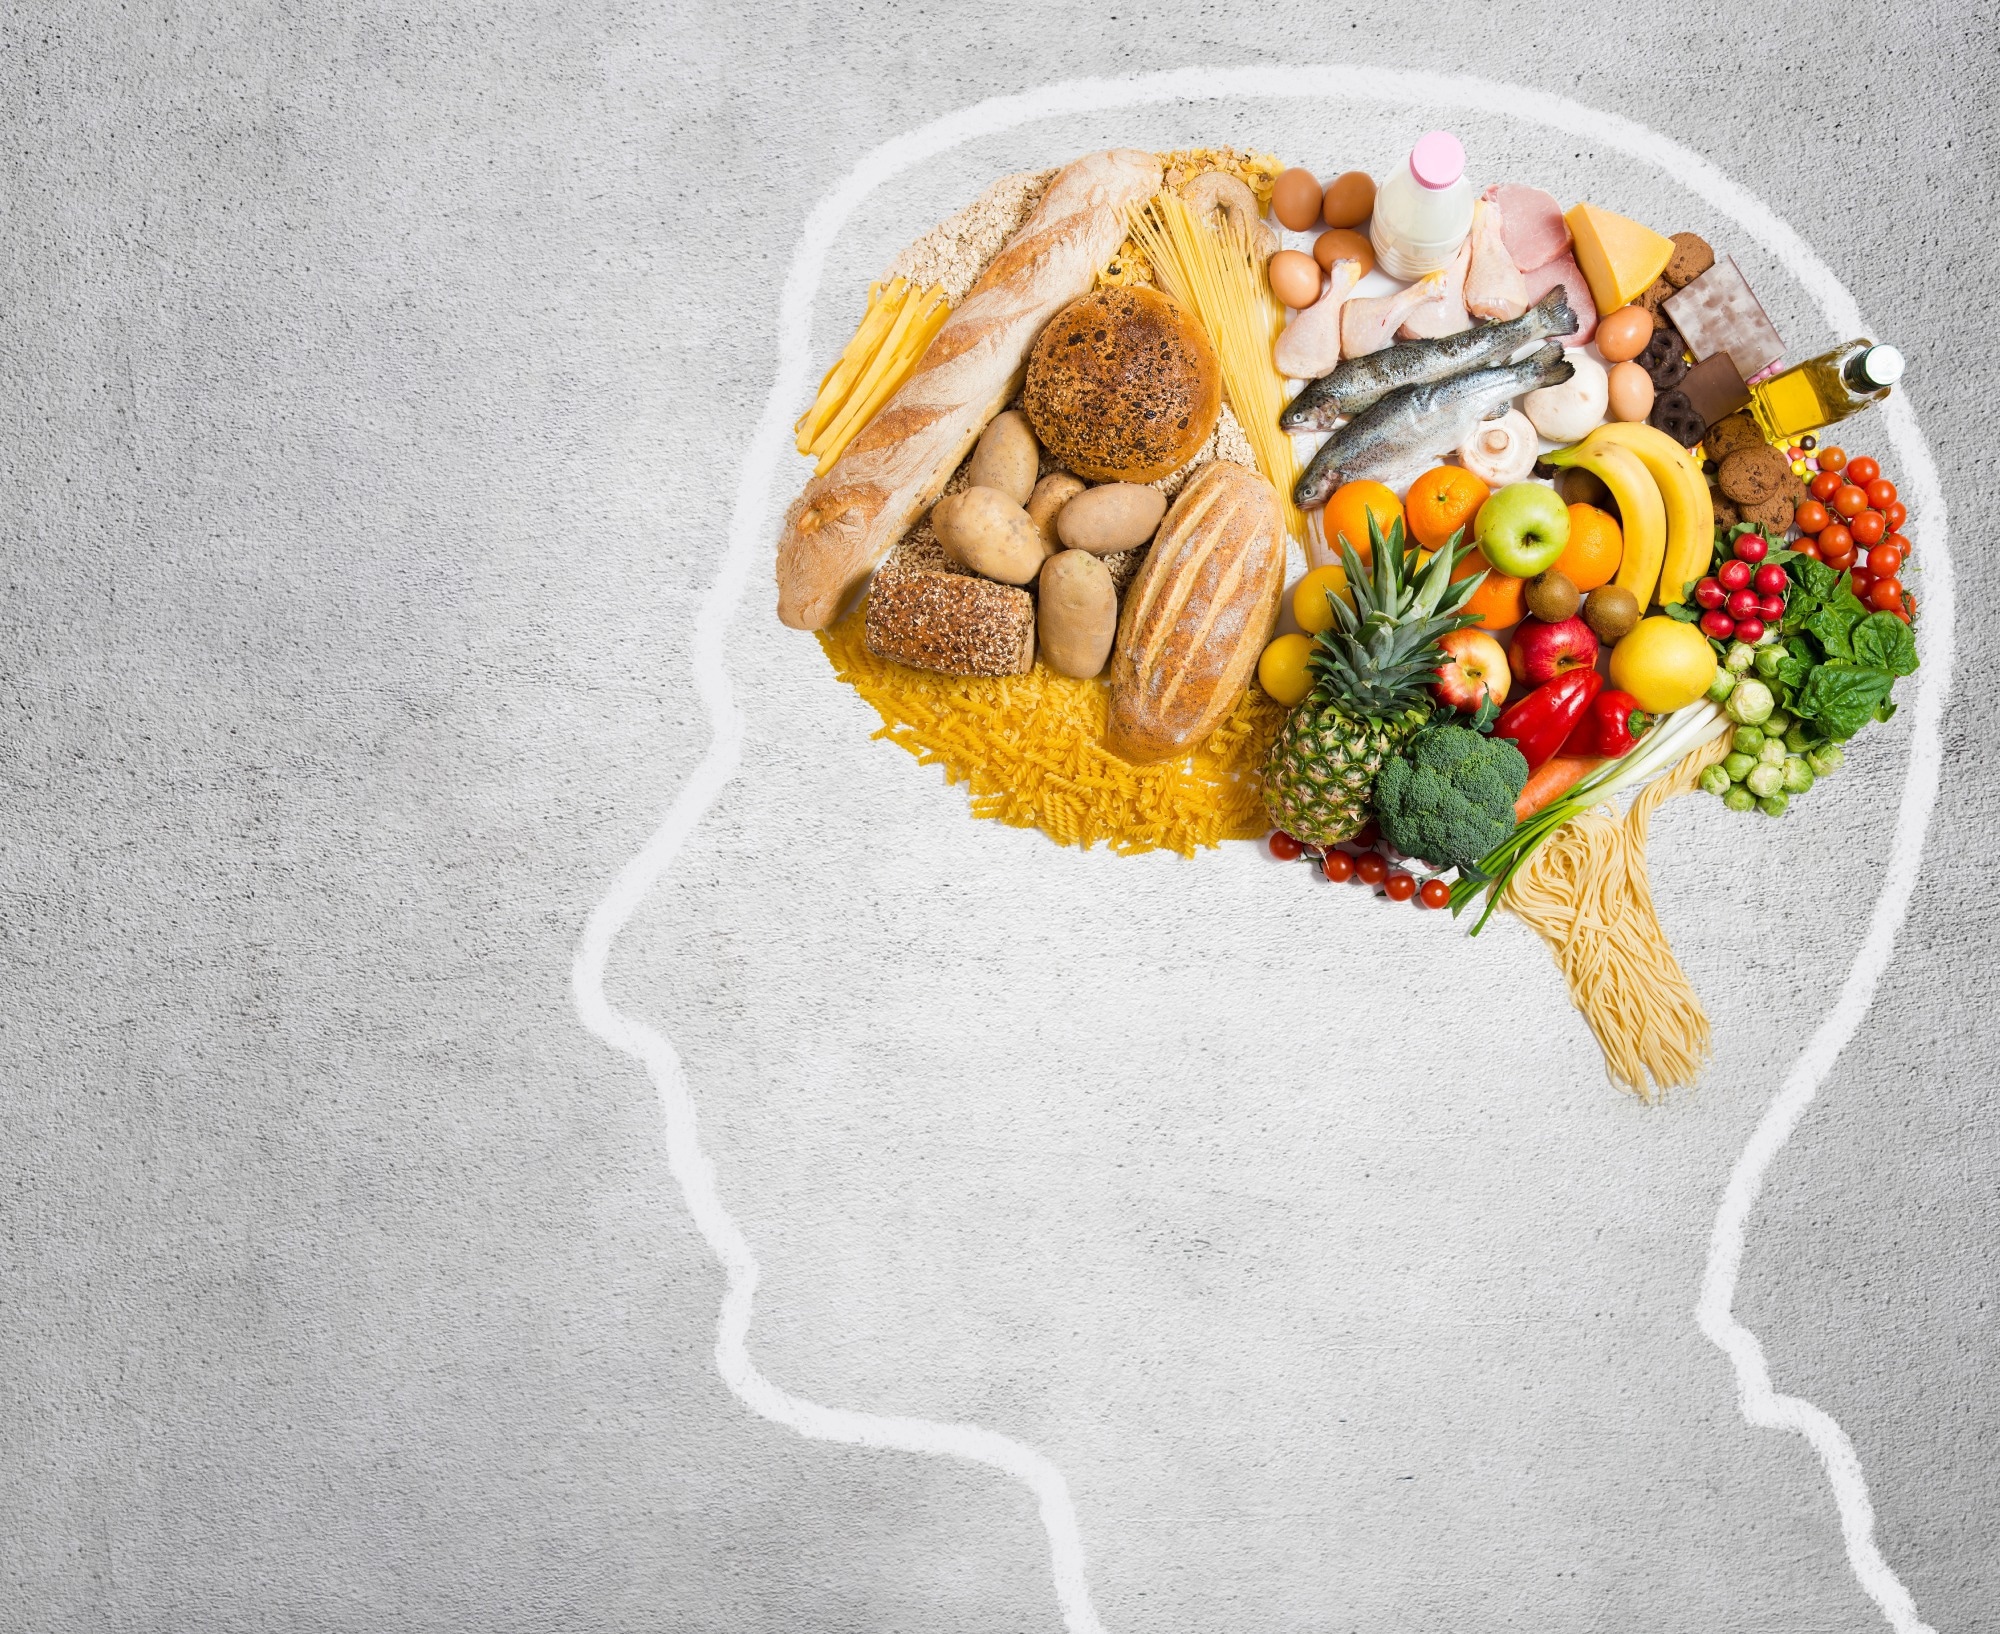
A new trial investigates whether the MIND diet can be scaled for obesity management
Researchers in Sweden are testing whether a brain-healthy MIND diet can be realistically adopted by adults with obesity, laying the groundwork for future trials linking diet, gut health, and mental well-being.
Study: Exploring the…
Continue Reading
-
‘What Else Is Going to Change?’: What ACIP’s Hep B Guidance Means for the Future of Vaccines – MedCity News
- ‘What Else Is Going to Change?’: What ACIP’s Hep B Guidance Means for the Future of Vaccines MedCity News
- When It Comes to Vaccination Strategy, the U.S. Is Not Denmark Scientific American
- Many States Say They’ll Defy RFK Jr.’s Changes…
Continue Reading
-

Expert Explains How to Prepare For Wave of UK ‘Super Flu’ : ScienceAlert
The NHS is facing severe pressure this winter as flu cases surge earlier than usual, with some calling it “super flu”.
Here’s what you need to know about this year’s flu season and how to protect yourself.
What is ‘super flu’?
Professor Meghana…
Continue Reading
-
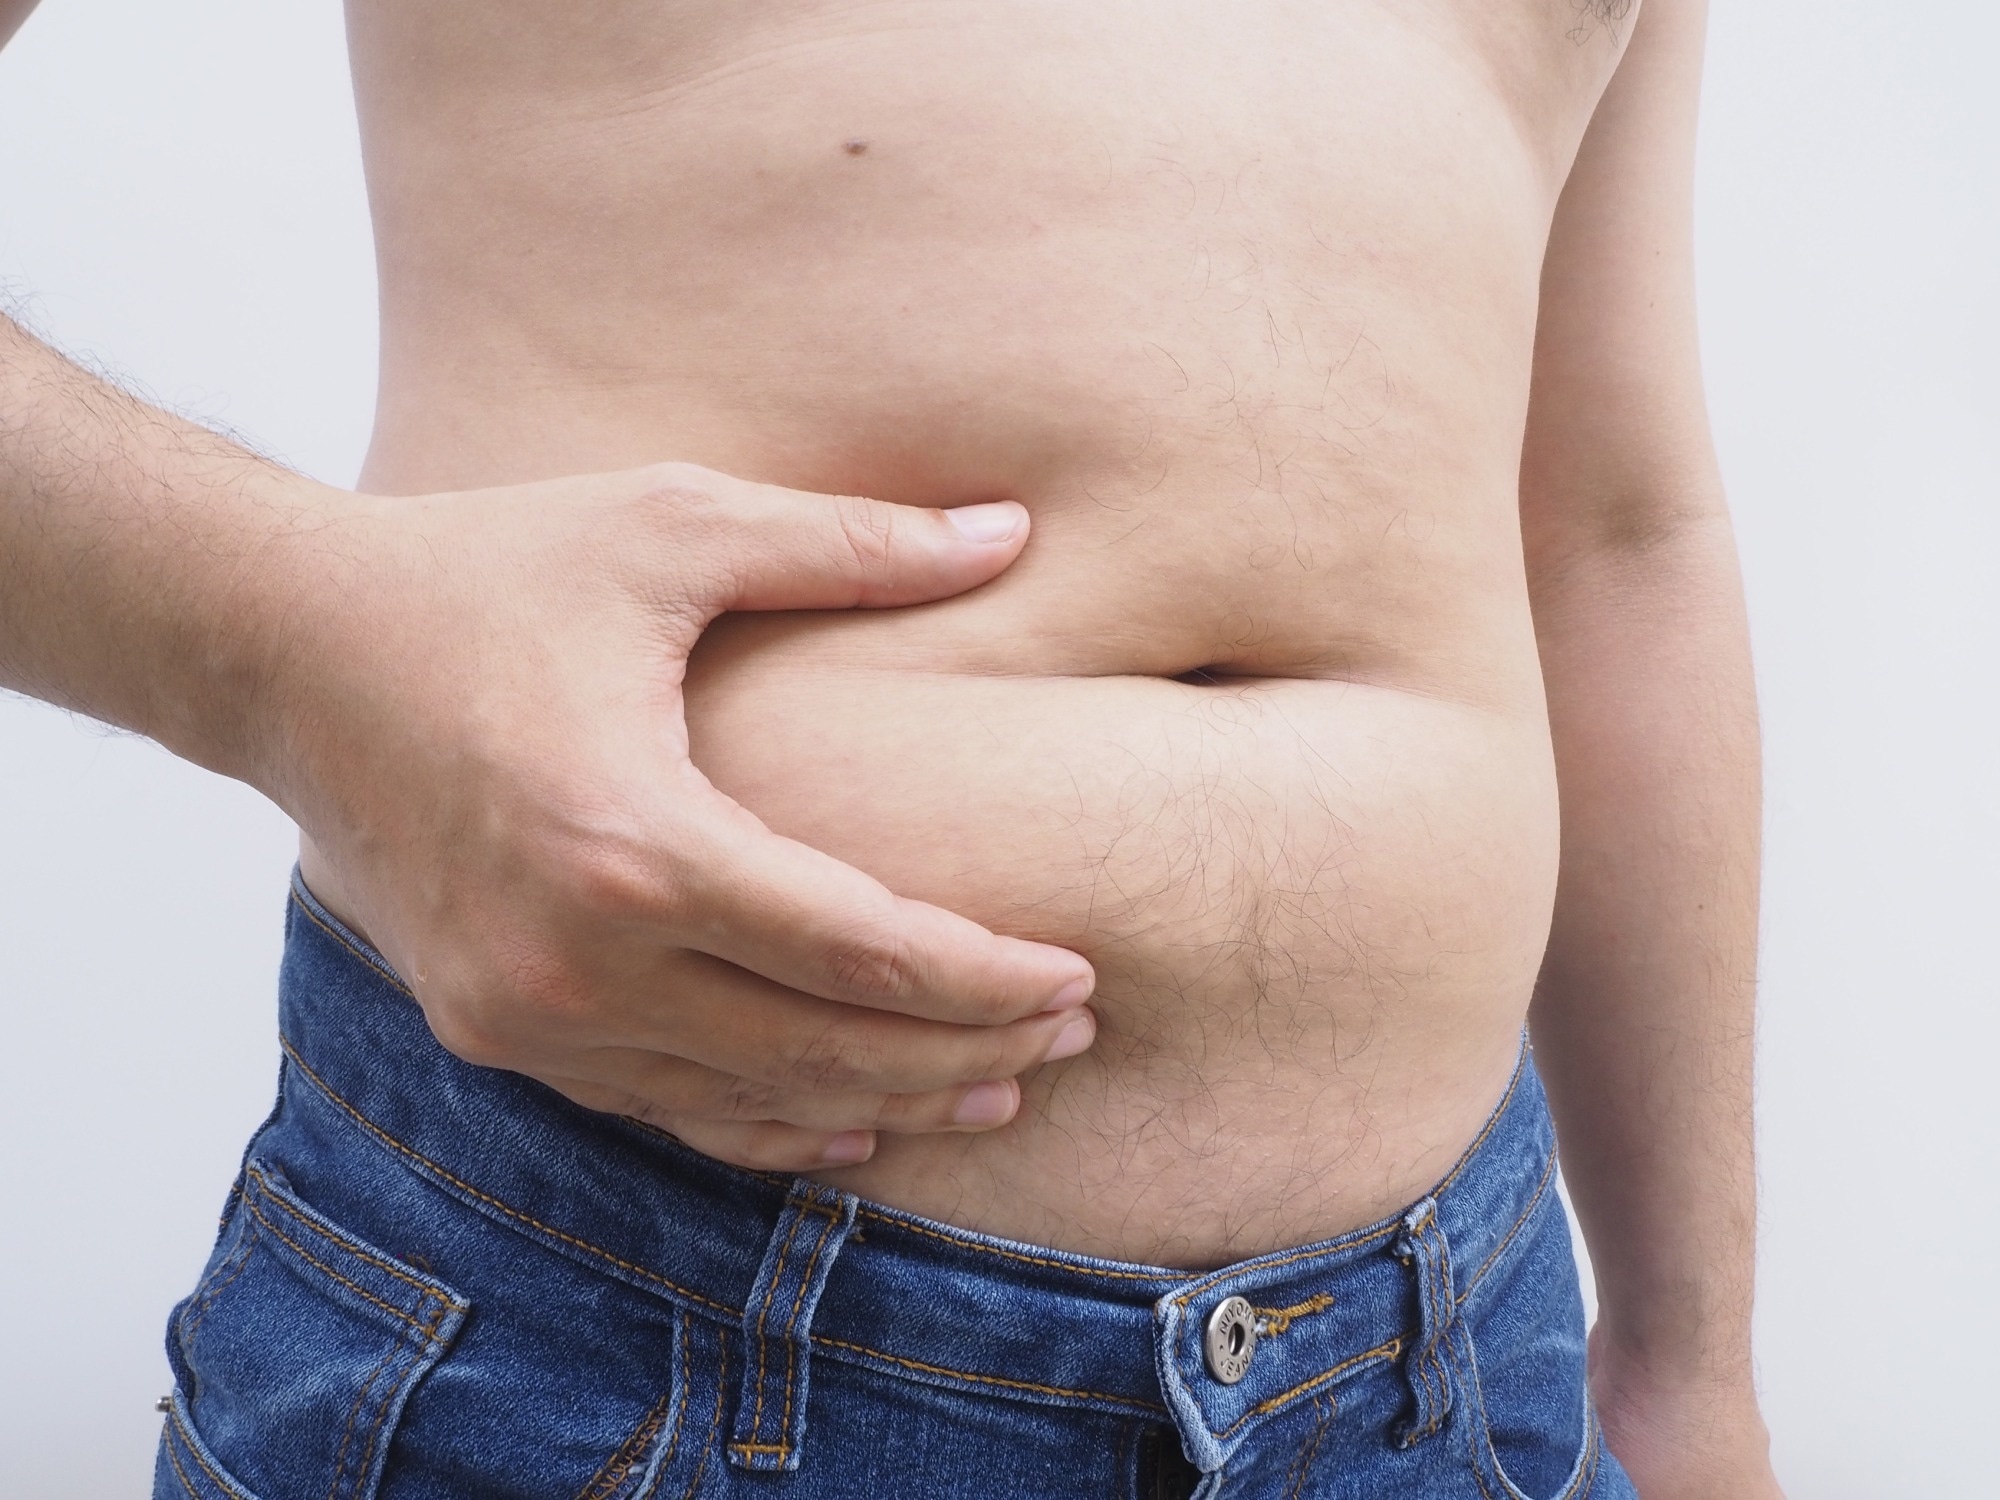
Metabolic syndrome affects nearly four in ten US adults as rates climb in older and Black populations
Despite stable national trends over the past decade, new JAMA data reveal widening age and racial disparities in metabolic syndrome, highlighting where prevention and care efforts may need to intensify.
Study: Trends and Prevalence…
Continue Reading
-
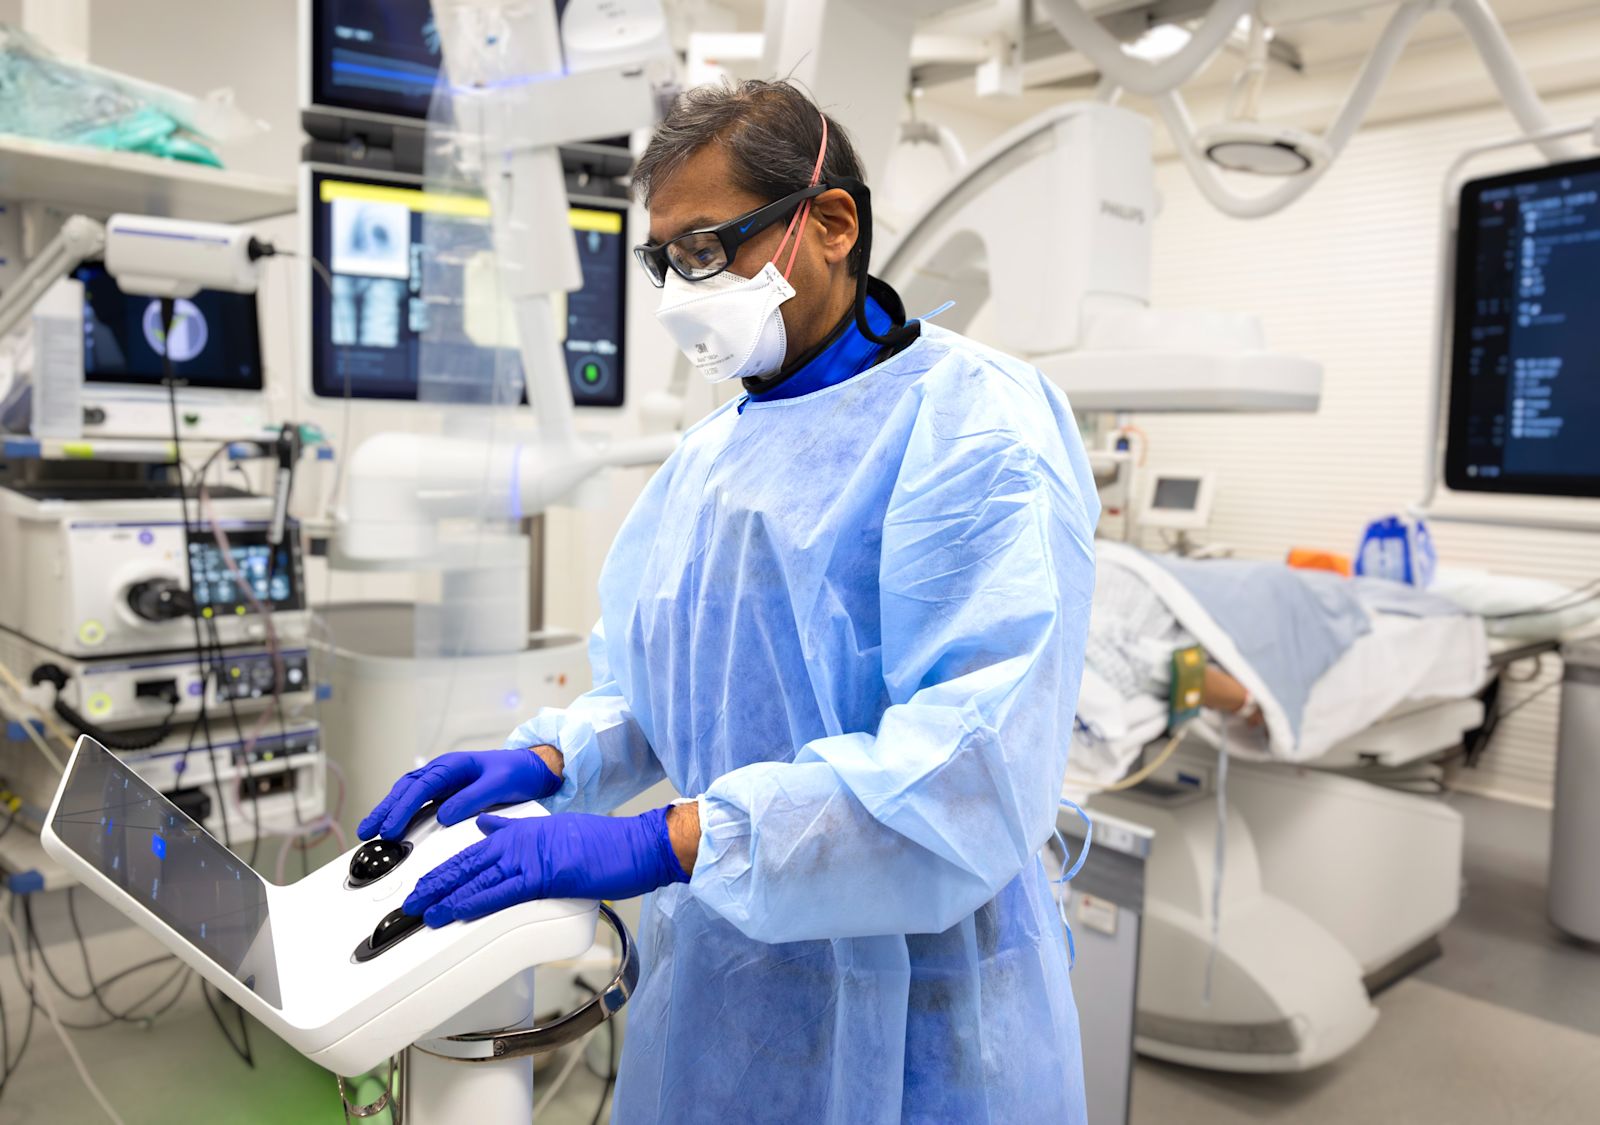
Robotic-assisted biopsy hailed as ‘paradigm shift’ for lung cancer diagnosis
A robotic-assisted procedure that allows doctors to make microscopic movements in the lungs could help diagnose cancer cases much faster, a UK-first trial has shown.
The technology gives medics access to hard-to-reach areas of the lung, allowing…
Continue Reading
-
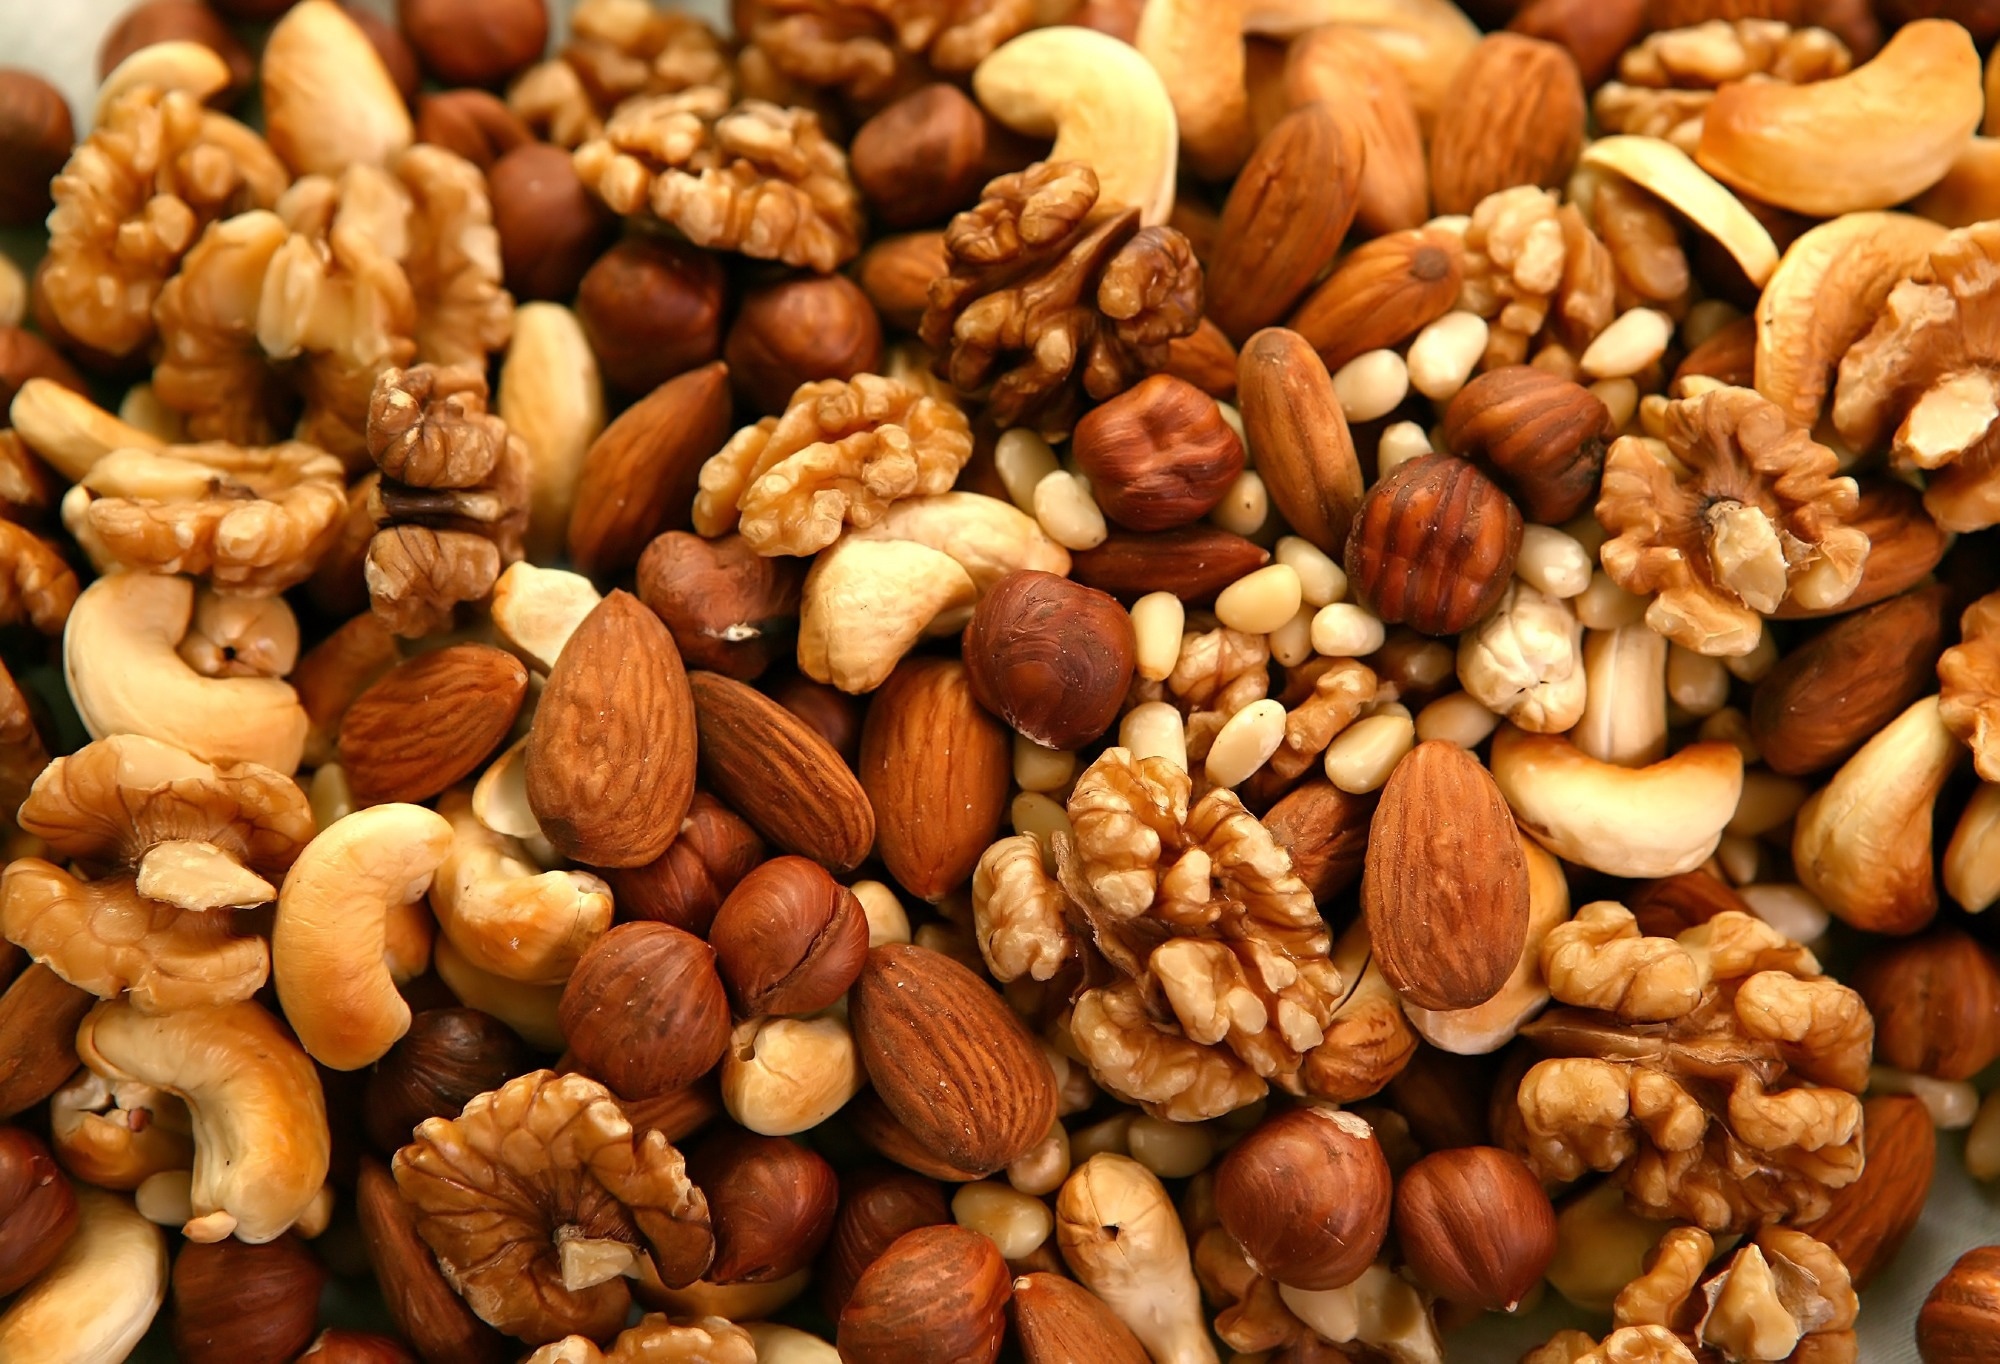
Swapping high-carb snacks for tree nuts cuts food cravings in young adults at metabolic risk
Swapping common snack foods for a modest daily portion of tree nuts curbed cravings for sweets and fast foods and lifted diet quality scores in young adults with early cardiometabolic risk, without weight gain or adverse metabolic…
Continue Reading
-

Our Brains Can Still Outsmart AI Using One Clever Trick : ScienceAlert
Despite the rapid advances in artificial intelligence in recent years, the humble human brain still has the edge over computers in its ability to transfer skills and learn across tasks. A new study reveals how we likely do this.
Led by a team…
Continue Reading