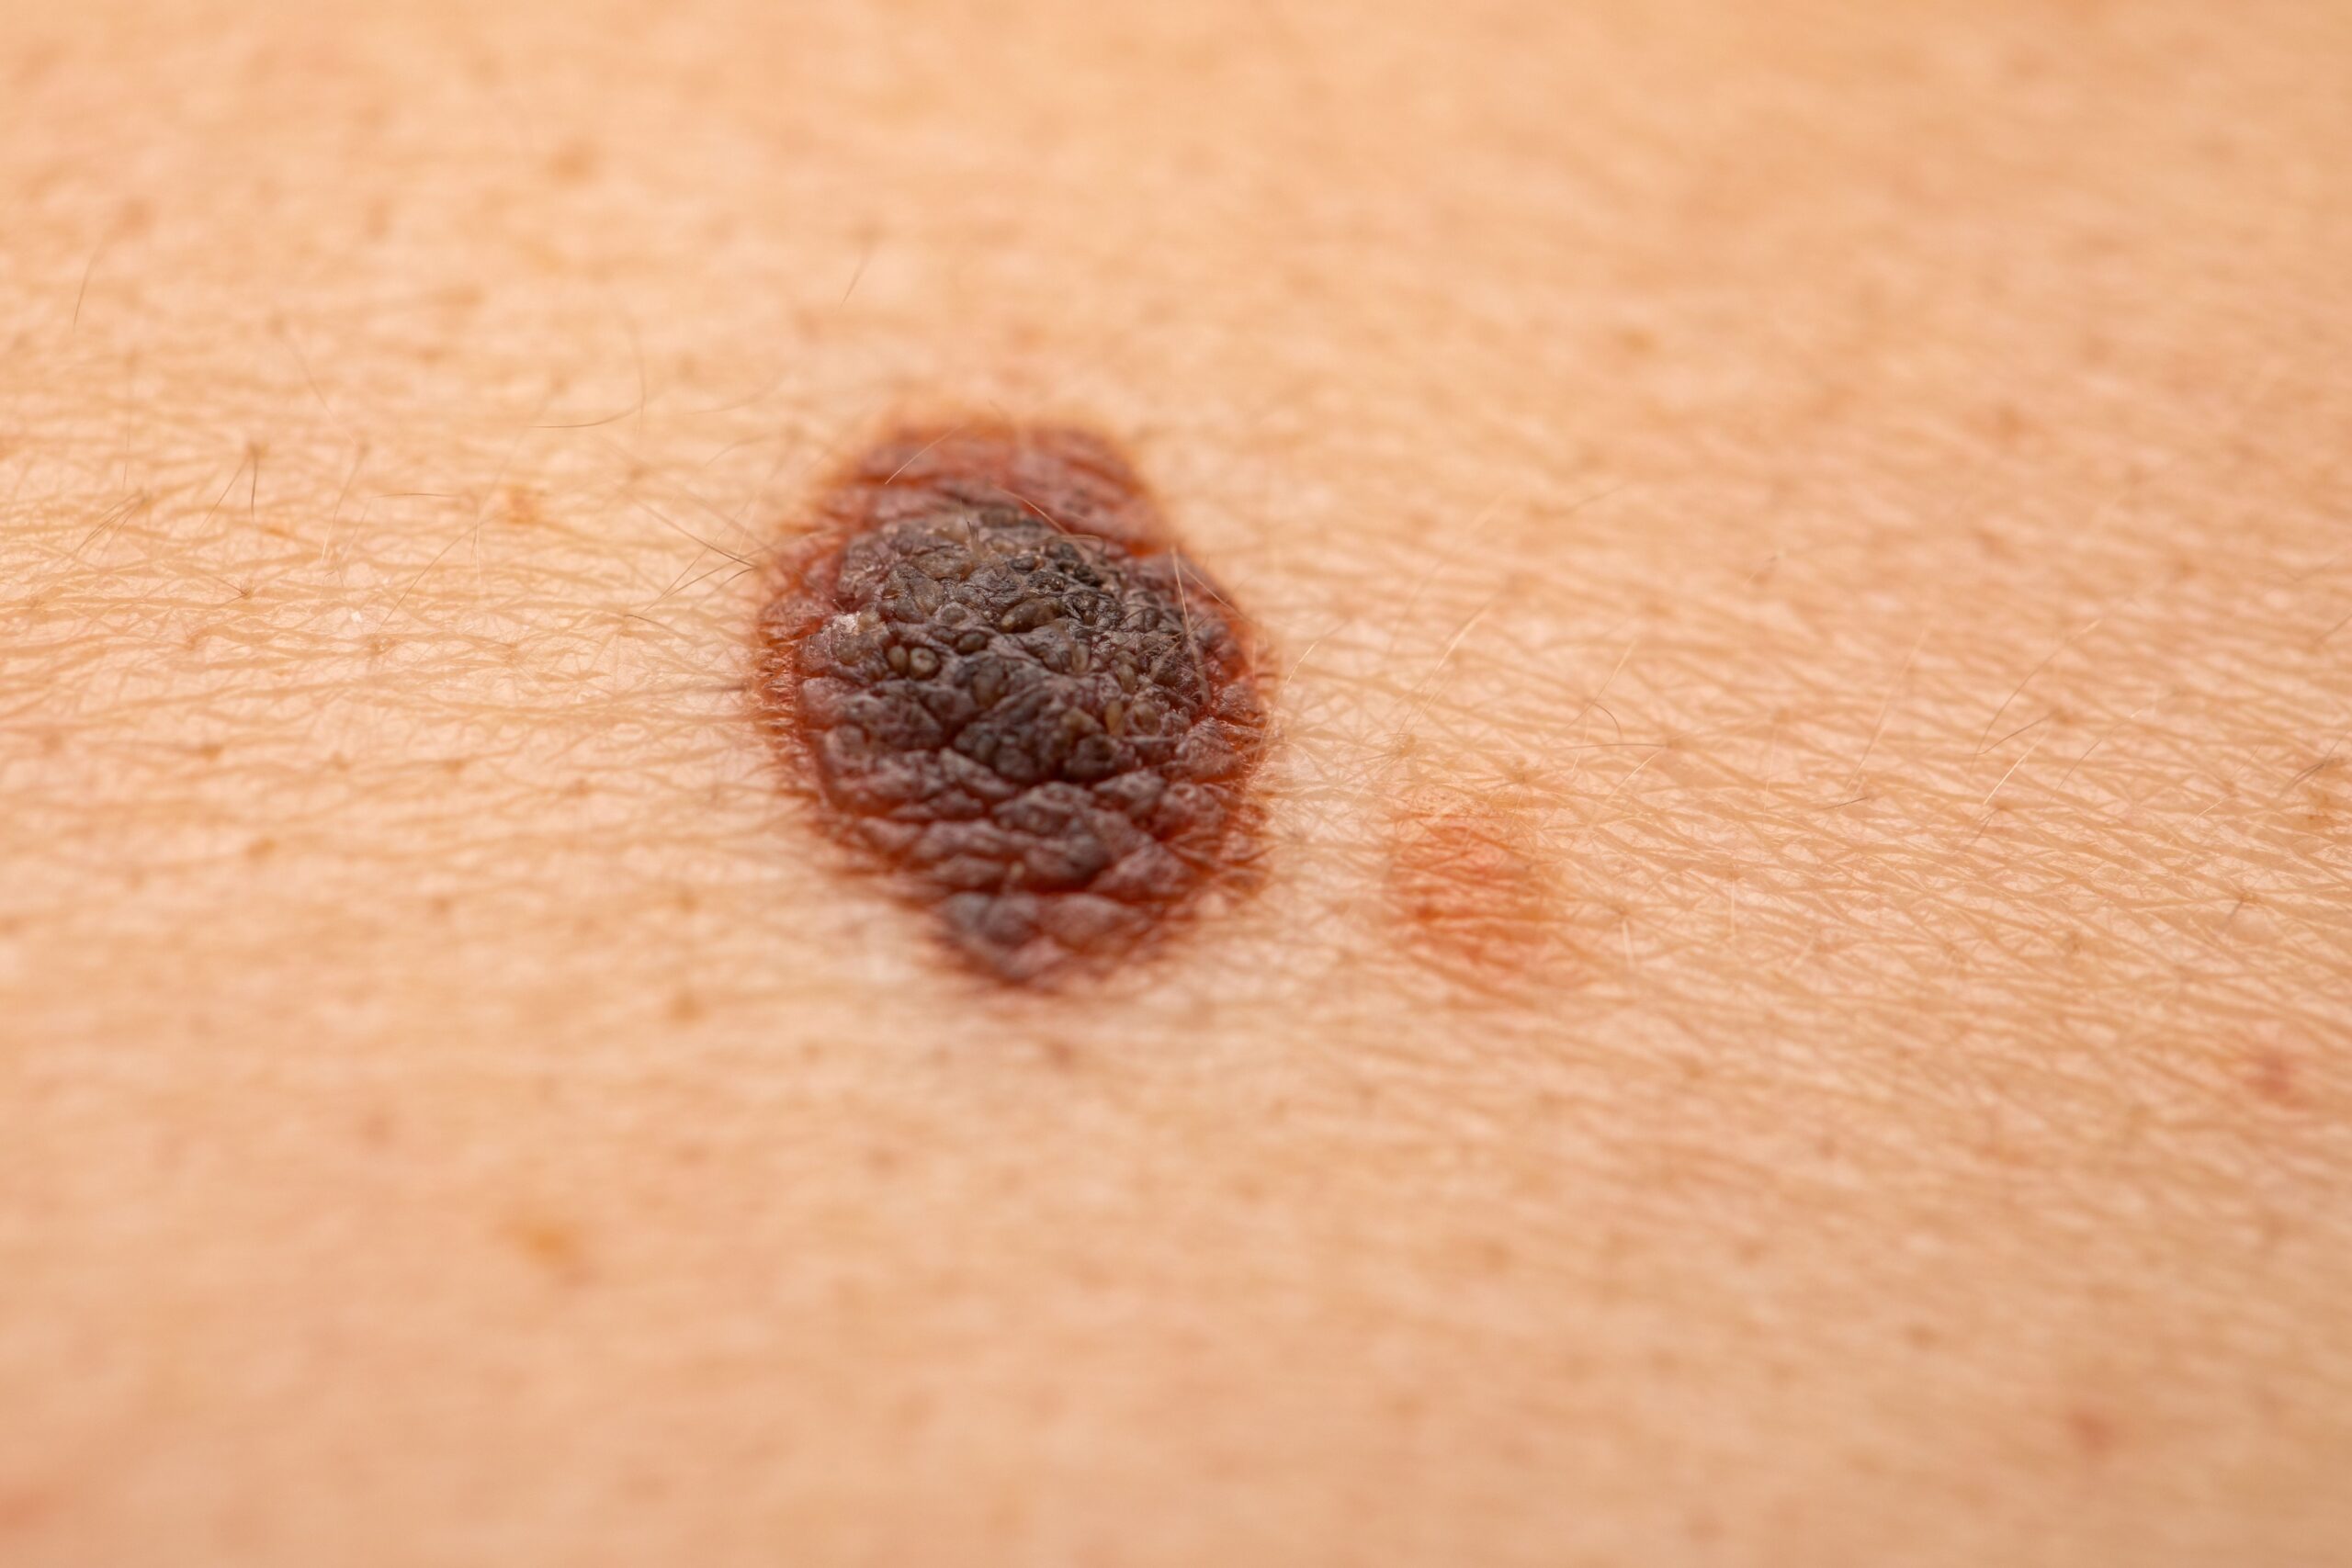
Category: 8. Health

  • NAD+ supplementation could be a potential treatment for accelerated aging diseases

    NAD+ supplementation could be a potential treatment for accelerated aging diseases

    Can research into a rare, accelerated aging disease and “zombie cells” teach us something about the normal aging process?

    Did you know that a small molecule called NAD+ plays a critical role in our ageing process? A deficiency of this molecule may cause you to age much faster than normal. Imagine your cells stopping energy production or your DNA struggling to repair itself. This is the harsh reality of aging, as well as the experience of individuals with Werner syndrome, a rare and severe genetic disorder that leads to premature aging.

    Now, in groundbreaking studies, researchers have found that NAD+ supplementation could be a potential treatment for these accelerated aging diseases. The study on NAD+ deficiency in Werner syndrome was published in the leading aging journal Aging-US.

    The reality of Werner syndrome

    “Werner syndrome is an adult-onset progeria where individuals age more rapidly. By their 20s and 30s, the patients start to show greying and loss of hair, wrinkles, and appear much older than their actual age,” explains Dr. Sofie Lautrup, a postdoctoral researcher at the Department of clinical molecular biology at the University of Oslo and Akershus University Hospital. Patients with Werner syndrome experience typical age-related diseases and life-threatening complications as early as in their 30s-40s, accompanied by significant changes in cellular metabolism, which means that the cells no longer behave normally.

    “Our research has found that one reason for this is that they have lower levels of NAD+ in their mitochondria, the body’s cellular powerhouse,” Lautrup shares.

    Dr. Lautrup and her colleagues have analysed cells from patients with Werner syndrome in the lab. Their research reveals, for the first time, that these individuals have decreased NAD+ levels in their mitochondria compared to healthy individuals. This supports their previous findings on dysregulated NAD+ metabolism and mitochondrial function in premature aging.

    The promise of NAD+, a vital molecule in life

    The researchers investigated whether supplementing NAD+ could restore normal cellular function and achieved remarkable results. “We found that supplying NAD+ can stimulate stem cell growth and inhibit the premature ageing process in stem and skin cells from patients,” Lautrup elaborates. This suggests that NAD+ supplementation could be a potential treatment for Werner syndrome patients. But could NAD+ also significantly impact normal aging?

    So, what exactly is NAD+, and why is it essential for our bodies? NAD+ is a molecule found in all living cells, which plays a vital role in numerous cellular functions. “We need NAD+ to produce energy in our cells. It contributes to cellular health and metabolism by eliminating damaged mitochondria and plays several other critical roles in our cells,” explains Lautrup, adding, “Without NAD+, we literally cannot live.”

    Thus, despite its small size, NAD+ has a monumental effect on the body, acting as an invisible force driving key metabolic processes.

    Using Werner Syndrome to understand aging

    As natural aging occurs, our NAD+ levels substantially decline. Previously, Lautrup and her team observed that patients with Werner syndrome also have significantly lower NAD+ levels in their blood. This condition accelerates the aging process, making it a useful model for researchers to gain insights into ageing itself.

    Zombie cells: neither dead nor alive

    A crucial function of our bodies is cell division, which we need to grow and repair damaged tissue. As we age, this ability diminishes, resulting in a state called senescence. Werner syndrome is caused by mutations in a gene essential for DNA maintenance and repair, and therefore cell division.

    “One major hallmark of Werner syndrome is lack of proliferation and premature senescence. This means that cells without the WERNER protein divide poorly. Even though patients are relatively young, their cells stop dividing,” Lautrup explains.

    Therefore, Werner syndrome patients show loss of stem cell proliferative capacity, which has detrimental consequences to the patients. “One could explain senescence cells as a type of zombie cells. They are neither dead nor alive, unable to perform their normal functions.”

    Researchers suspect that the low level of NAD+ in these patients contributes to the early onset of this zombie state.

    Reversing aging with NAD+

    In their studies, the researchers examined both stem cells and skin cells from Werner syndrome patients in the lab, comparing them with cells from healthy controls. “We wondered whether NAD+ could reinstall proliferation in patient-derived cells,” Lautrup says.

    Within just 24 hours of receiving a precursor molecule that converts to NAD+, multiple proliferation-related pathways were upregulated and senescence related pathways were downregulated.

    “We found that NAD+ treatment can clearly reverse these features of the disease. The cells looked more like healthy cells,” Lautrup states. “NAD+ reduced the number of zombie cells and slowed down the ongoing senescence in the patients’ cells.”

    A glimmer of hope from fruit flies

    Previously, Lautrup and her colleagues conducted experiments with roundworms and fruit flies (drosophila melanogaster) modelling Werner syndrome.

    They administered a molecule that converts into NAD+ within the cells. The results showed that NAD+ treatment successfully stimulated stem cell proliferation in the fruit flies, leading to improved mitochondrial function. Even with Werner syndrome, these organisms lived longer than expected.

    “This finding in fruit flies made us wonder if NAD+ could restore cell division in the cells of actual patients,” she adds.

    Paving the way for new treatments

    Lautrup’s research has triggered clinical studies currently underway in Japan, focusing on Werner syndrome and NAD+.

    “We eagerly await the results,” she shares. “We hope that this study, combined with our previous work on Werner syndrome and NAD+, will pave the way for new treatments not only for Werner syndrome but potentially for other aging-related diseases.”

    Can we slow down the aging process?

    If researchers can restore cellular NAD+ levels, the goal is to slow the ageing process. “We use Werner syndrome as a model for normal ageing. We’re continually hopeful that our research will provide insights for studies on typical ageing; however, we still do not know if NAD+ can help slow down natural ageing in humans,” Lautrup concludes.

    As this research progresses, the scientific community remains hopeful that understanding the role of NAD+ and addressing the phenomenon of zombie cells may open new avenues for promoting longevity and better health in aging populations.

    The paper builds on a collaborative project between both University of Oslo, Chinese University of Hong Kong, Shiba University in Japan, Bergen University and more supported among others by NordForsk (a Japan-Norway-Sweden collaboration).

    Source:

    University of Oslo, Faculty of Medicine

    Journal reference:

    Lautrup, S., et al. (2025). Decreased mitochondrial NAD+ in WRN deficient cells links to dysfunctional proliferation. Aging. doi.org/10.18632/aging.206236.

    Continue Reading

  • Researchers diagnose Parkinson’s with 3D printed pen

    Researchers diagnose Parkinson’s with 3D printed pen

    Stay up to date with everything that is happening in the wonderful world of AM via our LinkedIn community.

    According to UCLA, researchers led by Jun Chen, an associate professor of bioengineering at the UCLA Samueli School of Engineering, have developed a smart, self-powered, 3D printed magnetoelastic pen that could help detect early signs of Parkinson’s disease by analyzing a person’s handwriting.

    Every year, tens of thousands of people with signs of Parkinson’s disease go unnoticed until the incurable neurodegenerative condition has already progressed. Motor symptoms, such as tremors or rigidity, often emerge only after significant neurological damage has occurred. By the time patients are diagnosed, more than half of their dopamine-producing neurons may already be lost. This kind of diagnostic delay can limit treatment options and slow progress on early-stage interventions. While there are existing tests to detect biomarkers of Parkinson’s, including cell loss in the brain and inflammatory markers in blood, they typically require access to specialists and costly equipment at major medical centers, which may be out of reach for many.

    The highly sensitive diagnostic pen, described in a UCLA-led study published in Nature Chemical Engineering, features a soft, silicon magnetoelastic tip and ferrofluid ink – a special liquid containing tiny magnetic particles. When the pen’s tip is pressed against a surface or moved in the air, the pen converts both on-surface and in-air writing motions into high-fidelity, quantifiable signals through a coil of conductive yarn wrapped around the pen’s barrel. Although not intended for writing, the pen is self-powered, leveraging changes in the magnetic properties of its tip and the dynamic flow of the ferrofluid ink to generate data.

    To test the pen’s diagnostic potential, the team conducted a pilot study with 16 participants, three of whom had Parkinson’s disease. The pen recorded detailed handwriting signals, which were then analyzed by a neural network trained to detect motor patterns associated with the disease. The model was able to distinguish participants with Parkinson’s from healthy individuals with an average accuracy of 96.22%.

    “Detection of subtle motor symptoms unnoticeable to the naked eye is critical for early intervention in Parkinson’s disease,” said Chen, who is the study’s corresponding author. “Our diagnostic pen presents an affordable, reliable, and accessible tool that is sensitive enough to pick up subtle movements and can be used across large populations and in resource-limited areas.”

    The researchers anticipate that this pen could transform early detection of Parkinson’s and other neurodegenerative conditions. Rather than waiting for symptoms to become disruptive, primary care physicians or geriatric specialists could administer a quick handwriting test during routine visits and use the data to inform earlier referrals or treatment.

    Continue Reading

  • Mass Drug Administration Reduces Malaria Incidence but Requires Sustained Effort in Southeast Senegal

    Mass Drug Administration Reduces Malaria Incidence but Requires Sustained Effort in Southeast Senegal

    Michelle Hsiang, MD, MS and Michelle Hsiang, MD, MS

    Image credits: UCSF

    Malaria elimination progress in Africa has stalled despite scale-up of standard control interventions. Mass drug administration (MDA) shows promise for reducing transmission, but evidence is limited for low-to-moderate transmission settings. To inform clinical practice, we interviewed study authors Michelle Hsiang, MD, MS, and Michelle E Roh, PhD, for expert insights on their recent trial.

    Coverage of MDA improved across rounds, with 74%, 79%, and 81% of eligible participants receiving treatment in cycles one through three. No serious adverse events were reported, confirming safety. The adjusted reduction in malaria incidence was approximately 55% (95% CI, 28 to 71) during the intervention year but declined to 26% (95% CI, –17 to 53) post-intervention. Malaria incidence during the post-intervention transmission season remained 126 cases per 1000 population in the intervention arm versus 146 cases per 1000 in controls.1

    This open-label, cluster-randomized controlled trial in southeast Senegal randomized 60 villages with moderate-to-low seasonal malaria transmission (60–160 cases per 1000) to either three cycles of MDA with dihydroartemisinin–piperaquine plus single low-dose primaquine at 6-week intervals or standard seasonal malaria chemoprevention (SMC) with sulfadoxine–pyrimethamine plus amodiaquine every 4 weeks. The primary endpoint was Plasmodium falciparum incidence in the post-intervention season (July–December 2022). Safety, coverage, and incidence during the intervention year were secondary outcomes.1
    Hsiang and Roh emphasized that “in our study setting, where malaria transmission was moderate-to-low and highly seasonal and coverage of standard malaria control interventions (eg, vector control, surveillance, case management) was high, three rounds of MDA with dihydroartemisinin-piperaquine and single low-dose primaquine rapidly reduced malaria incidence by ~55%.” Although, “this effect was not sustained upon discontinuation of MDA, with none of the villages reaching pre-elimination levels (<5 cases per 1000 population) in the subsequent transmission season.”1

    What You Need To Know

    Three rounds of MDA rapidly reduced malaria incidence by approximately 55% during the intervention year with no serious adverse events reported.

    The protective effect declined after discontinuation, underscoring the importance of covering the entire transmission season and achieving >80% population coverage.

    Sustained malaria control via MDA likely requires annual repetition over multiple years combined with strong community sensitization and targeted strategies to maintain low incidence levels.

    Regarding future malaria control strategies, they recommend: “Ensure that the number of MDA rounds administered covers the full transmission season. It is likely that, in our study, partial coverage of the transmission season contributed to the weak sustained effect in the post-intervention year.” Furthermore, programs should “aim to reach >80% coverage of the population (supported by WHO recommendations), which may require strong community acceptance and engagement by the local health and administrative officials.” They also noted, “MDA is costly and resource-intensive and may require sustained commitment over several years to maximize benefits.”1

    On challenges to sustaining MDA’s impact, their recommendations include: “MDA will likely need to be repeated annually over several years until malaria incidence drops to low levels, at which point programs can consider transitioning to more targeted strategies such as focal MDA.” They stress that “to effectively reduce the parasite reservoir, the timing and frequency of MDA rounds should cover the entire transmission season.” Finally, “community sensitization and engagement are critical to reaching high coverage,” with additional efforts needed “to engage groups who may be less likely to participate in standard chemoprevention campaigns, including adults, adolescents, and highly mobile populations.”2
    The study’s open-label design and geographic focus limit generalizability. The diminished effect after cessation of MDA highlights the challenges of achieving sustained malaria control with limited intervention rounds.1
    MDA with dihydroartemisinin–piperaquine plus single low-dose primaquine is safe and reduces malaria incidence significantly during active administration in a moderate-to-low transmission African setting. Although, Hsiang and Roh conclude, “MDA will likely need to be repeated annually over several years until malaria incidence drops to low levels, at which point programs can consider transitioning to more targeted strategies such as focal MDA.” Successful malaria control via MDA requires optimized timing, full seasonal coverage, and strong community engagement to maintain gains.1

    References
    1.Effect of mass drug administration on malaria incidence in southeast Senegal during 2020–22: a two-arm, open-label, cluster-randomised controlled trial. Ba, El-hadji Konko Ciré et al. The Lancet Infectious Diseases, Volume 25, Issue 6, 656 – 667. June 2025. Accessed July 7, 2025.
    2.Brady OJ, Slater HC, Pemberton-Ross P, et al. Role of mass drug administration in elimination of Plasmodium falciparum malaria: a consensus modelling study. Lancet Glob Health. 2017;5(7):e680-e687. doi:10.1016/S2214-109X(17)30220-6

    Continue Reading

  • 8 Foods to Eat Every Week for High Blood Pressure

    8 Foods to Eat Every Week for High Blood Pressure

    • Nearly half of American adults have high blood pressure, also known as hypertension.
    • We’re often told to avoid sodium, yet many foods are naturally rich in blood pressure–lowering nutrients.
    • Potassium, magnesium, calcium, fiber and omega-3 fats may help reduce blood pressure.

    High blood pressure, or hypertension, affects roughly half of American adults. While many people need medication to control this condition, regularly eating certain foods can also help lower your blood pressure—no prescription required. 

    So, what are these power foods? To find out, we asked dietitians the best blood pressure–lowering foods to add to your weekly rotation. Get out your pen and paper (or smartphone!) because you’re going to want to make sure these eight foods are at the top of your shopping list.

    1. Bananas

    Bananas are nutrient gold mines when it comes to better blood pressure, says Natalie Rizzo, M.S., RDN. For starters, she says, bananas are a good source of potassium. This mineral helps lower blood pressure by decreasing the stress on blood vessel walls caused by eating too much sodium. Even though most of us consume too much sodium, few of us get enough potassium. That’s where bananas come in. One medium banana provides roughly 420 milligrams of potassium, or 9% of the Daily Value. 

    Bananas also provide fiber, which helps lower blood pressure by producing compounds called short-chain fatty acids that help relax blood vessels and improve blood flow. Yet, like potassium, most of us don’t consume nearly enough fiber. One medium banana delivers an easy 3 grams of fiber, which is roughly 11% the 28-gram DV.  

    2. Beets

    If beets aren’t already on your list of heart-healthy foods, they should be! These deep purple veggies contain dietary nitrates, compounds your body converts to a blood pressure–lowering nitric oxide. That’s not all. They give you 442 mg of potassium per cup (9% of the DV). So, toss some in your next salad. Or, if you want even more blood pressure–lowering power, pour a glass of beet juice. Research has shown it can significantly reduce systolic blood pressure, the blood pressure reading most closely related to heart disease risk.

    3. Edamame

    Soy foods like edamame are powerful players when it comes to lowering blood pressure. The proof is so strong that one systematic review and meta-analysis of 17 studies found that eating soy foods can significantly reduce both systolic and diastolic blood pressure. 

    If you’re wondering what makes edamame so effective, the answer may lie in their nutrient density. One cup of shelled edamame packs an impressive 8 grams of fiber. That’s more than a quarter of your daily requirement. It also contains 14% of the DV for potassium, plus other blood pressure–lowering minerals like magnesium and calcium. 

    4. Pistachios 

    “Regular consumption of pistachios has been shown in several studies to help reduce blood pressure,” says Kelly Jones, M.S., RD, CSSD. One reason is their fiber. “Per 1-ounce serving, pistachios provide 3 grams of fiber, a nutrient emphasized by the DASH diet,” says Jones., If you haven’t heard of the DASH diet before, it’s a blood pressure–lowering eating pattern backed by decades of research. 

    In addition to fiber, pistachios also contain a potent blood pressure–lowering cocktail of potassium, magnesium, calcium, antioxidants and plant protein. 

    5. Potatoes 

    “Although potatoes get a bad reputation, they are full of nutrition and are a good source of potassium,” says Rizzo. “Since potassium works with sodium to regulate blood pressure, increasing potassium intake is another strategy to help improve blood pressure,” adds Jones. 

    One medium potato delivers 952 mg of potassium. That’s 20% of your daily requirement and more than double the amount you’d get from a medium banana.

    6. Pulses 

    Pulses like beans, lentils and dried peas are an integral part of the DASH diet. Like many other foods on this list, they’re rich in potassium and plant protein. But don’t just munch on them for their blood pressure benefits. Research has also shown that pulses may lower cholesterol and inflammation and protect against heart attack and cardiovascular disease.

    7. Salmon 

    You may have heard that omega-3-rich fatty fish like salmon are fantastic foods for heart health. One reason is their favorable impact on blood pressure. Research has found that the long-chain omega-3 fats docosahexaenoic acid (DHA) and eicosapentaenoic acid (EPA) help relax the muscles of the blood vessel walls. This process, known as vasodilation, allows blood to move easily throughout the body, ultimately reducing blood pressure.

    8. Yogurt 

    Yogurt isn’t just great for your gut health. One study found that people with hypertension who frequently consumed yogurt had lower systolic blood pressure. This study didn’t find that yogurt had the same impact on people with normal blood pressure. However, another study found that people with healthy blood pressure who regularly ate yogurt were less likely to develop hypertension.  While more research is needed, yogurt boasts a long list of health benefits, including lower cholesterol levels and better heart and digestive health. So, tossing a few containers into your shopping cart can do all kinds of good things for your body.

    Nutrients to Focus On for Better Blood Pressure

    • Calcium. Calcium is a key mineral for healthy blood pressure. It is believed to work by helping blood vessels relax and favorably impacting hormones that regulate blood pressure. In addition to yogurt, you can get calcium from dairy milk, fortified plant milks, cheese, sardines and salmon with bones. 
    • Fiber. Research shows that the more soluble fiber people eat, the lower their blood pressure tends to be. You’ll find soluble fiber in oats, barley, beans and legumes, fruits, vegetables, nuts and seeds. 
    • Magnesium. This tiny but mighty mineral plays a role in more than 300 enzymatic reactions in your body. So, it should come as no surprise that it’s instrumental for healthy blood pressure. Magnesium-rich foods include pumpkin and chia seeds, almonds, cashews, peanuts, spinach, edamame and soy milk. 
    • Long-Chain Omega-3 Fatty Acids. DHA and EPA are found in fatty fish like salmon, mackerel, herring, sardines and anchovies. They promote heart health by regulating blood pressure and reducing inflammation. If you’re not a fish eater, speak to your health care provider to find out if a supplement is right for you.
    • Potassium. We often hear that people with high blood pressure should limit sodium, says Jones. And they should! However, the opposite is true when it comes to potassium, which works to offset some of sodium’s blood pressure–raising action. You’ll find it in every food on this list! 

    Heart-Healthy Recipes to Try

    Our Expert Take

    Whether you have high blood pressure or simply want to prevent it, there’s a long list of foods that can keep your blood pressure in a healthy range. These include bananas, beets, edamame, pistachios, potatoes, pulses, salmon and yogurt. These tasty, nutrient-packed foods are rich in blood pressure–regulating nutrients like potassium, magnesium, calcium, fiber and omega-3 fatty acids. Plus, they’re convenient and accessible. No wonder dietitians are such big fans! So, when you make your next grocery run, toss any (or all!) of them in your cart. Because better blood pressure is as much about what you do eat as what you don’t.

    Continue Reading

  • Systemic Immunomodulatory Therapy in Uveitis Related to Behçet’s Di

    Systemic Immunomodulatory Therapy in Uveitis Related to Behçet’s Di

    Introduction

    Behçet’s disease (BD) is a systemic vasculitis frequently associated with intraocular inflammation. It is characterized by significant clinical heterogeneity and presents with various systemic manifestations, including mucocutaneous, articular, vascular, neurological, and gastrointestinal features. It is most common in regions along the historic “Silk Road”, stretching from Eastern Asia to the Mediterranean basin. The highest incidence has been recorded in Turkey.1,2

    The etiopathogenesis of BD has not been clarified. It usually affects young adults 20 to 40 years of age and is characterized by a relapsing and remitting course.2 While both genders are affected equally, male patients tend to experience a more severe progression of the disease.

    The criteria established by the International Study Group for Behçet’s disease requires that patients must have recurrent oral ulcers along with at least two of the following criteria: recurrent genital ulcers, skin lesions, eye lesions, or a positive pathergy test.3

    Ocular involvement contributes most to the morbidity in BD. Common eye symptoms include blurred vision, reduced visual clarity, redness, periocular or periorbital pain, light sensitivity, tearing, foreign body sensation, and headaches. The most common type of ocular involvement in BD is non-granulomatous uveitis, often accompanied by retinal vasculitis and can be the initial manifestation of the disease. Bilateral involvement is generally observed and may affect anterior, posterior or both segments of the eye (panuveitis). Panuveitis and posterior uveitis are the most common forms of involvement, posing a significant threat to vision and a high risk of lasting complications.4

    In recent years, research in Behçet’s disease uveitis (BU) has evolved significantly, particularly through the integration of artificial intelligence (AI) and radiomics into ophthalmic diagnostics. Novel AI-driven models, especially those based on OCT angiography and radiomic biomarkers, have demonstrated high diagnostic performance in identifying BU, providing a promising complement to clinical evaluation and overcoming.5

    The primary goals in the management of patients are to achieve rapid resolution of intraocular inflammation, to prevent recurrent attacks, and to ensure complete remission and preservation of vision.

    Patients with isolated anterior uveitis can be managed using topical steroids. However, systemic IMT (immunomodulatory therapy), such as azathioprine (AZA) could be considered in cases of poor prognostic factors such as hypopyon, early onset of the disease and male gender.

    In case of posterior uveitis and panuveitis systemic IMT should be started as soon as possible, such as azathioprine and cyclosporine, in complement to oral corticosteroids.3,6

    Intra or periocular corticosteroids can be used in addition to systemic treatment for unilateral exacerbations.7

    In refractory or recurrent cases, biological therapies such as infliximab (IFX) and adalimumab (ADA) are recommended.8 However, the treatment strategy involving conventional immunomodulators versus anti-TNF agents has not been clearly defined.9

    Determining whether disease stability results from the treatment itself or the naturally relapsing-remitting course of the disease is challenging. Also, establishing a standardized protocol for discontinuing treatment in all BD patients is complicated because of the higher relapse risk in men and younger individuals. There is no consensus on the appropriate timing to discontinue treatment for BD patients in remission. Current recommendations suggest that in patients with significant organ involvement, as in the case of uveitis, remission may be achieved after 2–5 years of IMT6 or after more than 6 years.10

    This strategy aims to maintain remission and limit ocular inflammation. Treatment efficacy is critical to avoid the consequences of long-term ocular inflammation, associated with significant morbidity among an overall young active population, including permanent vision loss. BD uveitis is responsible for an important share of the world’s immune-related blindness, so initiating treatment as early as possible can improve this prognosis.7

    Materials and Methods

    Study Design, Setting and Participants

    This is a retrospective, single center, longitudinal study of patients with unilateral and bilateral uveitis related to Behçet’s disease, followed in the Ophthalmology department of Centro Hospitalar Universitário São João (Porto, Portugal).

    Data from all patients under systemic IMT evaluated in the past 10 years were collected by chart review. Initial screening searched for patients under methotrexate, adalimumab, cyclosporine, azathioprine, infliximab and certolizumab, which provided a total of 509 medical processes.

    Afterwards, only patients with Behçet’s disease were included.

    Data Collection

    The following information was extracted from each case, based on the patient’s electronic medical records and procedure reports: demographic data, characterization of the initial uveitis episode, type of uveitis, total follow period, type and duration of IMT, need for adjuvant corticosteroid therapy and pattern of disease remission and relapses were recorded. Intolerance or toxicity as well as treatment’s discontinuation were also documented.

    Statistical Analysis

    Kolmogorov–Smirnov and Shapiro–wilk tests were used to assess whether each continuous variable followed a normal distribution, with Shapiro–Wilk being preferred for small sample sizes. Normally distributed data is reported as mean ± standard deviation (SD) while non-normally distributed data is reported as median and interquartile range (IQR). Categorical variables are presented as absolute number and percentage. Parametric tests like student’s t-test and non-parametric tests like Mann–Whitney or Wilcoxon were used for variables comparison between groups, according to the normality of data. We used Mann–Whitney to compare independent variables and Wilcoxon to compare paired (dependent) variables. Categorical variables were compared using Chi-square or Fishers exact tests.

    A p-value<0.05 was considered statistically significant. Statistical analysis was done using IBM SPSS® software (version 26.0).

    Results

    We analyzed 38 patients with BD under IMT.

    Demographic Features and Uveitis Characterization

    The mean total follow-up time of patients in this sample was 122.5 ± 62.6 months [10–250]. Patients’ mean age was 44.1 ± 11.6 [24–70] and 20 patients were women (52.6%).

    Fourteen (36.8%) presented with anterior uveitis, which include iritis, iridocyclitis and anterior cyclitis. Three patients (7.9%) were diagnosed with posterior uveitis, which included choroiditis and/or retinitis. While retinal vasculitis could technically be classified as posterior uveitis, we opted to distinguish it as a separate entity since twelve patients (31.6%) presented specifically with vasculitis. Three patients exhibited with intermediate uveitis (7.9%), which included pars planitis, posterior cyclitis and hyalitis, and five patients had panuveitis (13.2%), which included anterior chamber, vitreous and retina or choroid. One presented with optic neuritis (2.6%).11,12 Twenty-four patients (63.2%) presented with bilateral uveitis and twenty-six patients (68.4%) had uveitis as their first presentation of the disease (Table 1).

    Table 1 Demographics and Uveitis Characterization

    Treatment

    The median duration of treatment was 63.50 ± 59.1 [4–201] months. Among the patients, 24 (63.2%) received IMT for at least 48 months, and 16 (50%) were treated for a minimum of 72 months.

    Azathioprine was the most widely used immunomodulatory agent (n = 14, 36.8%). Cyclosporine was the second mostly used (n = 11, 28.9%). Adalimumab was used in 4 patients, (10.5%) of which three were already on cyclosporine and one on azathioprine and infliximab. Infliximab was used in 3 patients (7.9%), of which one was already on cyclosporine, and methotrexate was used in 2 patients (5.3%). Ocular inflammation was effectively managed with a combination of methotrexate and adalimumab in 2 patients (5.3%). In one patient (2.6%), inflammation was controlled using a combination of infliximab and azathioprine. Additionally, azathioprine and cyclosporine were administered in 1 patient (2.6%). Twenty-two patients (57.9%) effectively managed ocular inflammation after the first immunomodulator.

    Before IMT patients presented with a median of 2 ± 2.0 [0–10] relapses per year, a number that significantly decreased to a median of 1 ±1.2 [0–4] with the introduction of IMT (p< 0.001).

    Twenty-eight patients only used non-biological treatment (methotrexate, cyclosporine and azathioprine), 7 patients only used biological treatment (infliximab and adalimumab) and 3 patients used a combination between biological and non-biological treatment. There was a slight superiority of biological IMT compared to non-biological IMT in reducing the number of recurrences after treatment (p = 0.045).

    Seventeen patients with only non-biological treatment needed adjuvant oral corticosteroids and no patients with biological treatment needed adjuvant oral corticosteroids. Two patients (5.3%) used periocular corticosteroids (Table 2).

    Table 2 Treatment and Inflammation Control. Comparison Between the Number of Relapses per year Before and After IMT

    In Table 3 LogMAR (Logarithm of the minimum angle of resolution) is the scale used to quantify visual acuity in this population. There was no correlation between LogMAR and the severity of uveitis in Behçet’s disease in our sample.

    Table 3 Visual Acuity After Starting Systemic Immunomodulatory Therapy- LogMAR

    Treatment Discontinuation and Relapse Profile

    Sixteen patients (42.1%) stopped treatment: 6 cases (37.5%) as medical based decision because of long-term remission of the disease, 5 cases (31.3%) because of loss of follow-up, 3 cases (18.8%) because of side effects of the medication and 2 cases (12.5%) because of patient unadvised decision.

    Patients who discontinued treatment based on medical decisions had a median treatment duration of 77 months. Those who stopped due to side effects were treated for a median of 43 months. Similarly, patients who discontinued treatment because of loss of follow-up or unadvised decision had a median treatment duration of 48 months (Table 4).

    Table 4 Incidence of Treatment Discontinuation and Relapse Profile

    Patients were monitored for a median of 57 ± 46.4 months after stopping treatment, during which 4 (30.8%) out of 16 patients developed recurrence after a median period of 13 ± 10.4 months, range [2–27]. Two of these patients were treated for less than 4 years and all of them were treated for less than 6 years.

    Eight of the 12 patients who did not relapse had been treated for more than 4 years, and 4 of the 12 patients who did not relapse had been treated for more than 6 years, without any predominance regarding the type of IMT used. Five of the 6 patients who stopped IMT because of a medical based decision had been treated for a minimum of 4 years and no relapse of ocular inflammation occurred among them.

    Discussion

    This study aims to provide a comprehensive review of the most significant aspects of systemic IMT for uveitis in the context of Behçet’s disease. Behçet’s disease uveitis may frequently lead to blindness when left uncontrolled or inadequately treated. Early initiation of appropriate treatment is crucial to improving the prognosis and preventing vision loss and ocular complications.13 Clear therapeutic guidelines and protocols regarding the appropriate duration of IMT for patients with BD uveitis have not yet been established.

    Our study presented a mean follow-up period of patients with Behçet’s uveitis of around 10 years. This extensive follow-up period provides valuable insight into the long-term effectiveness of appropriate treatment in controlling the disease. It allows us to see the potential of preventing recurring episodes of intraocular inflammation, which could result in severe complications and permanent visual impairment.

    The mean age of the patients was 44 years, with a range between 24 and 70 years, which reflects individuals with Bechet’s disease who are monitored at the hospital over varying follow-up periods, highlighting the broad age distribution within this population. The gender distribution in this population was balanced, with 47.4% men and 52.6% women.

    Regarding ocular manifestations, anterior uveitis was the most common isolated presentation. Several factors, including, early detection of ocular involvement, and possible regional variations in clinical phenotype may influence this finding.

    As a hallmark of Behçet’s disease, vasculitis was the second most common type of inflammatory ocular disease. Also, if posterior uveitis is split into its usual subcategories—choroiditis, retinitis, and vasculitis—the combined cases of posterior segment involvement exceed those of anterior uveitis. Therefore, it is of note the predominance of posterior segment involvement, often in the form of retinal vasculitis, which is in line with other publications.1 Panuveitis is the third most common type of inflammatory ocular disease. Additionally, there is a high proportion of bilateral involvement, which aligns with findings from other studies.1

    Also, in two-thirds of cases uveitis was the first manifestation of the disease, emphasizing the potential for the screening of early ocular signs as an important diagnostic indicator in Behçet’s disease. An early diagnosis often correlates with a more favorable prognosis.

    IMT significantly reduces the frequency of relapses as a reflex of its improved control of disease activity in Behçet’s disease, preventing long-term complications, including organ damage and disability, which is consistent with existing literature. Azathioprine was the most used systemic immunomodulatory drug for the treatment of uveitis in BD and cyclosporine was the second most widely used agent. Several studies agree with azathioprine and cyclosporine as first-line immunosuppressive options for uveitis in Behçet’s disease.14,15 The introduction of biologic therapies such as infliximab and adalimumab after the failure of non-biological immunomodulatory agents (azathioprine and cyclosporine), are deemed a better approach for refractory cases.8,16 The combination of biological and non-biological therapies, such as methotrexate and adalimumab or infliximab and azathioprine can be used in certain cases of treatment-resistant uveitis with the intention of reducing the immunogenicity of these biological agents and thus improving their efficacy. More than half the patients were controlled after the first immunomodulator. There was a slight, but not clear, superiority of biological IMT compared to non-biological IMT in reducing the number of recurrences after treatment.17 This comparison should be interpreted with caution due to the small sample of the biological subgroup.

    Periocular corticosteroids injections were needed in 2 patients as adjunctive therapy because of acute severe recurrences to alleviate symptoms. Patients on non-biological treatments only required more adjuvant corticosteroids in comparison to those on biological therapies. This finding suggests that biological treatment may act as superior corticosteroid-sparing agents, effectively controlling ocular inflammation without the need for prolonged corticosteroid use, and usually with better tolerance (fewer well-documented side effects).16,18

    Regarding tolerance, only 3 of 38 patients stopped treatment. One patient discontinued treatment because of side effects from azathioprine, including diarrhea and hepatic toxicity, while two others chose to stop treatment due to a desire to become pregnant. This represents an overall favorable safety profile.

    In our study, about two thirds were treated for more than 4 years and half were treated for more than 6 years. IMT was associated with a statistically significant decrease in the number of relapses per year, defined as an increase in inflammatory activity following a period of remission.

    The patients who stopped IMT because of medical decision (6 out of 38 patients) had a median treatment duration around 6 years. Eight out of twelve patients who stopped treatment and were treated for more than 4 years did not relapse and all the patients who stopped treatment and were treated for more than 6 years (4 patients) did not relapse.

    Regarding the 4 patients (30.8%) with relapse after stopping treatment, 2 of these have been treated for less than 4 years and all of them had been treated for less than 6 years. The median time for recurrence after discontinuation was 13 months, ranging from 2–27 months, and it did not appear to be influenced by the duration of treatment among those who relapsed (maximum 66 months). This result must be outlined in the median period of surveillance of 57 months after IMT cessation.

    The medical decision to stop IMT after 4–6 years of complete remission appears to be a safe approach, especially in patients who were treated for 6 years, without increasing the incidence of recurrence.

    Our study limitations include its small sample size and single-center design. The data collected focused on ophthalmological parameters, and information on extraocular manifestations, such as mucocutaneous or visceral lesions, was not consistently or systematically available. This limitation restricts the analysis of the systemic complexity of the disease and should be taken into account when interpreting the results.

    Nonetheless, as a tertiary hospital, we were able to analyze a cohort of patients with uveitis in the context of a rare but sight-threatening disease with a significant length of follow-up, which is an advantage regarding long-term evaluation and follow-up of these patients. This kind of revision may possibly shed some light into specific characteristics of each group, thus allowing for the definition of management protocols in the future.

    Conclusion

    Most of the patients with Behcet’s uveitis needed IMT to effectively control the ocular inflammation and thus achieve durable remission. Azathioprine and cyclosporine were the most used systemic immunomodulatory drugs for the treatment of uveitis in the context of Behcet’s disease and are a safe first line approach for Behcet’s uveitis.

    A medical decision to discontinue treatment after 4 to 6 years of sustained inflammation control appears to be safe, particularly in patients who were treated for 6 years.

    Abbreviations

    BD, behçet disease; IMT, immunomodulatory therapy.

    Data Sharing Statement

    Access to any information such as the study protocol or anonymized data can be available upon reasonable request.

    Ethics/Ethical Approval

    The study was approved by the Institutional Ethics Review Board of Centro Hospitalar Universitário de São João, Porto, Portugal. The protocol conformed with the canons of the declaration of Helsinki for research involving human participants, as well the European Union’s General Data Protection Regulation. Informed consent was waived due to the retrospective nature of the study and the protection of patient data confidentiality. This article was redacted according to the recommendations of the Reporting of Studies Conducted using Observational Routinely-collected health Data (RECORD) statement.

    Acknowledgments

    Only the named authors have collaborated in the writing of this paper.

    Author Contributions

    All authors contributed to the study conception and design. Material preparation was performed by Luís Figueira, Joana Rodrigues Araújo and Ana Margarida Ferreira. Data collection was performed by Ana Margarida Ferreira and Mariana Almeida. Analysis was performed by Mariana Almeida and Luís Figueira. The first draft of the manuscript was written by Mariana Almeida, and all the authors took part in revising or critically reviewing the article. All authors read and approved the final manuscript.

    Funding

    The authors declare that they have no financial ties to declare. No funding or sponsors were undertaken in the preparation of the manuscript.

    Disclosure

    The authors have no conflicts of interest to declare for this work.

    References

    1. Emmi G, Bettiol A, Hatemi G, Prisco D. Behçet’s syndrome. Lancet. 2024;403(10431):1093–1108. doi:10.1016/S0140-6736(23)02629-6

    2. van der Houwen TB, van Hagen PM, van Laar JAM. Immunopathogenesis of Behçet’s disease and treatment modalities. Semin Arthritis Rheum. 2022;52:151956. doi:10.1016/j.semarthrit.2022.151956

    3. Tugal-Tutkun I. Behcet’s Uveitis. Middle East Afr J Ophthalmol. 2009;16(4):219–224. doi:10.4103/0974-9233.58425

    4. Zhong Z, Su G, Yang P. Risk factors, clinical features and treatment of Behçet’s disease uveitis. Prog Retin Eye Res. 2023;97:101216. doi:10.1016/j.preteyeres.2023.101216

    5. Lu A, Li K, Zhang X, Su G, Yang P. Development and validation of novel retina biomarkers and artificial intelligence models for Behçet disease uveitis prediction. Biomed Signal Process Control. 2024;94:106271.

    6. Karadag O, Bolek EC. Management of Behcet’s syndrome. Rheumatology. 2020;59(Suppl 3):iii108–iii117. doi:10.1093/rheumatology/keaa086

    7. Joubert M, Desbois AC, Domont F, et al. Behçet’s disease uveitis. J Clin Med. 2023;12(11):3648. doi:10.3390/jcm12113648

    8. McNally TW, Damato EM, Murray PI, Denniston AK, Barry RJ. An update on the use of biologic therapies in the management of uveitis in Behçet’s disease: a comprehensive review. Orphanet J Rare Dis. 2017;12(1):130. doi:10.1186/s13023-017-0681-6

    9. Leclercq M, Langlois V, Girszyn N, et al. Comparison of conventional immunosuppressive drugs versus anti-TNF-α agents in non-infectious non-anterior uveitis. J Autoimmun. 2020;113:102481. doi:10.1016/j.jaut.2020.102481

    10. Malek Mahdavi A, Khabbazi A, Hajialilo M. Long-term outcome and predictors of remission in Behçet’s disease in daily practice. Mod Rheumatol. 2021;31(6):1148–1157. doi:10.1080/14397595.2021.1886623

    11. Deuter CM, Kötter I, Wallace GR, Murray PI, Stübiger N, Zierhut M. Behçet’s disease: ocular effects and treatment. Prog Retin Eye Res. 2008;27(1):111–136. doi:10.1016/j.preteyeres.2007.09.002

    12. Jabs DA, Dick AD, Dunn JP. Classification criteria for Behçet disease uveitis. Am J Ophthalmol. 2021;228:80–88. doi:10.1016/j.ajo.2021.03.058

    13. Dick AD, Tundia N, Sorg R, et al. Risk of ocular complications in patients with noninfectious intermediate uveitis, posterior uveitis, or panuveitis. Ophthalmology. 2016;123(3):655–662. doi:10.1016/j.ophtha.2015.10.028

    14. Alibaz-Oner F, Direskeneli H. Advances in the treatment of Behcet’s disease. Curr Rheumatol Rep. 2021;23(6):47. doi:10.1007/s11926-021-01011-z

    15. Hatemi G, Christensen R, Bang D, et al. 2018 update of the EULAR recommendations for the management of Behçet’s syndrome. Ann Rheum Dis. 2018;77(6):808–818. doi:10.1136/annrheumdis-2018-213225

    16. Vallet H, Riviere S, Sanna A, et al. Efficacy of anti-TNF alpha in severe and/or refractory Behçet’s disease: multicenter study of 124 patients. J Autoimmun. 2015;62:67–74. doi:10.1016/j.jaut.2015.06.005

    17. Urruticoechea-Arana A, Cobo-Ibáñez T, Villaverde-García V, et al. Efficacy and safety of biological therapy compared to synthetic immunomodulatory drugs or placebo in the treatment of Behçet’s disease associated uveitis: a systematic review. Rheumatol Int. 2019;39(1):47–58. doi:10.1007/s00296-018-4193-z

    18. Li B, Li H, Huang Q, Zheng Y. Optimizing glucocorticoid therapy for Behçet’s uveitis: efficacy, adverse effects, and advances in combination approaches. Int Ophthalmol. 2023;43(11):4373–4381. doi:10.1007/s10792-023-02808-w

    Continue Reading

  • Staying active with osteoporosis – 6 simple exercises to strengthen bones – Rest Less

    1. Staying active with osteoporosis – 6 simple exercises to strengthen bones  Rest Less
    2. Boost your bones – 16 Feb 2021 – Healthy For Men Magazine  Readly | All magazines – one magazine app subscription
    3. Experts Say These Small And Easy Fitness Items Can Help Improve Your Bone Density  HuffPost
    4. Bone and joint health – 11 Jun 2025 – Vegan Food & Living Magazine  Readly | All magazines – one magazine app subscription

    Continue Reading

  • Demystifying the Gut Microbiome With AI

    Demystifying the Gut Microbiome With AI

    Gut bacteria are fundamental to many aspects of human health, from digestion to immunity. Yet, the complexities of these microbial communities – along with the vast number of different species and metabolites they produce – make it challenging to study how they interact with the body.

    Researchers at the University of Tokyo have applied a type of artificial intelligence (AI) technique to explore large datasets on gut bacteria, aiming to uncover relationships that traditional analytical tools have struggled to reveal.

    Their advance is published in Briefings in Bioinformatics.

    Challenges in mapping microbial interactions

    The human body hosts around 30 to 40 trillion cells, yet the intestines house approximately 100 trillion bacteria. These microbes play critical roles in digesting food, but they also influence metabolism, immune responses, and even mental health.

    The bacteria produce a wide variety of metabolites, which act as molecular messengers throughout the body. Understanding the intricate relationships between these bacteria and their metabolites could open the door to personalized treatments for a range of health conditions.

    “The problem is that we’re only beginning to understand which bacteria produce which human metabolites and how these relationships change in different diseases,” said project researcher Tung Dang, from the Tsunoda lab in the Department of Biological Sciences. “By accurately mapping these bacteria-chemical relationships, we could potentially develop personalized treatments. Imagine being able to grow a specific bacterium to produce beneficial human metabolites or designing targeted therapies that modify these metabolites to treat diseases.”

    However, identifying meaningful patterns within the vast amounts of data generated by gut microbiome studies is a complex task. The sheer number of bacteria and metabolites involved, combined with their interactions, presents a formidable analytical problem.

    Bayesian neural networks to the rescue

    To tackle this challenge, Dang and his team began to explore whether state-of-the-art AI tools could be applied to this problem. The result – a variable Bayesian neural network model known as VBayesMM.

    “Our system, VBayesMM, automatically distinguishes the key players that significantly influence metabolites from the vast background of less relevant microbes, while also acknowledging uncertainty about the predicted relationships, rather than providing overconfident but potentially wrong answers,” said Dang.

    Bayesian neural network

    A type of artificial intelligence model that uses probability theory to manage uncertainty in predictions. This method is particularly useful in complex datasets, where traditional models may not adequately account for uncertainties or variability.

    “When tested on real data from sleep disorder, obesity and cancer studies, our approach consistently outperformed existing methods and identified specific bacterial families that align with known biological processes, giving confidence that it discovers real biological relationships rather than meaningless statistical patterns,” said Dang.

    One of the main advantages of VBayesMM is that it can handle and communicate uncertainty, which can give researchers more confidence in its outputs than a tool which cannot. The system is also optimized to cope with heavy analytical workloads, such as the huge datasets that must be processed to understand the gut microbiome.

    Limitations and future improvements

    Despite its advantages, the system is not without limitations. One key challenge is the need for more detailed bacterial data compared to the metabolites they produce. When the available bacterial data is insufficient, the system’s accuracy drops. Additionally, the model assumes that microbes act independently, though in reality, they interact in highly complex ways, making it difficult to model these relationships fully. Despite its optimization for heavy workloads, the system does still carry a relatively high computational cost which may be a barrier to some groups.

    Looking ahead, Dang and his team plan to integrate more comprehensive datasets that include a broader range of bacterial metabolites.

    “We plan to work with more comprehensive chemical datasets that capture the complete range of bacterial products, though this creates new challenges in determining whether chemicals come from bacteria, the human body or external sources like diet,” said Dang.

    “We also aim to make VBayesMM more robust when analyzing diverse patient populations, incorporating bacterial ‘family tree’ relationships to make better predictions, and further reducing the computational time needed for analysis.”

    With these improvements and adjustments, the team hopes that the insights gained from this work could lead to new clinical treatments based on the manipulation of the microbiome.

    “For clinical applications, the ultimate goal is identifying specific bacterial targets for treatments or dietary interventions that could actually help patients, moving from basic research toward practical medical applications,” Dang said.

    Reference: Dang T, Lysenko A, Boroevich KA, Tsunoda T. VBayesMM: variational Bayesian neural network to prioritize important relationships of high-dimensional microbiome multiomics data. Brief Bioinform. 2025;26(4). doi: 10.1093/bib/bbaf300

    This article has been republished from the following materials. Note: material may have been edited for length and content. For further information, please contact the cited source. Our press release publishing policy can be accessed here.

    This content includes text that has been generated with the assistance of AI. Technology Networks’ AI policy can be found here.

    Continue Reading

  • Independent Association of Sleep Apnea-Specific Hypoxic Burden and Sle

    Independent Association of Sleep Apnea-Specific Hypoxic Burden and Sle

    Background

    Obstructive sleep apnea (OSA), characterized by recurrent upper airway collapse during sleep, leads to chronic intermittent hypoxia (CIH), sleep fragmentation, and systemic pathophysiological changes.1–3 Globally affecting nearly 1 billion people,4 OSA poses a growing public health challenge.5

    In recent years, the bidirectional link between OSA and endocrine/metabolic disorders has gained significant attention,6 particularly the nuanced relationship between OSA and thyroid function.7 Thyroid hormones, regulated by the hypothalamic-pituitary-thyroid (HPT) axis, play critical roles in metabolism and cardiovascular function.8–11 Notably, the evidence regarding the association between OSA and thyroid function remains inconsistent. Some studies suggest a subtle connection, such as hypothyroidism exacerbating OSA through airway narrowing7 and OSA-induced oxidative stress impairing thyroid hormone synthesis,12–15 other research, however, indicates no significant associations.16 Our previous study revealed that the progression of OSA may promote increased levels of TH, especially FT3, in non-elderly individuals.17 Adding to this inconsistency, several studies have reported an association between hypothyroidism and OSA severity.18 Together, these divergent findings highlight the need to clarify the contentious relationship between OSA and thyroid function, including its specific mechanisms and bidirectional interactions.

    The sleep apnea-specific hypoxic burden (SASHB) and sleep breathing impairment index (SBII) are crucial early indicators for assessing hypoxia in OSA, comprehensively capturing respiratory event frequency, depth, and hypoxia duration.19,20 They can reflect the physiological impact of CIH more accurately than the traditional AHI.21 This focus on oxygen saturation dynamics is particularly relevant for studying thyroid function, as thyroid hormone synthesis and release are highly sensitive to hypoxic stress. By integrating hypoxia intensity and duration, SASHB and SBII offer a more precise tool for dissecting how CIH modulates thyroid hormone levels. Notably, SASHB has already been linked to glucose and lipid metabolism abnormalities22 and cardiovascular risks,23,24 underscoring its utility in capturing hypoxia-related endocrine and metabolic dysfunction. However, no relevant studies have been conducted on the relationships among the SASHB, the SBII, and thyroid function.

    Sleep consists of rapid eye movement (REM) and non-rapid eye movement (NREM) stages,25 with distinct physiological profiles influencing respiratory function. REM sleep, characterized by heightened brain activity and muscle atonia,25–27 contrasts with NREM sleep, where physiological functions like heart rate and respiration slow, promoting recovery.25,26 Patients with OSA exhibit more severe airway collapse during REM sleep, likely due to stage-specific neuromuscular regulation.28 Therefore, it is crucial to consider the impact of different sleep stages on physiological functions when studying the relationship between OSA and thyroid function.

    Therefore, this study aimed to explore the thyroid function changes in patients with OSA and analyze the intrinsic connections between SASHB, SBII, and thyroid function indicators (such as thyroid hormones and antibodies). Additionally, this study focused on the associations between the SASHB and SBII during different sleep stages and thyroid function, which have never been explored previously. This research is of great theoretical and practical importance for comprehensively understanding the mechanisms by which OSA affects thyroid function, optimizing clinical diagnostic strategies, and developing targeted therapeutic interventions.

    Subjects and Methods

    Study Design and Participants

    This retrospective study included 1681 individuals with suspected OSA who visited the Department of Otorhinolaryngology at Xi’an Jiaotong University Second Affiliated Hospital from August 2017 to March 2024. Participants were included if they (1) were ≥18 years of age; (2) had undergone overnight polysomnography (PSG) and were diagnosed with OSA; and (3) had complete TH and antibody test results. The exclusion criteria were as follows: (1) history of OSA treatment; (2) severe systemic diseases, such as heart, liver, lung, and kidney failure; (3) other non-OSA sleep disorders; (4) severe mental illnesses or malignant tumors; (5) use of sedatives or medications that may interfere with thyroid function; (6) missing clinical PSG data. After stringent screening, 452 participants with complete data were included in this study. The entire recruitment process is illustrated in Figure 1.

    Figure 1 Summary of patient inclusion and exclusion criteria.

    This study strictly adhered to the tenets of the Declaration of Helsinki and was approved by the Ethics Committee of Xi’an Jiaotong University Second Affiliated Hospital (Approval No. 2022–1417), with all participants providing informed consent.

    Data Elements

    A total of 35 relevant clinical parameters were collected in this study, including the following candidate variables: (1) demographic characteristics, including sex and age; (2) anthropometric measures, including body mass index (BMI), neck circumference (NC) and waist circumference (WC), (3) comorbidities, including history of diabetes, coronary heart disease (CHD) and hypertension; (4) lifestyle habits, including smoking and alcohol use; (5) OSA-related history and indicators, including total sleep time (TST) recorded during the overnight PSG study, Epworth Sleepiness Scale (ESS),29 mean apnea duration, maximum apnea duration, apnea–hypopnea index (AHI), lowest nocturnal peripheral oxygen saturation (Lowest SpO2), time spent with peripheral oxygen saturation <90% (T90), percentage of time spent with peripheral oxygen saturation <90% (CT90), average heart rate during sleep, lowest heart rate during sleep, highest heart rate during sleep, SASHB, SASHB during NREM sleep (NREM-SASHB), SASHB during REM sleep (REM-SASHB); SBII, SBII during NREM sleep (NREM-SBII), and SBII during REM sleep (REM-SBII); (6) thyroid function-related indicators, including serum free triiodothyronine (FT3, pmol/L), serum free thyroxine (FT4, pmol/L), serum total triiodothyronine (TT3, nmol/L), serum total thyroxine (TT4, nmol/L), serum thyroid stimulating hormone (TSH, mIU/L), thyroid peroxidase antibodies (Anti-TPO, IU/mL), thyroid globulin antibodies (Anti-TG, IU/mL), and reverse triiodothyronine (RT3, ng/dL). All fasting venous blood samples were collected between 7:00 and 8:00 AM on the morning immediately following an overnight PSG study, under strict quality control protocols, with thyroid function indicators analyzed using standardized laboratory procedures.

    Sleep Evaluation

    To obtain accurate and objective sleep parameters, all enrolled patients underwent overnight PSG monitoring at the Sleep Center of the Department of Otorhinolaryngology-Head and Neck Surgery at the Second Affiliated Hospital of Xi’an Jiaotong University. All the records were evaluated by certified clinical PSG experts, who comprehensively analyzed various parameters, including electroencephalography, electrooculography, electromyography, electrocardiography, nasal and oral airflow recordings, oxygen saturation levels, chest movements, and muscle activity.

    The Epworth Sleepiness Scale (ESS) used in this study has been authorized by the copyright holder.

    Calculation and Definition

    The AHI is defined as the number of apnea and hypopnea events per hour during sleep. In addition, hypopnea is defined as an abnormal respiratory event lasting at least 10s with at least a 30% reduction in thoracoabdominal movement or airflow as compared with baseline and with at least a 4% oxygen desaturation.30 The SASHB is the total area under the baseline SpO2 curve corresponding to respiratory events per hour during sleep. REM-SASHB and NREM-SASHB refer to the SASHB during REM and NREM sleep, respectively. The SBII is defined as the sum of the duration of breathing events and the corresponding desaturation area per hour during sleep. Accordingly, REM-SBII and NREM-SBII are the SBII during REM and NREM sleep, respectively. In this study, the calculations for SASHB and SBII were based on laboratory test data, including nasal airflow and blood oxygen saturation trend graphs. Using the algorithms developed by Ali Azarbarzin19 and Wenhao Cao,20 we created calculation codes for SASHB and SBII using Python software (version 3.7), enabling efficient batch processing of the raw data. In this study, when the severity of OSA was evaluated by the AHI, patients were categorized according to the number of events per hour: mild OSA was defined as an AHI of 5 to less than 15, moderate OSA was defined as an AHI of 15 to less than 30, and severe OSA was defined as an AHI of 30 or higher. In addition, when the severity of OSA was assessed by the SASHB and SBII, patients were grouped according to quartiles.

    Statistical Analysis

    The statistical analyses were conducted using R software (version 4.3.2) and SPSS 26.0 (IBM Corporation, Armonk, NY, USA). If the data were normally distributed, the continuous variables were expressed as the means ± standard deviations; if the data were nonnormally distributed, they were expressed as the medians and interquartile ranges. Categorical variables are presented as counts (n) and percentages (%). First, OSA severity was assessed according to the AHI, SASHB, and SBII, and descriptive statistics were calculated. The Kruskal‒Wallis H-test was used for continuous variables, and the chi-square test was employed for categorical variables to examine intergroup differences in descriptive statistics. Additionally, Spearman correlation analysis was performed to assess the associations between thyroid function parameters and sleep parameters, with Benjamini–Hochberg false discovery rate (FDR) correction applied to account for multiple testing. Furthermore, multiple linear regression analysis was performed to evaluate the independent relationships between sleep parameters and thyroid hormone levels, adjusting for potential confounding factors. Sex-stratified analyses were also performed, with separate multiple linear regression models constructed for male and female subgroups to explore sex-specific associations. Moreover, collinearity diagnostics were conducted before statistical analysis to eliminate potential multicollinearity among the variables. All the statistical tests were two-tailed, with the significance level set at p < 0.05.

    Results

    Baseline and Sleep Parameter Characteristics

    A total of 452 patients with OSA, 395 males and 57 females, were included in this study. Significant baseline differences were observed across AHI severity groups (all p < 0.05, Table 1). The male proportion increased with AHI severity, while BMI, NC, and WC showed an upward trend. Hypertension history, smoking, and alcohol use were more prevalent in the severe OSA group (23.51%, 70.82%, and 81.87%, respectively). Sleep parameters, including ESS, hypoxia duration (T90, CT90), and mean heart rate, worsened with increasing AHI, whereas Lowest SpO2 decreased progressively.

    Table 1 Demographic Characteristics and Sleep Parameters of Patients According to the AHI

    Thyroid Function Indicators

    The relationship between OSA and thyroid function was explored in depth. When OSA severity was evaluated by the AHI, the results indicated significant differences in FT3, FT4, and TT3 levels among the mild, moderate, and severe OSA groups (all p < 0.05). Specifically, Dunn’s multiple comparison tests revealed significant differences in FT3 between the mild and moderate OSA groups (p < 0.01) and between the mild and severe OSA groups (p < 0.001); FT4 also showed significant differences between the mild and moderate OSA groups (p < 0.01) and between the mild and severe OSA groups (p < 0.01). TT3 differed only between the mild and severe OSA groups (p < 0.05). However, there were no significant differences in TT4, TSH, Anti-TPO, Anti-TG, or RT3 levels (all p > 0.05) (Figure 2 and Table 2).

    Table 2 Analysis of Thyroid Indicators According to AHI Severity

    Figure 2 Mean values of FT3, FT4, and TT3 at the AHI level. (a) FT3; (b) FT4; (c) TT3. *P < 0.05, **P < 0.01, ****P < 0.0001.

    Abbreviations: FT3, serum free triiodothyronine; FT4, serum free thyroxine; TT3, serum total triiodothyronine; AHI, apnea–hypopnea index.

    In addition to being grouped by the AHI, patients were also classified according to SASHB (≤21.38, 21.38–74.47, 74.47–221.21, and >221.21) and SBII (≤9.53, 9.53–36.05, 36.05–110.34, and >110.34) quartiles. In the analysis of intergroup differences, thyroid function indicators exhibited complex and diverse trends. There were statistically significant differences in the FT3 levels in the SASHB and SBII quartiles (all p < 0.01). With the gradual increase in the SASHB and SBII quartiles, the FT3 levels tended to increase. Although FT4 exhibited a meaningful intergroup difference when grouped by SBII severity (p < 0.05), post hoc multiple comparisons revealed no significant differences in the FT4 levels across groups. Additionally, as the SBII increased, the TSH tended to decrease initially and then increase (Figures 3 and 4, Table 3 and Table 4).

    Table 3 Analysis of Thyroid Indicators According to SASHB Severity

    Table 4 Analysis of Thyroid Indicators According to SBII Severity

    Figure 3 Mean values of FT3 and FT4 at the SASHB level. (a) FT3; (b) FT4. *P < 0.05, **P < 0.01.

    Abbreviations: FT3, serum free triiodothyronine; FT4, serum free thyroxine; SASHB, sleep apnea-specific hypoxic burden.

    Figure 4 Mean values of FT3, FT4, and TSH at the SBII level. (a) FT3; (b) FT4; (c) TSH. *P < 0.05, **P < 0.01.

    Abbreviations: FT3, serum free triiodothyronine; FT4, serum free thyroxine; TSH, serum thyroid stimulating hormone; SBII, sleep breathing impairment index.

    To further explore correlations among the SASHB, the SBII, and thyroid function during the NREM and REM periods, patients were regrouped according to REM-SASHB, NREM-SASHB, REM-SBII, and NREM-SBII severity. Focusing first on NREM sleep, significant differences in FT3, FT4, and TSH levels were found among the groups according to NREM-SASHB and NREM-SBII severity (all p < 0.05), with TSH levels initially decreasing but then increasing. The specific results of the multiple comparison tests are presented in Figure S1. In REM sleep, only FT3 levels differed between the REM-SASHB and REM-SBII groups (all p < 0.05) (Tables S1S4; Figures S1 and S2).

    Exploration of the Correlation of Variables and Regression Analysis

    Based on the correlation analysis results after FDR correction, we initially explored the correlations between PSG and thyroid function variables, demonstrating the necessity of regression analysis. FT3 was significantly positively correlated with AHI, mean apnea duration, T90, CT90, REM-SASHB, NREM-SASHB, SASHB, REM-SBII, NREM-SBII and SBII (all q < 0.05), and negatively correlated with lowest SpO2 (q < 0.05). FT4 was significantly positively correlated with TST and maximum heart rate (both q < 0.05). TT3 was significantly positively correlated with AHI, mean heart rate and maximum heart rate (all q < 0.05). Anti-TPO was significantly positively correlated with TST and T90, and negatively correlated with lowest SpO2 (all q < 0.05). The negative correlation between TSH and NREM-SBII did not remain significant after correction (q > 0.05), while TT4, Anti-TG and RT3 showed no significant correlations (all q > 0.05). These results further demonstrate the necessity of regression analysis to explore the independent associations (Tables S5 and S6, Figure 5).

    Figure 5 Heatmap of the correlations between sleep parameters and thyroid parameters.

    Abbreviations: TST, total sleep time; AHI, apnea–hypopnea index; Lowest SpO2, lowest oxygen saturation at night; T90, sleep time spent with oxygen saturation below 90%; CT90, the percentage of sleep time with oxygen saturation below 90%; REM-SASHB, sleep apnea-specific hypoxic burden during rapid eye movement sleep; NREM-SASHB, sleep apnea-specific hypoxic burden during non-rapid eye movement sleep; SASHB, sleep apnea-specific hypoxic burden; REM-SBII, sleep breathing impairment index during rapid eye movement sleep; NREM-SBII, sleep breathing impairment index during non-rapid eye movement sleep; SBII, sleep breathing impairment index; FT3, serum free triiodothyronine; FT4, serum free thyroxine; TT3, serum total triiodothyronine; TT4, secretes total thyroxine; TSH, serum thyroid stimulating hormone; Anti-TPO, thyroid peroxidase antibodies; Anti-TG, thyroid globulin antibodies; RT3, reverse triiodothyronine.

    After fully adjusting for confounding factors, including age, sex and BMI, SASHB (β = 0.145; p < 0.01), NREM-SASHB (β = 0.127; p < 0.05), REM-SASHB (β = 0.137; p < 0.01), SBII (β = 0.132; p < 0.01), NREM-SBII (β = 0.095; p < 0.05), and REM-SBII (β = 0.145; p < 0.01) were independently associated with elevated FT3 levels, whereas the AHI was not independently associated with FT3 levels (Table 5).

    Table 5 Stepwise Multiple Linear Regression for Thyroid Indicators

    In the male subgroup, multiple linear regression models were used to evaluate the associations between the AHI, SASHB, SBII, and thyroid function. In the same models, independent correlations were observed between SASHB (β = 0.152; p < 0.01), NREM-SASHB (β = 0.130; p < 0.05), REM-SASHB (β = 0.159; p < 0.01), SBII (β = 0.143; p < 0.01), NREM-SBII (β = 0.103; p < 0.05), and REM-SBII (β = 0.169; p < 0.01) with elevated FT3 levels. However, no significant independent associations were observed between the AHI, SASHB, SBII, and thyroid function indicators in the female subgroup (Tables 6 and 7).

    Table 6 Stepwise Multiple Linear Regression Against Thyroid Indicators for Male Subgroups

    Table 7 Stepwise Multiple Linear Regression Against Thyroid Indicators for Female Subgroups

    Discussion

    This study focused on the characteristics of thyroid function in patients with OSA. By analyzing clinical data and PSG results from 452 patients with OSA, we specifically investigated the intrinsic relationships between the SASHB, the SBII, and thyroid function indicators (such as thyroid hormones and antibodies) and how these relationships manifest across different severities of OSA, sleep stages, and sex subgroups. After adjusting for multiple variables, the SASHB, NREM-SASHB, REM-SASHB, SBII, NREM-SBII, and REM-SBII were found to be independently associated with elevated FT3 levels in male patients, whereas no significant associations were observed in female subgroups.

    Existing research highlights a bidirectional link between OSA and thyroid dysfunction. Hypothyroidism is prevalent in 25–35% of patients with OSA.31 However, the prevalence of OSA in patients with hypothyroidism is also high.32,33 Our data align with this interplay: thyroid function indicators varied significantly across AHI groups, reinforcing the complex relationship between OSA severity and thyroid hormones. In previous studies conducted by our team, we reported that the progression of OSA in nonelderly individuals might promote an increase in thyroid hormone levels, particularly FT3, driven by oxidative stress and inflammation.17 This study further confirms this finding. Mechanistically, this interplay might can be explained by distinct responses to varying hypoxia severity. Mild hypoxia triggers compensatory thyroid hormone secretion via HPT axis activation. Conversely, severe hypoxia induces oxidative stress-mediated injury to thyroid follicular cells, impairing thyroid hormone synthesis.12,13 Notably, most thyroid hormone levels in our cohort remained within normal ranges, potentially explaining discrepancies in prior studies.

    The specific associations between SASHB, SBII, and thyroid function found in this study are novel. Existing research suggests that CIH in OSA can alter endocrine function by influencing thyroid hormone synthesis and release via the HPT axis, thereby affecting metabolic state.14,34 Therefore, incorporating the depth and duration of CIH into thyroid function assessments is meaningful. Our analysis revealed that FT3 levels increased with higher SASHB and SBII quartiles, possibly due to hypoxia stimulating thyroid cells and affecting FT3 secretion. Regarding FT4, although there was a trend of differences in the SBII group comparisons, post hoc multiple comparisons revealed no significant differences, suggesting that the mechanisms by which FT4 is affected by OSA might be more complex, possibly involving other yet unidentified regulatory factors. Additionally, the trend of TSH levels initially decreasing and then increasing with SBII might indicate an early attempt to maintain thyroid stability via negative feedback, which becomes imbalanced as OSA progresses. Notably, a significant correlation was found between FT3 levels, SASHB and SBII, but not with AHI. This result strongly suggests that the SASHB and SBII capture key information that the AHI cannot encompass, thereby providing more accurate and sensitive insight into the intrinsic relationship between OSA and thyroid function.

    The interplay between sleep stages and thyroid function was an interesting finding. Previous studies often focused on comparing the AHI during REM and NREM periods, classifying OSA populations into REM phenotypes and NREM phenotypes,35,36 rather than studying the related sleep indicators for REM and NREM independently as a whole. Recently, more researchers have begun to recognize this, with one study finding a correlation between OSA during REM and NREM sleep and lipid levels.37 These findings suggest that different sleep stages significantly impact endocrine and metabolic functions. In our study, the relationships between thyroid function indicators and OSA-related indicators differed during NREM and REM sleep. In NREM sleep, the FT3, FT4, and TSH levels significantly differed, with TSH initially decreasing but then increasing. This finding may be related to the physiological characteristics of NREM sleep. NREM sleep accounts for the majority of total sleep duration and is predominantly mediated by the parasympathetic nervous system,27 during which metabolic and endocrine functions are relatively stable.25 The deep stages of NREM sleep are particularly associated with the secretion of growth hormone,38 significantly impacting thyroid function. Therefore, a greater SASHB and SBII during NREM sleep suggest that the patient experiences frequent or prolonged hypoxic and low oxygen saturation states during this phase, potentially leading to reduced secretion of thyroid hormones that might otherwise increase. In our study, only FT3 levels differed in relation to the REM-related SASHB and SBII groups, increasing with the severity of OSA. During REM sleep, increased sympathetic nervous system activity and a high metabolic state may suppress thyroid hormone secretion.26,27 Thus, a higher SASHB and SBII during REM sleep indicate that frequent or prolonged hypoxia overrides typical REM-related thyroid hormone suppression, resulting in increased secretion of TH. In summary, considering the physiological changes associated with different sleep stages and their regulatory effects on thyroid function may provide a basis for personalized treatment for patients with OSA.

    An unexpected finding was the absence of significant associations in the female subgroup, in contrast to male-specific correlations between SASHB, SBII and FT3. This disparity may stem from sex-specific hormonal influences on thyroid-hypoxia interactions. Estrogen can modulate thyroid hormone-binding globulin levels, subsequently affecting TH’s metabolism and activity.39 Therefore, we speculate that during the pathophysiological changes associated with OSA, the hormonal dynamics could introduce variability that obscures direct OSA-TH associations in female. Additionally, the relatively small number of female patients in this study (57) may have limited the statistical power to detect associations between the AHI, SASHB, SBII, and thyroid function indicators, failing to adequately reflect the true physiological relationships.

    This study is the first to investigate the relationships among the SASHB, the SBII, and thyroid function. Compared with the traditional AHI, these two indicators can more comprehensively reflect the characteristics of OSA-related respiratory events, capturing the degree of hypoxia and the duration and frequency of hypoxic events. By clearly establishing the independent correlations among FT3 and the SASHB and SBII, this study enriches our understanding of how OSA affects thyroid function and opens new avenues for research on the relationship between OSA and thyroid function. These findings suggest that future theoretical models should emphasize the impact of comprehensive quantitative indicators of sleep respiratory events on the endocrine system. Furthermore, unlike previous studies, we employed more refined sleep stage-related indicators to analyze their relationships with thyroid function indicators. Additionally, we conducted separate analyses for the male and female subgroups, revealing sex differences in the associations between OSA and thyroid function; specifically, multiple indicators in the male subgroup showed significant independent correlations with thyroid function, whereas no obvious associations were observed in the female subgroup, providing a reference for future targeted research on sex differences.

    This study also has several limitations. First, as a retrospective study using historical medical records, information bias may be present. Second, although 452 participants with complete data were included, the sample size is still relatively small for an in-depth exploration of complex relationships, such as sex differences and the intricate relationships between different sleep stages and thyroid function and OSA indicators, which may limit the representativeness of the study results. Third, the single-center design introduces potential selection bias, affecting the generalizability of the findings. Notably, a large proportion of patients had severe OSA, likely reflecting clinical referral bias—patients with severe symptoms from a tertiary hospital sleep clinic were more likely to undergo PSG. Further multicenter, large-sample studies are needed to validate the conclusions of this study and improve its generalizability and reliability. Fourth, despite adjusting for potential confounders, unmeasured factors such as trace element deficiencies and medication history could still influence thyroid function, interfering with accurate assessment of the relationship between OSA and thyroid function. Fifth, this study is correlational and cannot determine the causal relationship between OSA and thyroid function abnormalities. Further prospective studies or animal experiments are needed for deeper exploration.

    Conclusion

    Overall, this study revealed that the SASHB and SBII are independently correlated with elevated FT3 levels in patients with OSA, with significant associations observed in male but not female subgroups and that this relationship varies across sleep stages. Future research needs to improve in aspects such as larger prospective sample sizes, multicenter collaborations, and optimized study designs to explore further the exact mechanisms of the impact of OSA on thyroid function, providing more valuable theoretical support for clinical diagnosis and treatment.

    Abbreviations

    AHI, apnea–hypopnea index; Anti-TG, thyroid globulin antibodies; Anti-TPO, thyroid peroxidase antibodies; BMI, body mass index; CHD, coronary heart disease; CT90, the percentage of sleep time with oxygen saturation below 90%; ESS, Epworth Sleepiness Scale; FT3, serum free triiodothyronine; FT4, serum free thyroxine; HPT, hypothalamic‒pituitary‒thyroid; Lowest SpO2, lowest transcutaneous oxygen saturation at night; NC, neck circumference; NREM, non-rapid eye movement; NREM-SASHB, sleep apnea-specific hypoxic burden during non-rapid eye movement sleep; NREM-SBII, sleep breathing impairment index during non-rapid eye movement sleep; OSA, obstructive sleep apnea; PSG, polysomnography; REM, rapid eye movement; REM-SASHB, sleep apnea-specific hypoxic burden during rapid eye movement sleep; REM-SBII, sleep breathing impairment index during rapid eye movement sleep; RT3, reverse triiodothyronine; SASHB, sleep apnea-specific hypoxic burden; SBII, sleep breathing impairment index; T90, sleep time spent with oxygen saturation below 90%; TSH, serum thyroid stimulating hormone; TST, total sleep time; TT3, serum total triiodothyronine; TT4, secretes total thyroxine; WC, waist circumference.

    Data Sharing Statement

    The data supporting our findings are available on reasonable request from the corresponding author.

    Ethics Approval

    This retrospective study was approved by the Ethics Committee of the Second Affiliated Hospital of Xi’an Jiaotong University (approval no. 2022-1417). The procedures used in this study adhered to the tenets of the Declaration of Helsinki.

    Acknowledgments

    We wish to thank all who volunteered to participate in this study.

    Author Contributions

    YZ: conceptualization, methodology, software, writing original draft. YS: conceptualization, methodology, writing review and editing. SZ: software, formal analysis, writing original draft. ZC: investigation, resources, data curation, writing original draft. YX: investigation, resources. writing original draft CL: investigation, resources, writing review and editing. XN: investigation, resources, writing review and editing. LM: investigation, resources, writing review and editing. ZW: investigation, resources, writing original draft. YS: formal analysis, validation, writing original draft. ZX: formal analysis, validation, writing original draft. YY: formal analysis, validation, writing original draft. JY: formal analysis, validation, writing original draft. RL: formal analysis, writing original draft. YF: formal analysis, writing original draft. XR: conceptualization, methodology, supervision, funding acquisition, project administration, writing review and editing. WH: conceptualization, methodology, supervision, project administration, resources, writing review and editing. Xiaoyong Ren and Wei Hou are corresponding authors. All authors made a significant contribution to the work reported, whether that is in the conception, study design, execution, acquisition of data, analysis and interpretation, or in all these areas; took part in drafting, revising or critically reviewing the article; gave final approval of the version to be published; have agreed on the journal to which the article has been submitted; and agree to be accountable for all aspects of the work.

    Funding

    This work was supported by the National Natural Science Foundation of China (grant no. 82371129) and the Free Exploration and Innovation Teacher Program of Xi’an Jiaotong University (no. xzy012023119). The funding bodies played no role in the study’s design, the collection, analysis, and interpretation of the data, or the writing of this paper.

    Disclosure

    The authors declare that they have no known competing financial interests or personal relationships that could have appeared to influence the work reported in this paper.

    References

    1. Rundo JV. Obstructive sleep apnea basics. Cleve Clin J Med. 2019;86(9 Suppl 1):2–9. doi:10.3949/ccjm.86.s1.02

    2. Jordan AS, Mcsharry DG, Malhotra A. Adult obstructive sleep apnoea. Lancet. 2014;383(9918):736–747. doi:10.1016/S0140-6736(13)60734-5

    3. Gottlieb DJ, Punjabi NM. Diagnosis and management of obstructive sleep apnea: a review. JAMA. 2020;323(14):1389–1400. doi:10.1001/jama.2020.3514

    4. Benjafield AV, Ayas NT, Eastwood PR, et al. Estimation of the global prevalence and burden of obstructive sleep apnoea: a literature-based analysis. Lancet Respir Med. 2019;7(8):687–698. doi:10.1016/S2213-2600(19)30198-5

    5. Lyons MM, Bhatt NY, Pack AI, et al. Global burden of sleep-disordered breathing and its implications. Respirology. 2020;25(7):690–702. doi:10.1111/resp.13838

    6. Framnes SN, Arble DM. The bidirectional relationship between obstructive sleep apnea and metabolic disease. Front Endocrinol. 2018;9:440. doi:10.3389/fendo.2018.00440

    7. Mete T, Yalcin Y, Berker D, et al. Relationship between obstructive sleep apnea syndrome and thyroid diseases. Endocrine. 2013;44(3):723–728. doi:10.1007/s12020-013-9927-9

    8. Mullur R, Liu YY, Brent GA. Thyroid hormone regulation of metabolism. Physiol Rev. 2014;94(2):355–382. doi:10.1152/physrev.00030.2013

    9. Attal P, Chanson P. Endocrine aspects of obstructive sleep apnea. J Clin Endocrinol Metab. 2010;95(2):483–495. doi:10.1210/jc.2009-1912

    10. Cheng SY, Leonard JL, Davis PJ. Molecular aspects of thyroid hormone actions. Endocr Rev. 2010;31(2):139–170. doi:10.1210/er.2009-0007

    11. Hershman JM, Beck-Peccoz P. Discoveries around the hypothalamic-pituitary-thyroid axis. Thyroid. 2023;33(7):785–790. doi:10.1089/thy.2022.0258

    12. Lavie L. Obstructive sleep apnoea syndrome–an oxidative stress disorder. Sleep Med Rev. 2003;7(1):35–51. doi:10.1053/smrv.2002.0261

    13. Lavie L. Oxidative stress in obstructive sleep apnea and intermittent hypoxia–revisited–the bad ugly and good: implications to the heart and brain. Sleep Med Rev. 2015;20:27–45. doi:10.1016/j.smrv.2014.07.003

    14. Lourbopoulos AI, Mourouzis IS, Trikas AG, et al. Effects of thyroid hormone on tissue hypoxia: relevance to sepsis therapy. J Clin Med. 2021;10(24):5855. doi:10.3390/jcm10245855

    15. Ferreyra C, O’valle F, Osorio JM, et al. Effect of preconditioning with triiodothyronine on renal ischemia/reperfusion injury and poly(ADP-ribose) polymerase expression in rats. Transplant Proc. 2009;41(6):2073–2075. doi:10.1016/j.transproceed.2009.06.060

    16. Xiong J, Hu H, Huang Y, et al. Lack of associations between thyroid dysfunction and obstructive sleep apnea-hypopnea syndrome: a meta-analysis. Medicine. 2023;102(49):e36531. doi:10.1097/MD.0000000000036531

    17. Shi Y, Cao Z, Xie Y, et al. Association between obstructive sleep apnea and thyroid function: a 10-year retrospective study. Sleep Med. 2023;103:106–115. doi:10.1016/j.sleep.2023.01.027

    18. Zhang M, Zhang W, Tan J, et al. Role of hypothyroidism in obstructive sleep apnea: a meta-analysis. Curr Med Res Opin. 2016;32(6):1059–1064. doi:10.1185/03007995.2016.1157461

    19. Azarbarzin A, Sands SA, Stone KL, et al. The hypoxic burden of sleep apnoea predicts cardiovascular disease-related mortality: the osteoporotic fractures in men study and the sleep heart health study. Eur Heart J. 2019;40(14):1149–1157. doi:10.1093/eurheartj/ehy624

    20. Cao W, Luo J, Huang R, et al. The association between sleep breathing impairment index and cardiovascular risk in male patients with obstructive sleep apnea. Nat Sci Sleep. 2022;14:53–60. doi:10.2147/NSS.S343661

    21. Malhotra A, Ayappa I, Ayas N, et al. Metrics of sleep apnea severity: beyond the apnea-hypopnea index. Sleep. 2021;44(7). doi:10.1093/sleep/zsab030

    22. Li C, Peng Y, Zhu X, et al. Independent relationship between sleep apnea-specific hypoxic burden and glucolipid metabolism disorder: a cross-sectional study. Respir Res. 2024;25(1):214. doi:10.1186/s12931-024-02846-7

    23. Dai L, Cao W, Luo J, et al. The effectiveness of sleep breathing impairment index in assessing obstructive sleep apnea severity. J Clin Sleep Med. 2023;19(2):267–274. doi:10.5664/jcsm.10302

    24. Azarbarzin A, Sands SA, Taranto-Montemurro L, et al. The sleep apnea-specific hypoxic burden predicts incident heart failure. Chest. 2020;158(2):739–750. doi:10.1016/j.chest.2020.03.053

    25. Aserinsky E, Kleitman N. Regularly occurring periods of eye motility, and concomitant phenomena, during sleep. Science. 1953;118(3062):273–274. doi:10.1126/science.118.3062.273

    26. España RA, Scammell TE. Sleep neurobiology from a clinical perspective. Sleep. 2011;34(7):845–858. doi:10.5665/SLEEP.1112

    27. De Zambotti M, Baker FC. Sleep and circadian regulation of the autonomic nervous system. Autonomic Nervous System Sleep. 2021;63–69.

    28. Alzoubaidi M, Mokhlesi B. Obstructive sleep apnea during rapid eye movement sleep: clinical relevance and therapeutic implications. Curr Opin Pulm Med. 2016;22(6):545–554. doi:10.1097/MCP.0000000000000319

    29. Johns MW. A new method for measuring daytime sleepiness: the Epworth sleepiness scale. Sleep. 1991;14(6):540–545. doi:10.1093/sleep/14.6.540

    30. Sateia MJ. International classification of sleep disorders-third edition: highlights and modifications. Chest. 2014;146(5):1387–1394. doi:10.1378/chest.14-0970

    31. Kapur VK, Koepsell TD, Demaine J, et al. Association of hypothyroidism and obstructive sleep apnea. Am J Respir Crit Care Med. 1998;158(5 Pt 1):1379–1383. doi:10.1164/ajrccm.158.5.9712069

    32. Lin CC, Tsan KW, Chen PJ. The relationship between sleep apnea syndrome and hypothyroidism. Chest. 1992;102(6):1663–1667. doi:10.1378/chest.102.6.1663

    33. Grunstein RR, Sullivan CE. Sleep apnea and hypothyroidism: mechanisms and management. Am J Med. 1988;85(6):775–779. doi:10.1016/S0002-9343(88)80020-2

    34. Fisher DA. Physiological variations in thyroid hormones: physiological and pathophysiological considerations. Clin Chem. 1996;42(1):135–139. doi:10.1093/clinchem/42.1.135

    35. Karuga FF, Kaczmarski P, Białasiewicz P, et al. REM-OSA as a tool to understand both the architecture of sleep and pathogenesis of sleep apnea-literature review. J Clin Med. 2023;12(18):5907. doi:10.3390/jcm12185907

    36. Joosten SA, Landry SA, Wong AM, et al. Assessing the physiologic endotypes responsible for REM- and NREM-based OSA. Chest. 2021;159(5):1998–2007. doi:10.1016/j.chest.2020.10.080

    37. Xu H, Xia Y, Li X, et al. Association between obstructive sleep apnea and lipid metabolism during REM and NREM sleep. J Clin Sleep Med. 2020;16(4):475–482. doi:10.5664/jcsm.8242

    38. Honda Y, Takahashi K, Takahashi S, et al. Growth hormone secretion during nocturnal sleep in normal subjects. J Clin Endocrinol Metab. 1969;29(1):20–29. doi:10.1210/jcem-29-1-20

    39. Marqusee E, Braverman LE, Lawrence JE, et al. The effect of droloxifene and estrogen on thyroid function in postmenopausal women. J Clin Endocrinol Metab. 2000;85(11):4407–4410. doi:10.1210/jcem.85.11.6975

    Continue Reading

  • Nigeria’s Medical Oxygen Crisis: A Life-or-Death Issue for Women and Children | by Nigeria Health Watch | Jul, 2025

    Nigeria’s Medical Oxygen Crisis: A Life-or-Death Issue for Women and Children | by Nigeria Health Watch | Jul, 2025

    Image credit: Nigeria Health Watch

    Chibuike Alagboso (Lead writer)

    Over 5 billion people globally lack access to safe, quality, and affordable medical oxygen services, according to the Lancet Global Health Commission on Medical Oxygen Security published in February 2025. This represents a significant access gap when compared to other essential medicines, the commission found.

    Oxygen is not only vital for treating respiratory illnesses but also essential for successful surgical and trauma management. Vulnerable groups including older adults, pregnant women, infants, and newborns are especially at risk when oxygen is unavailable.

    In low and middle-income countries, the situation is more worrisome; only about 30% out of the 299 million people who need oxygen for acute medical or surgical conditions receive adequate oxygen therapy.

    The gap is most severe in sub-Saharan Africa, where access is critically low. To sustainably improve access, African countries must create the right environment to attract investments and collaborations for improved access to quality medical oxygen.

    Image credit: Nigeria Health Watch

    Medical oxygen: A lifeline for women and children

    Medical oxygen is a recognised essential medicine, crucial for a wide range of conditions. For mothers and newborns, it is lifesaving. Strengthening oxygen systems could reduce in-hospital mortality rates from childhood pneumonia by up to 50% and significantly improve maternal and neonatal health outcomes.

    Oxygen is a life-sustaining element that is indispensable for surgical procedures, emergency care, and the survival of newborns, children, and mothers. Hypoxemia, or low oxygen levels in the blood, can be a grave threat to life, particularly for young patients. Also, prompt access to oxygen is crucial in mitigating maternal fatalities caused by postpartum hemorrhage (PPH) or hypertension.

    The early years of a child’s life are especially vulnerable. Birth complications such as asphyxia- a condition where the body is deprived of enough oxygen, leading to breathing impairment and potentially unconsciousness or death- and trauma are among the leading causes of neonatal deaths according to the World Health Organization (WHO). Reliable and quality medical oxygen make a lot of difference in improving their outcomes.

    Recent trends report by WHO show that while progress has been made, reduction in maternal mortality rate remains insufficient to meet the global target by 2030. The report highlights the urgent need for consistent availability of essential medicines, diagnostics, and devices in poor countries, where 90% of maternal deaths occurred in 2023. It further notes that all maternal deaths are preventable, and strengthening health systems to address shortages of essential supplies is crucial

    Why the gap?

    Despite being an essential medicine with no substitute, access to medical oxygen remains inequitable. The story of Dr. Rosemary Chukwudebe’s death in 2018 due to lack of oxygen access in the facility she works is a sad reminder of this reality. Nigeria has taken steps to improve oxygen production and distribution since COVID-19 exposed Africa’s vulnerability, but sustained, long-term investment remains essential.

    Image credit: Nigeria Health Watch

    Dr Bamidele, a resident doctor in a Nigerian public hospital, said that oxygen is sometimes unavailable and often unaffordable, costing between NGN 1,000 and NGN 2,000 per hour.

    The Lancet Commission also identified major contributors to the oxygen coverage gap as health facilities lacking basic oxygen service capacity; failure to identify oxygen need due to the unavailability of pulse oximetry; interrupted, unsafe, or otherwise low-quality oxygen care; and high costs for patients. Pulse oximeters, which help measure blood oxygen levels, are available in only 54% general hospital and 83% of tertiary hospitals across low-income countries. Primary healthcare centres (PHCs) rarely have them at all.

    Mu’azu Muhammad is the Nigeria Country Champion of Oxygen CoLab. He pointed out that while significant investments were made during COVID-19, many facilities are now inactive.

    Efforts are underway to transfer these investments to the private sector, but without dedicated budget lines for medical oxygen security, subnational prioritisation remains low. Over-reliance on international partners and lack of regulatory oversight on technical specifications for oxygen production further undermine sustainability, he noted.

    For better quality control, the oxygen desk office at the Federal Ministry of Health and Social Welfare, the National Agency for Food and Drug Administration and Control (NAFDAC) and the Standard Organisation of Nigeria (SON) must align through the United for Oxygen Coalition, Muhammad said.

    Closing the gap

    The Lancet Commission calls on governments to develop National Oxygen Plan as was done by Nigeria and invest in local oxygen manufacturing and maintenance. Nigeria’s Presidential Initiative for Unlocking the Healthcare Value Chain (PVAC) is an example of national-level initiative that could provide the policy and investment environment needed to strengthen oxygen ecosystems.

    Collaboration with the private sector is essential to maximise the value of oxygen plant installations. Oxygen CoLab’s “oxygen-as-a-service” model focuses on delivering oxygen concentrators for underserved health facilities. Can this be further scaled up? Numerous partners- including the Canadian government, Global Fund, and UNICEF, have supported Nigeria to set up oxygen plants. However, ongoing maintenance and sustainable financing are critical to prevent these facilities from falling into neglect.

    During a 2024 policy dialogue, Dr Gilbert Shetak, Director of the National Oxygen Desk at the Federal Ministry of Health and Social Welfare, emphasised the need for sustainable financing. The National Council on Health has already laid a path for this by approving the single account for medical oxygen in health facilities.

    Clearly, there are so many issues impacting health outcomes for women and children. However, addressing access to quality medical oxygen will help move the needle. It is not cheap, but it is good investment. The Lancet Commission underscores that investing in medical oxygen is cost-effective, comparable to routine childhood immunisation.

    Closing the medical oxygen gap will also require robust data gathering and tracking, from production to usage. Tools like the Ten Oxygen Coverage Indicators and Access to Medical Oxygen Scorecard (ATMO₂S) can help governments monitor progress of how they are implementing WHO’s Increasing Access to Medical Oxygen Resolution.

    Continue Reading

  • Prevalence of refractive errors among school-age children and adolesce

    Prevalence of refractive errors among school-age children and adolesce

    Introduction

    Refractive errors, primarily including myopia (nearsightedness), hyperopia (farsightedness), and astigmatism, are among the most prevalent ocular disorders affecting populations globally.1 These visual impairments result from irregularities in the eye’s ability to focus light on the retina, leading to blurred vision and, if uncorrected, can cause functional limitations and educational disadvantages in children.2 Among these, myopia has emerged as a major global public health concern due to its rapidly increasing prevalence and potential for sight-threatening complications such as myopic maculopathy, retinal detachment, and glaucoma.2 The global prevalence of myopia is projected to rise dramatically, from approximately 22.9% in 2020 to nearly 50% by 2050, highlighting the urgent need for early detection and effective management strategies.1,3

    This trend is not merely a biological inevitability; rather, it reflects a complex interplay of genetic predispositions and environmental exposures, particularly lifestyle factors.1,3,4 Modern risk factors, such as increased screen time, excessive near-work activities (eg, prolonged use of digital devices), reduced time spent outdoors, and early educational pressures, have been strongly associated with the onset and progression of myopia in children.5,6 These risk factors are particularly concerning in high-income countries undergoing rapid urbanization, where behavioral and environmental patterns have shifted significantly in recent decades.7

    Epidemiological studies reveal that the prevalence and distribution of refractive errors vary considerably by geographic region, ethnicity, and socioeconomic conditions. For instance, cross-sectional studies from Australia have demonstrated that myopia affects 42.7% of 12-year-old Asian children compared to 8.3% in their European Caucasian peers. By age 17, these figures rise to 59.1% and 17.7%, respectively, reflecting both ethnic and environmental influences.5,6 Similar findings are reported in the U.S.-based Multi-Ethnic Pediatric Eye Disease Study, which documented a myopia prevalence of 3.98% in Asian children compared to 1.2% in Non-Hispanic White children. Hyperopia was more prevalent in NHW children (25.65%) than in Asian children (13.47%), while astigmatism showed less variation (6.33% vs 8.29%).8

    However, these international comparisons, while informative, may not directly translate to the Saudi Arabian context due to differences in population structure, educational systems, urbanization rates, and cultural practices.9,10 While global studies are valuable in identifying overarching trends, localized data are crucial for tailoring public health strategies that address specific risk profiles and healthcare infrastructure.

    In Saudi Arabia, the current literature on refractive errors in children and adolescents remains fragmented and inconsistent. Previous studies vary widely in methodology, sampling strategies, diagnostic criteria, and regional coverage, making it difficult to draw reliable national-level conclusions.11 Moreover, few reviews have attempted to consolidate existing findings or assess the heterogeneity in reported prevalence rates across Saudi regions.11 The lack of a comprehensive synthesis of data not only limits our understanding of the burden of refractive errors in the Kingdom but also hampers efforts to implement standardized screening and early intervention programs.

    Given these gaps, a systematic review and meta-analysis focused specifically on Saudi school-aged children and adolescents is warranted. This review aims to provide a pooled estimate of the prevalence of myopia, hyperopia, and astigmatism in this demographic and to explore regional differences, temporal trends, and methodological inconsistencies in the available literature.

    Methods

    Study Design

    This research employed a systematic review and meta-analysis to synthesize available evidence on the prevalence of refractive errors among children and adolescents aged 3 to 18 years in Saudi Arabia. The study was structured using the PICO framework as follows:

    1. Population (P): School-aged children and adolescents residing in Saudi Arabia.
    2. Intervention/Exposure (I): Diagnosis of refractive errors (myopia, hyperopia, or astigmatism).
    3. Comparison (C): Not applicable, as the objective was to assess prevalence without comparative analysis.
    4. Outcome (O): Reported prevalence rates of the specified refractive errors.

    The methodology followed the standards set by the Cochrane Handbook for Systematic Reviews of Interventions and conformed to the PRISMA 2020 reporting guidelines, ensuring a transparent and rigorous review process.12,13 This review was prospectively registered in PROSPERO (registration number: CRD420251006138).

    Search Strategy

    A comprehensive search was performed in PubMed, Scopus, Web of Science, and ScienceDirect for articles published from January 2000 to January 2025. The search was performed using Medical Subject Headings (MeSH) terms and relevant keywords, including “myopia”, “hyperopia”, “astigmatism”, “refractive errors”, “prevalence”, “children”, “adolescents”, “students”, “school”, and “Saudi Arabia”, combined using Boolean operators (AND/OR) to optimize the retrieval of relevant studies. Although our search was limited to studies published in English, this approach is justified by the context of healthcare research in Saudi Arabia. English is the official language of medical education and scientific publication in the country, and nearly all peer-reviewed medical and epidemiological research, including that indexed in major databases, is published in English. As such, excluding non-English sources is unlikely to have significantly impacted the comprehensiveness of our review.

    Eligibility Criteria

    We included observational studies (cross-sectional, prospective, or retrospective) reporting the prevalence of refractive errors in children and adolescents aged 3–18 years in Saudi Arabia. Studies were included if prevalence data were explicitly stated or could be inferred from raw data (eg, numerator and denominator provided). Studies reporting a broader age range were included only if data for the 3–18 age group were separately reported or could be extracted.

    Inclusion and Exclusion Criteria

    Studies were included if they met the following criteria: (1) involved school-aged children and adolescents within the specified age range; (2) employed any diagnostic method for refractive error, including cycloplegic and non-cycloplegic refraction; and (3) reported prevalence data on myopia, hyperopia, or astigmatism. All levels of refractive error severity were eligible for inclusion, and no restrictions were placed based on participant gender, school setting (public or private), or geographical region within Saudi Arabia.

    Exclusion criteria encompassed non-primary research articles such as reviews, editorials, commentaries, case series, and conference abstracts. Studies were also excluded if they did not report refractive error prevalence or if such data could not be derived from the presented results. Articles that were not accessible in full text or published in languages other than English were omitted.

    Study Selection and Screening

    The selection of studies followed a structured and methodical approach. All identified records were imported into Rayyan, a web-based platform designed to facilitate the screening process in systematic reviews.14 Duplicate entries were automatically identified and removed. Title and abstract screening was independently conducted by eight reviewers based on the predefined eligibility criteria. To assess the consistency of reviewer judgments during this phase, inter-rater reliability was evaluated using Cohen’s kappa statistic, which yielded a value of 0.78, indicating substantial agreement.15 Disagreements were resolved through discussion. Articles deemed eligible or requiring further evaluation underwent full-text screening, which was performed by four reviewers. References were then managed using EndNote for full-text handling and citation organization. Final inclusion decisions were made by consensus to ensure that all selected studies adhered to the established criteria.

    Quality Assessment

    To evaluate the methodological quality of the included studies, the Newcastle-Ottawa Scale (NOS) was applied. This tool assesses non-randomized studies across three key domains: selection of study participants, comparability of groups, and outcome assessment.16 Each study received a score between 0 and 9. Based on these scores, studies were classified as high quality (scores of 7 to 9), moderate quality (scores of 4 to 6), or low quality (scores of 0 to 3). The NOS has been widely adopted in large-scale systematic reviews on epidemiological studies, supporting its validity and reliability in assessing methodological rigor.17 Four reviewers independently assessed the studies. In cases where their evaluations differed, the reviewers first discussed the discrepancies in an attempt to reach agreement. If a consensus could not be achieved, two additional reviewers were consulted to provide a final judgment. This process ensured consistency and rigor in the quality assessment.

    Data Extraction and Management

    To maintain consistency throughout the data collection process, a standardized extraction form was developed and implemented. Four reviewers independently extracted relevant information from each included study. This included general study details such as author names, year of publication, study design, geographical location, and sample size. Information related to participant demographics, including age range and gender distribution, was also recorded. Additionally, the extracted data included prevalence estimates for myopia, hyperopia, and astigmatism, details on myopia severity (mild, moderate, high), hyperopia classification, and astigmatism thresholds, and information on diagnostic methodologies (cycloplegic vs non-cycloplegic refraction, auto-refractometer, subjective refraction tests). All extracted data were compiled and organized using Microsoft Excel to prepare for statistical analysis. The extraction form was pilot tested to ensure it captured all necessary variables comprehensively and consistently. Any discrepancies between reviewers were addressed through discussion. If consensus could not be reached, two additional authors were consulted to ensure the reliability and accuracy of the final dataset.

    Statistical Analysis

    All statistical analyses were conducted using R software (version 4.2.2), utilizing the metafor and meta packages. To synthesize prevalence estimates for myopia, hyperopia, and astigmatism, random-effects models were employed, accounting for between-study variability due to expected clinical and methodological heterogeneity. Proportion estimates were presented with 95% confidence intervals (CIs), and the Freeman–Tukey double arcsine transformation was applied to stabilize variance, particularly in studies reporting very high or low prevalence values. Heterogeneity was assessed using both Cochran’s Q test and the I² statistic. A Q test p-value of <0.10 or an I² value exceeding 50% was considered indicative of substantial heterogeneity.

    Where applicable, subgroup analyses were conducted to explore sources of heterogeneity, including geographic region, refractive error classification methods (cycloplegic vs non-cycloplegic), and age group stratifications. Meta-regression analyses were pre-specified to evaluate the influence of continuous variables such as publication year and sample size on prevalence estimates.18 In cases where overlapping datasets from similar populations were identified, the study with the larger sample size or more comprehensive data was prioritized to avoid duplication. To assess the robustness of the pooled estimates, leave-one-out sensitivity analyses were performed. Publication bias was evaluated using contour-enhanced funnel plots and Egger’s regression test. In addition, Doi plots were generated and examined using the Luis Furuya-Kanamori (LFK) index, where LFK values between –1 and +1 were interpreted as indicating symmetry, values between ±1 and ±2 as minor asymmetry, and values exceeding ±2 as evidence of major asymmetry.19,20

    Results

    Search Results

    A comprehensive search of four electronic databases (PubMed, Scopus, Web of Science, and ScienceDirect) yielded 260 records published between January 2000 and January 2025 (Figure 1). After eliminating 32 duplicate entries, 228 unique records remained for screening. Titles and abstracts were reviewed, leading to the exclusion of 212 records based on criteria such as irrelevance to the research question or setting (n = 196), review articles (n = 9), and protocols or editorials (n = 7). The full texts of the remaining 16 articles were then assessed in detail. Following this evaluation, 7 articles were excluded due to the absence of specific prevalence data on refractive errors. As a result, 9 studies were deemed eligible and included in the final systematic review and meta-analysis.21–29

    Figure 1 PRISMA flow diagram for study selection.

    Description of Included Studies

    The nine studies included in this review were published between 2010 and 2023 and investigated the prevalence of myopia among school-aged children across different regions in Saudi Arabia (Table 1). All studies utilized a cross-sectional design. Sample sizes varied, ranging from 360 participants in the study by Alkhathami et al (2023) to 5,176 participants in the study by Aldebasi (2014). Altogether, these studies encompassed more than 15,000 children, making this one of the most extensive systematic reviews to date on the prevalence of refractive errors among Saudi schoolchildren.

    Table 1 Summary of Included Studies

    The age range of participants spanned from 3 to 18 years, encompassing children in kindergarten, primary, and secondary school. All studies used visual screening techniques, but only 2 studies employed cycloplegic refraction, the gold standard for pediatric refractive error assessment, while 7 studies used non-cycloplegic techniques, such as autorefraction, visual acuity tests, or retinoscopy.

    Prevalence of Myopia

    The analysis estimated the overall prevalence of myopia among school-aged children in Saudi Arabia at 6.7% (95% CI: 3.0% to 14.2%). This estimate was accompanied by a substantial heterogeneity among the included studies, as indicated by an I² value of 99.5% and a τ² value of 1.59 (Figure 2). The reported prevalence varied considerably, ranging from 0.7% (Alrahili et al, 2017) to 33.3% (AlThomali et al, 2022). The lowest prevalence was reported by Alrahili et al (2017) in a sample of 1,893 children, while the highest prevalence was documented by AlThomali et al (2022) in a large cohort of 3,678 participants. Notably, Alkhathami et al (2023) also reported a high prevalence of 20% among 360 children.

    Figure 2 Forest plot of myopia prevalence among school-age children and adolescents in Saudi Arabia.

    The severity of myopia varied between studies (Table 1). Mild myopia was the most frequently observed category, with Aldebasi (2014) reporting that 87% of myopic children had mild myopia, while AlThomali et al (2022) reported a slightly lower percentage of 28.6%. Moderate myopia accounted for 3.7% to 10.9% of cases, while high myopia was less common, ranging from 0.3% to 2.1% in the included studies.

    Prevalence of Hyperopia

    The pooled prevalence of hyperopia across the included studies was 3.6% (95% CI: 1.3–9.8%), with marked heterogeneity (I²=99.2%, τ²=2.3062) (Figure 3). The reported prevalence varied substantially, ranging from 0.7% (Aldebasi, 2014) to 21.1% (Alkhathami et al, 2023).

    Figure 3 Forest plot of hyperopia prevalence among school-age children and adolescents in Saudi Arabia.

    The prevalence and severity of hyperopia varied across studies (Table 1). Mild hyperopia was the most frequently observed category, with Aldebasi (2014) reporting that 36.4% of hyperopic children had mild hyperopia, while AlThomali et al (2022) noted that low and moderate hyperopia accounted for 16.3% of cases. High hyperopia was less common, ranging from 1.3% to 11.4% in the studies included. The overall prevalence of hyperopia ranged from 0.7% to 17.63%, with some studies reporting higher rates in females compared to males.

    Prevalence of Astigmatism

    The pooled prevalence of astigmatism was 7.7% (95% CI: 2.5–20.9%), with extremely marked heterogeneity (I²=99.8%, τ²=2.4258) (Figure 4). The reported prevalence varied widely, with AlThomali et al (2022) documenting the highest prevalence at 50.1%, while Al-Rowaily (2010) and Al Wadaani et al (2012) reported the lowest prevalences (2.5% and 1.7%, respectively).

    Figure 4 Forest plot of astigmatism prevalence among school-age children and adolescents in Saudi Arabia.

    AlThomali et al (2022) reported the highest prevalence, with low and moderate astigmatism accounting for 47% of cases, while severe astigmatism was less common at 3.1% (Table 1). Myopic astigmatism was frequently observed, with rates ranging from 2.7% to 16.6%, while hyperopic astigmatism and mixed astigmatism were less prevalent, ranging from 1.7% to 10.3%. Some studies, such as Alrahili et al (2017), noted similar astigmatism rates between boys and girls, while others, like AlThomali et al (2022), reported slightly higher rates in females (52.6%) compared to males (47.7%).

    Sensitivity and Subgroup Analyses

    A meta-influence analysis was conducted to examine whether any single study significantly affected the pooled prevalence of myopia, It is provided in Table S1. The results show that removing individual studies did not lead to major changes in the overall prevalence estimates, indicating that no single study disproportionately influenced the meta-analysis findings.

    Subgroup analysis results are presented in Table 2, highlighting variations in the estimated prevalence of myopia based on specific study characteristics. While studies utilizing cycloplegic refraction reported a marginally higher pooled prevalence (7.21%, 95% CI: 4.7–11) than those using non-cycloplegic techniques (6.72%, 95% CI: 2.4–17.5), this difference was not statistically significant (p = 0.9). Notable differences were observed across geographic regions. Taif and Bisha reported the highest prevalence estimates at 33.28% and 22.50%, respectively, while Medina had the lowest prevalence at 1.59%. The test for subgroup differences across regions was statistically significant (p < 0.001), indicating meaningful regional variation. Studies published after 2018 showed a significantly higher pooled prevalence (16.36%, 95% CI: 8.0–30.5) compared to those before 2018 (3.27%, 95% CI: 1.4–7.5) (p < 0.001). No significant difference was found when comparing studies with sample sizes below 1500 to those with larger samples (p = 0.9), though both groups showed substantial heterogeneity.

    Table 2 Subgroup Analysis of Pooled Prevalence of Myopia Among School-Aged Children and Adolescents in Saudi Arabia

    Meta-Regression

    Meta-regression analysis revealed that the year of publication significantly contributed to the observed heterogeneity in myopia prevalence (p = 0.038), suggesting that studies published more recently tended to report higher prevalence rates. In contrast, sample size did not appear to account for a meaningful portion of the heterogeneity (p = 0.624), indicating that variations in the number of participants across studies did not significantly influence the differences in reported prevalence estimates (see Table 3).

    Table 3 Meta-Regression Analysis Results for Pooled Prevalence of Myopia Among School-Age Children and Adolescents in Saudi Arabia

    Publication Bias

    To assess potential publication bias, both Doi plots and funnel plots were examined for asymmetry in the prevalence estimates of myopia, hyperopia and astigmatism (Figures S1S6, respectively). For myopia, the funnel plot appeared symmetrical, and the Doi plot showed an LFK index of 0.09, indicating no evidence of publication bias. The distribution of studies was balanced around the pooled prevalence estimate, suggesting that smaller studies did not systematically report higher or lower prevalence rates. The plot shape and central clustering reinforce the robustness of the pooled estimate.

    In contrast, the funnel plot for hyperopia showed noticeable asymmetry, with a skewed distribution of studies. This visual asymmetry was confirmed by the Doi plot, which had an LFK index of 3.31 indicating major asymmetry and potential publication bias. For astigmatism, the Doi plot showed no asymmetry (LFK = 0.47), and similar funnel plot assessments suggested a balanced distribution of prevalence estimates, reinforcing confidence in the pooled findings.

    Quality Assessment of Included Studies

    The quality of the studies included in this review was evaluated using the Newcastle-Ottawa Scale (NOS), as summarized in Table 4. Seven studies achieved scores between 7 and 9, indicating high methodological quality. These studies demonstrated rigorous participant selection processes, appropriate comparison groups, and reliable methods for measuring outcomes. Notable examples include those conducted by Al-Rowaily (2010), Al Wadaani (2012), Aldebasi (2014), Alrahili (2017), Alemam (2018), and AlThomali (2022), all of which employed sound research designs that support the credibility of their findings. The remaining three studies were rated as having moderate quality, each receiving a score of 6. These ratings were primarily due to issues such as relatively small sample sizes, use of non-cycloplegic refraction methods, or potential selection bias, which may affect the generalizability or precision of their results.

    Table 4 Quality Assessment of Included Studies Using the Newcastle-Ottawa Scale (NOS)

    Discussion

    This systematic review and meta-analysis offers a detailed overview of the prevalence of refractive errors among school-aged children and adolescents in Saudi Arabia, drawing on data from nine studies that collectively involved more than 15,000 participants. The findings identify astigmatism as the most prevalent refractive error, with a pooled estimate of 7.7%, followed by myopia at 6.7% and hyperopia at 3.6%. These results highlight the substantial burden of uncorrected refractive errors in this population and point to an important area for public health intervention. Although all included studies reported data on myopia, the prevalence varied widely across regions, ranging from 0.7% to 33.3%. The consistently higher prevalence of astigmatism, however, may indicate that this condition has not received adequate attention in either clinical practice or research agendas.

    The pooled prevalence of myopia in Saudi Arabia (6.7%) is higher than that reported in Ethiopia (5.26%)30 and other African countries (4.7%)31 but lower than rates observed in East Asia (31%).32 This disparity may be attributed to differences in genetic predisposition, lifestyle factors, and levels of urbanization.33 For instance, increased near-work activities, reduced outdoor time, and technological advancements have been linked to higher myopia prevalence globally.34–37 In Saudi Arabia, the rising prevalence may also reflect improved diagnostic capabilities and increased awareness of refractive errors.38

    The diagnostic methodology significantly influenced the prevalence estimates of myopia across the included studies. Studies employing cycloplegic refraction, such as Al Wadaani et al (2012)22 and Aldebasi (2014),23 reported higher myopia prevalence rates of 9% and 5.8%, respectively. In contrast, studies using non-cycloplegic methods, such as Al-Rowaily (2010)21 and Alrahili et al (2017),24 reported lower prevalence rates ranging from 0.7% to 7.7%. This discrepancy suggests that cycloplegic refraction, which paralyzes the ciliary muscle and eliminates accommodation, may provide a more accurate detection of myopia, particularly in younger children.39 Non-cycloplegic methods, on the other hand, may underestimate myopia due to the influence of accommodation.40 These findings underscore the importance of standardized diagnostic approaches, with cycloplegic refraction remaining the gold standard for reliable pediatric refractive error assessment.

    The pooled prevalence of astigmatism in this review was 7.7%, though individual study estimates ranged widely from 1.7% to 50.1%. Myopic astigmatism emerged as the most frequently reported subtype, aligning with global trends documented in previous research.41–43 Several factors may contribute to the relatively high prevalence of astigmatism observed in Saudi Arabia, including hereditary influences, environmental exposures, and lifestyle changes such as increased screen time among children.44 One study conducted in Jeddah among participants attending an amblyopia awareness campaign reported a notably high prevalence of astigmatism at 41.5%. Within this group, 40.6% of children without a prior diagnosis were found to have astigmatism incidentally.45 However, because the study recruited attendees from a vision health event, the findings may reflect a degree of selection bias, potentially inflating the prevalence estimate. This underscores the importance of conducting well-designed, population-based studies to generate more representative data and to clarify the factors contributing to the burden of astigmatism across different regions and age groups in Saudi Arabia.

    Although hyperopia had the lowest pooled prevalence (3.6%), its detection is especially important in early childhood, when uncorrected farsightedness can lead to amblyopia and delayed visual development.46,47 Mild hyperopia was the most common form, but even low levels can significantly affect reading fluency and school performance. Current findings reinforce the importance of incorporating hyperopia detection into routine early childhood vision screening to support cognitive and educational development.

    Gender-specific analysis revealed a slightly higher prevalence of both myopia and astigmatism among females. This aligns with global literature, where differences may stem from hormonal, anatomical, or behavioral factors, including higher rates of near-work activity among girls.48 Policymakers and educators could consider targeted interventions for girls, such as vision-friendly classroom environments and awareness campaigns that emphasize early screening and eye health education.

    The findings of this study align with regional and global trends in the prevalence of refractive errors. For instance, a meta-analysis conducted in the Middle East reported a myopia prevalence of 5.2%, which is slightly lower than our estimate of 10%.49 Similarly, our results are consistent with studies from India (5.3%) and Nepal (7.1%),50,51 indicating shared risk factors such as urbanization, increased educational demands, and lifestyle changes. These parallels suggest that environmental and socio-cultural factors, including prolonged near-work activities and limited outdoor exposure, may contribute to the rising burden of refractive errors across diverse populations.37,52 The consistency in findings underscores the importance of addressing these modifiable risk factors through targeted public health interventions to mitigate the growing prevalence of refractive errors among children globally.53

    Given the rising prevalence and consequences of uncorrected refractive errors, particularly myopia and astigmatism, school-based screening programs should be expanded and standardized. Programs should prioritize the use of cycloplegic refraction, especially for younger children, and integrate follow-up pathways to ensure timely correction. Public health campaigns should also raise awareness among parents and educators about the importance of limiting near-work activities and encouraging outdoor play.

    This review has several notable limitations. First, none of the studies included reported the prevalence of high myopia, a severe and vision-threatening condition. The absence of this data limits the understanding of the full spectrum of refractive errors and the potential long-term burden of uncorrected high myopia in the pediatric population. Second, many studies did not clearly report the refraction techniques used, particularly whether cycloplegic or non-cycloplegic methods were applied. This may have contributed to variability and potential bias in prevalence estimates. Future research should consistently specify the refraction methodology to improve comparability and diagnostic accuracy. Third, the analysis focused solely on prevalence and did not include multivariate analysis to explore risk factors such as age, gender, urban or rural residence, screen time, or genetic predisposition. This limits the ability to identify significant predictors of refractive errors. Finally, the substantial heterogeneity across studies reflects differences in sampling methods, diagnostic protocols, and population characteristics. This underscores the need for consistent and standardized protocols in future epidemiological vision research.

    Conclusion

    This study demonstrates that refractive errors are a significant public health issue among school-aged children and adolescents in Saudi Arabia. Astigmatism emerged as the most common refractive error, followed by myopia and hyperopia. Notable regional variations were observed, with especially high rates of myopia in cities such as Taif and Bisha. Additionally, studies conducted after 2018 reported markedly higher myopia prevalence compared to earlier research, reflecting an upward trend over time. These findings highlight the urgent need for standardized diagnostic methods, particularly the consistent use of cycloplegic refraction, to improve accuracy in screening and diagnosis. To address the growing burden of refractive errors, national school-based vision screening programs should be implemented. These programs should include regular eye examinations by trained personnel, integration with school health services, and referral pathways for children needing corrective treatment. Policymakers should also promote preventive strategies such as increasing outdoor activities and managing screen time as part of broader child health initiatives. Implementing these measures is essential to reducing visual impairment and supporting the academic and developmental success of Saudi children.

    Data Sharing Statement

    The datasets analyzed during this study are not publicly available; however, they can be obtained from the corresponding author upon reasonable request.

    Author Contributions

    All authors made a significant contribution to the work reported, whether in the conception, study design, execution, acquisition of data, analysis and interpretation, or in all these areas. All authors took part in drafting, revising, or critically reviewing the article; gave final approval of the version to be published; have agreed on the journal to which the article has been submitted; and agree to be accountable for all aspects of the work.

    Funding

    There is no funding to report.

    Disclosure

    The authors declare that they have no competing interests in this work.

    References

    1. Foster PJ, Jiang Y. Epidemiology of myopia. Eye. 2014;28(2):202–208. doi:10.1038/eye.2013.280

    2. Schaeffel F. Myopia – What is old and what is new? Optometry Vision Sci. 2016;93(9):1022–1030. doi:10.1097/OPX.0000000000000914

    3. Grzybowski A, Kanclerz P, Tsubota K, Lanca C, Saw SM. A review on the epidemiology of myopia in school children worldwide. BMC Ophthalmol. 2020;20(1):1–11. doi:10.1186/S12886-019-1220-0/TABLES/2

    4. Hashemi H, Fotouhi A, Yekta A, Pakzad R, Ostadimoghaddam H, Khabazkhoob M. Global and regional estimates of prevalence of refractive errors: systematic review and meta-analysis. J Curr Ophthalmol. 2017;30(1):3–22. doi:10.1016/J.JOCO.2017.08.009

    5. Ohno-Matsui K. What is the fundamental nature of pathologic myopia? Retina. 2017;37(6):1043–1048. doi:10.1097/IAE.0000000000001348

    6. Medina A. The cause of myopia development and progression: theory, evidence, and treatment. Surv Ophthalmol. 2022;67(2):488–509. doi:10.1016/J.SURVOPHTHAL.2021.06.005

    7. Ip JM, Saw SM, Rose KA, et al. Role of near work in myopia: findings in a sample of Australian school children. Invest Ophthalmol Vis Sci. 2008;49(7):2903–2910. doi:10.1167/IOVS.07-0804

    8. Wen G, Tarczy-Hornoch K, McKean-Cowdin R, et al. Prevalence of myopia, hyperopia and astigmatism in non-Hispanic white and Asian children: multi-ethnic pediatric eye disease study. Ophthalmology. 2013;120(10):2109. doi:10.1016/J.OPHTHA.2013.06.039

    9. Alobaisi S, Alromaih AI, Aljulayfi AS, Alanazi SM, Knowledge AS. Attitude, and Practice among parents of strabismic children in Saudi Arabia: a cross-sectional study. Cureus. 2022;14(12). doi:10.7759/CUREUS.33120

    10. Alanazi SRG, Alanazi HWH, Alanazi WG, et al. Parents’ knowledge and attitudes toward pediatric ophthalmic disorders in Saudi Arabia: a cross-sectional study. Pediatric Reports. 2024;16(4):902–920. doi:10.3390/PEDIATRIC16040077

    11. Alghamdi W. Prevalence of refractive errors among children in Saudi Arabia: a systemic review. Open Ophthalmol J. 2021;15(1):89–95. doi:10.2174/1874364102115010089

    12. Cumpston M, Li T, Page MJ, et al. Updated guidance for trusted systematic reviews: a new edition of the Cochrane Handbook for Systematic Reviews of Interventions. Cochrane Database Syst Rev. 2019;10(10):ED000142. doi:10.1002/14651858.ED000142

    13. Page MJ, McKenzie JE, Bossuyt PM, et al. The PRISMA 2020 statement: an updated guideline for reporting systematic reviews. BMJ. 2021:372. doi:10.1136/BMJ.N71.

    14. Ouzzani M, Hammady H, Fedorowicz Z, Elmagarmid A. Rayyan-a web and mobile app for systematic reviews. Syst Rev. 2016;5(1):1–10. doi:10.1186/S13643-016-0384-4/FIGURES/6

    15. Landis JR, Koch GG. An application of hierarchical kappa-type statistics in the assessment of majority agreement among multiple observers. Biometrics. 1977;33(2):363. doi:10.2307/2529786

    16. Stang A. Critical evaluation of the Newcastle-Ottawa scale for the assessment of the quality of nonrandomized studies in meta-analyses. Eur J Epidemiol. 2010;25(9):603–605. doi:10.1007/S10654-010-9491-Z

    17. Baklola M, Terra M, Elsehrawy MG, et al. Epidemiology of surgical site infections post-cesarean section in Africa: a comprehensive systematic review and meta-analysis. BMC Pregnancy Childbirth. 2025;25(1):1–18. doi:10.1186/S12884-025-07526-Y/FIGURES/5

    18. Geissbühler M, Hincapié CA, Aghlmandi S, Zwahlen M, Jüni P, da Costa BR. Most published meta-regression analyses based on aggregate data suffer from methodological pitfalls: a meta-epidemiological study. BMC Med Res Methodol. 2021;21(1):123. doi:10.1186/S12874-021-01310-0

    19. Cheema HA, Shahid A, Ehsan M, Ayyan M. The misuse of funnel plots in meta-analyses of proportions: are they really useful? Clin Kidney J. 2022;15(6):1209–1210. doi:10.1093/CKJ/SFAC035

    20. Furuya-Kanamori L, Barendregt JJ, Doi SAR. A new improved graphical and quantitative method for detecting bias in meta-analysis. Int J Evid Based Healthc. 2018;16(4):195–203. doi:10.1097/XEB.0000000000000141

    21. Al-Rowaily MA. Prevalence of refractive errors among pre-school children at King Abdulaziz Medical City, Riyadh, Saudi Arabia. Saudi J Ophthalmol. 2010;24(2):45–48. doi:10.1016/J.SJOPT.2010.01.001

    22. Al Wadaani FA, Amin TT, Ali A, Khan AR. Prevalence and pattern of refractive errors among primary school children in Al Hassa, Saudi Arabia. Glob J Health Sci. 2012;5(1):125–134. doi:10.5539/GJHS.V5N1P125

    23. Aldebasi YH. Prevalence of correctable visual impairment in primary school children in Qassim Province, Saudi Arabia. J Optom. 2014;7(3):168–176. doi:10.1016/J.OPTOM.2014.02.001

    24. Alrahili NHR, Jadidy ES, Alahmadi BSH, et al. Prevalence of uncorrected refractive errors among children aged 3-10 years in western Saudi Arabia. Saudi Med J. 2017;38(8):804–810. doi:10.15537/SMJ.2017.8.20412

    25. Mohammed Alemam A, Aldebasi MH, Rehmatullah A, Alsaidi R, Tashkandi I. Prevalence of myopia among children attending pediatrics ophthalmology clinic at Ohud Hospital, Medina, Saudi Arabia. J Ophthalmol. 2018;2018. doi:10.1155/2018/3708409.

    26. Alghamdi W. Refractive errors and binocular anomalies in primary schools in uyoun aljawa: a small Urban Town in Saudi Arabia. Glob J Health Sci. 2020;12(10):p116. doi:10.5539/GJHS.V12N10P116

    27. Alomair R, Alghnam S, Alnasser B, et al. The prevalence and predictors of refractive error among school children in Riyadh, Saudi Arabia. Saudi J Ophthalmol. 2021;34(4):273–277. doi:10.4103/1319-4534.322621

    28. Althomali TA, Alqurashi M, Alghamdi AS, Ibrahim A, Alswailmi FK. Prevalence of refractive errors in school-going children of Taif region of Saudi Arabia. Saudi J Ophthalmol. 2022;36(1):70–74. doi:10.4103/SJOPT.SJOPT_46_21

    29. Alkhathami A, Alqarni SAM, Aljuaid AT, et al. Prevalence and patterns of refractive error among school-age children in Bisha, Saudi Arabia. Cureus. 2023;15(12). doi:10.7759/CUREUS.50530

    30. Lorato MM, Yimer A, Kebede Bizueneh F. Prevalence of myopia in school-age children in Ethiopia: a systematic review and meta-analysis. SAGE Open Med. 2023;11. doi:10.1177/20503121231200105

    31. Ovenseri-Ogbomo G, Osuagwu UL, Ekpenyong BN, et al. Systematic review and meta-analysis of myopia prevalence in African school children. PLoS One. 2022;17(2):e0263335. doi:10.1371/JOURNAL.PONE.0263335

    32. Dutheil F, Oueslati T, Delamarre L, et al. Myopia and near work: a systematic review and meta-analysis. Int J Environ Res Public Health. 2023;20(1):875. doi:10.3390/IJERPH20010875/S1

    33. Martínez-Albert N, Bueno-Gimeno I, Gené-Sampedro A. Risk factors for myopia: a review. J Clin Med. 2023;12(18):6062. doi:10.3390/JCM12186062

    34. Russo A, Boldini A, Romano D, et al. Myopia: mechanisms and strategies to slow down its progression. J Ophthalmol. 2022;2022:1004977. doi:10.1155/2022/1004977

    35. Lanca C, Saw S-M. The association between digital screen time and myopia: a systematic review. Ophthalmic Physiol Opt. 2020;40(2):216–229. doi:10.1111/OPO.12657

    36. Rudnicka AR, V KV, Wathern AK, et al. Global variations and time trends in the prevalence of childhood myopia, a systematic review and quantitative meta-analysis: implications for aetiology and early prevention. Br J Ophthalmol. 2016;100(7):882–890. doi:10.1136/BJOPHTHALMOL-2015-307724/-/DC1

    37. Biswas S, El Kareh A, Qureshi M, et al. The influence of the environment and lifestyle on myopia. J Physiol Anthropol. 2024;43(1):7. doi:10.1186/S40101-024-00354-7

    38. Alanazi MK, Almutleb ES, Badawood YS, Kudam MA, Liu M. Perspectives and clinical practices of optometrists in Saudi Arabia concerning myopia in children. Int J Ophthalmol. 2023;16(2):267–273. doi:10.18240/IJO.2023.02.14

    39. Ho M, Morjaria P. Cycloplegic refraction in children. Community Eye Health. 2024;37(122):14.

    40. Yuexin W, Yu Z, Yifei Y, Yan L, Yueguo C. The impact of accommodation function on the difference between noncycloplegic and cycloplegic refraction in adult myopes. Acta Ophthalmol. 2024;102(5):e727–e735. doi:10.1111/AOS.16632

    41. Eslayeh AH, Omar R, Fadzil NM. Refractive amblyopia among children aged 4–12 years in a hospital-based setting in Gaza Strip, Palestine. Med Hypothesis Discov Innov Ophthalmol. 2021;10(3):107. doi:10.51329/MEHDIOPHTHAL1428

    42. At R, Farzana Ghouse N. A study on prevalence of refractive errors, strabismus and amblyopia in paediatric age group in a tertiary care hospital. Original Research Article J Evid Based Med Healthc. 2018;5. doi:10.18410/jebmh/2018/144

    43. Abd Elkhalik RM, El-Bassiouny OM, El Nahass HS, Farghaly RM. Pattern of errors of refraction among children attending ophthalmic outpatient clinic in Suez Canal University Hospital. Suez Canal University Med J. 26(10):2023.

    44. Read SA, Collins MJ, Carney LG. A review of astigmatism and its possible genesis. Clin Exp Optom. 2007;90(1):5–19. doi:10.1111/j.1444-0938.2007.00112.x

    45. Basheikh A, Howldar S, Basendwah M, Baqais R, Bamakrid M, Alhibshi N. Astigmatism among children in Jeddah, Saudi Arabia: prevalence and associated factors. World Family Med J. 2021;19(2). doi:10.5742/MEWFM.2021.93976

    46. Öner V, Bulut A, Büyüktarakçi S, Kaim M. Influence of hyperopia and amblyopia on choroidal thickness in children. Eur J Ophthalmol. 2016;26(6):623–626. doi:10.5301/EJO.5000703

    47. Pascual M, Huang J, Maguire MG, et al. Risk factors for amblyopia in the vision in preschoolers study. Ophthalmology. 2014;121(3):622–629.e1. doi:10.1016/J.OPHTHA.2013.08.040

    48. Wajuihian SO, Mashige KP. Gender and age distribution of refractive errors in an optometric clinical population. J Optom. 2021;14(4):315. doi:10.1016/J.OPTOM.2020.09.002

    49. Khoshhal F, Hashemi H, Hooshmand E, et al. The prevalence of refractive errors in the Middle East: a systematic review and meta-analysis. Int Ophthalmol. 2020;40(6):1571–1586. doi:10.1007/S10792-020-01316-5

    50. Sheeladevi S, Seelam B, Nukella PB, Modi A, Ali R, Keay L. Prevalence of refractive errors in children in India: a systematic review. Clin Exp Optom. 2018;101(4):495–503. doi:10.1111/CXO.12689

    51. Bist J, Kandel H, Paudel N, et al. Prevalence of refractive errors in Nepalese children and adults: a systematic review with meta-analysis. Clin Exp Optom. 2023;106(2):119–132. doi:10.1080/08164622.2022.2153582

    52. Li D, Min S, Li X. Is spending more time outdoors able to prevent and control myopia in children and adolescents? a meta-analysis. Ophthalmic Res. 2024;67(1):393–404. doi:10.1159/000539229

    53. Saxena R, Dhiman R, Gupta V, et al. Prevention and management of childhood progressive myopia: national consensus guidelines. Indian J Ophthalmol. 2023;71(7):2873–2881. doi:10.4103/IJO.IJO_387_23

    Continue Reading