Pharmacy Times: What are the leading causes of preventable maternal and neonatal mortality, and how can pharmacists help address these gaps in care?
Morgan King, PharmD, BCPPS: The leading causes of preventable maternal mortality generally are…

Pharmacy Times: What are the leading causes of preventable maternal and neonatal mortality, and how can pharmacists help address these gaps in care?
Morgan King, PharmD, BCPPS: The leading causes of preventable maternal mortality generally are…
RIGA, Dec. 8 (Xinhua) — Latvia’s Center for Disease Prevention and Control (CDC) on Monday informed of the start of the annual influenza epidemic in the country and encouraged vaccination as the most effective protection.
The CDC declared…

A new advance from Carnegie Mellon University researchers could reshape how clinicians identify the brain regions responsible for drug-resistant epilepsy. Surgery can be a life-changing option for millions of epilepsy patients…

When pregnant women drink water that comes from wells downstream of sites contaminated with PFAS, known as “forever chemicals,” the risks to their babies’ health substantially increase, a new study found. These risks include the chance…
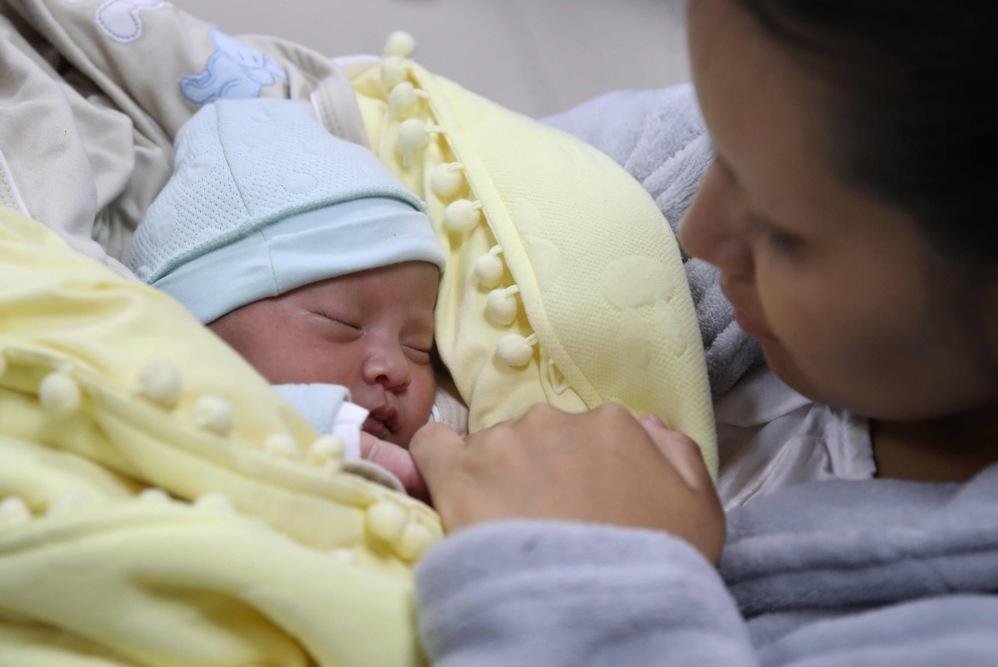
Baby Aylin is held by her mother, Valeria Vela, at Cayetano Heredia Hospital in Lima, Peru, on Wednesday. Aylin is only the fourth case in the world of a successful hepatic ectopic pregnancy, where a mother was able to carry the pregnancy to term…


Martin Rivas/med.miami.edu
Article Summary: