Gavi, the Vaccine Alliance has pared down its staff in its Geneva…
- A nationwide Danish study found that…
Gavi, the Vaccine Alliance has pared down its staff in its Geneva…

Close-up of tree ring samples taken from the Pyrenees, showing the telltale “blue rings.”
Credit:
…


Researchers at Helmholtz Munich, the Technical University of Munich and the LMU University Hospital Munich uncovered a mechanism that protects nerve cells from premature cell death, known as ferroptosis. The study provides the first…

My husband died of prostate cancer in August, and I read your coverage of the UK National Screening Committee’s recommendations with dread (Expert panel advises against prostate cancer screening for most men in UK, 28 November). I believe the…

Gerry Bradleyand
Auryn Cox,BBC News NI
 BBC
BBCThe principal of a County Londonderry school has said it is like “being back in Covid times”…
Friday, 5 December 2025, 17:57
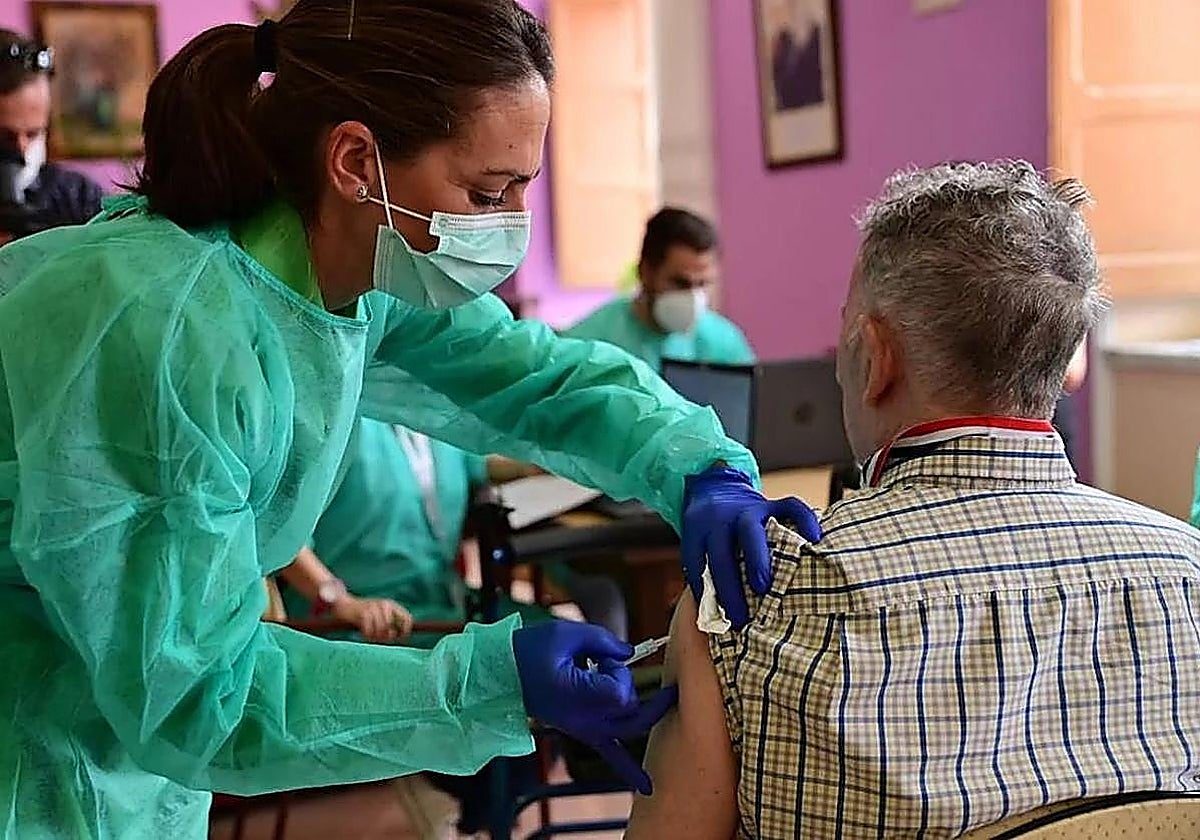
The end of autumn and the beginning of winter in Malaga are both proving to be more complicated than in previous years due to the premature arrival of the flu season, which is currently four to…
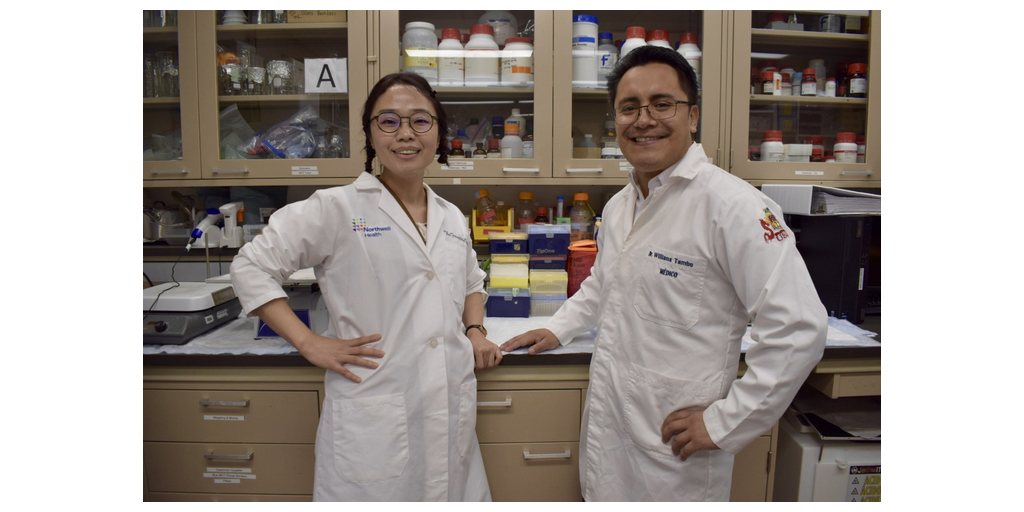
MANHASSET, N.Y.–(BUSINESS WIRE)–Scientists at Northwell Health’s Feinstein Institutes for Medical Research have uncovered a critical mechanism driving vascular cognitive impairment (VCI), the world’s second most common form of dementia…