The AI-CS framework offers a promising alternative for cardiac MRI examinations in the clinical setting, where long acquisition time remains a major challenge
Nan Zhang
“For patients with severe arrhythmias, breath-holding can be particularly…
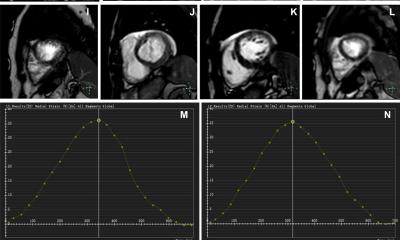
The AI-CS framework offers a promising alternative for cardiac MRI examinations in the clinical setting, where long acquisition time remains a major challenge
Nan Zhang
“For patients with severe arrhythmias, breath-holding can be particularly…

Researchers from the Federal University of São Carlos (UFSCar) in Brazil, working with University College London (UCL) in the United Kingdom, found that having both excess abdominal fat and reduced muscle mass significantly raises the risk of…
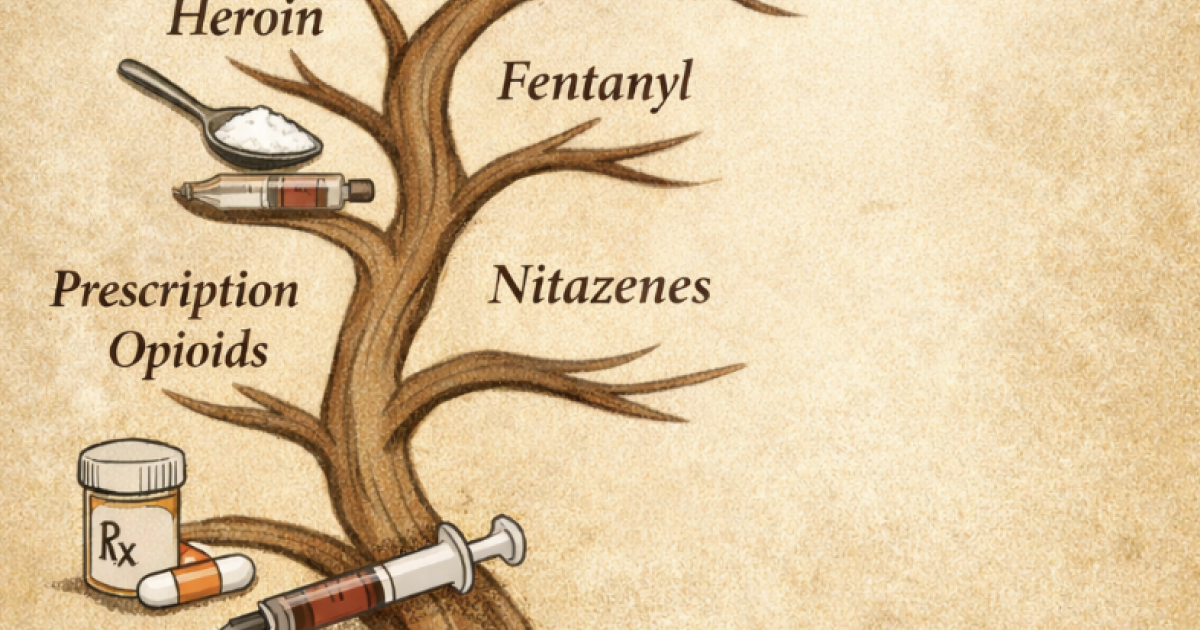
Drug policy and microbiology might seem like completely different worlds. But both are shaped by the same evolutionary principle: when pressure is applied, systems adapt. The rise of a new opioid called cychlorphine illustrates how drug markets…

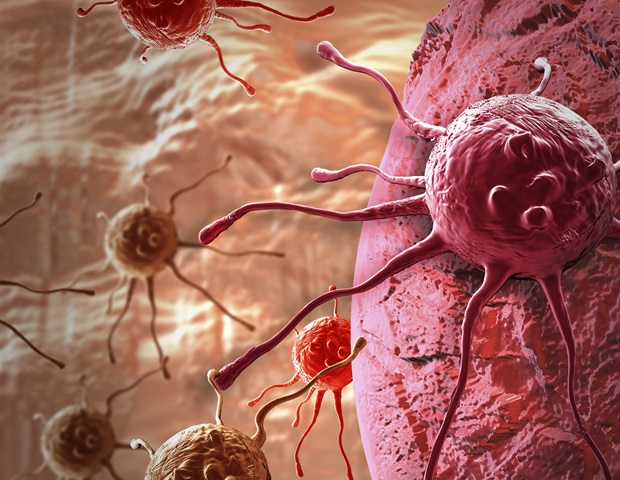
The study, published in PNAS, shows that while individual cancer cells can probe about 10 microns ahead by pulling on collagen fibers, clusters of normal epithelial cells can extend this sensing range up to 100 microns when…
Bottom Line: A machine learning model that analyzes patient demographics, electronic health record data, and routine blood test results predicted a patient’s risk of hepatocellular carcinoma (HCC), the most common type of liver…

A new analysis of existing studies co-led by a University of Massachusetts Amherst public health researcher finds that nicotine e-cigarettes consistently help adults quit smoking, a conclusion that emerges with striking agreement…
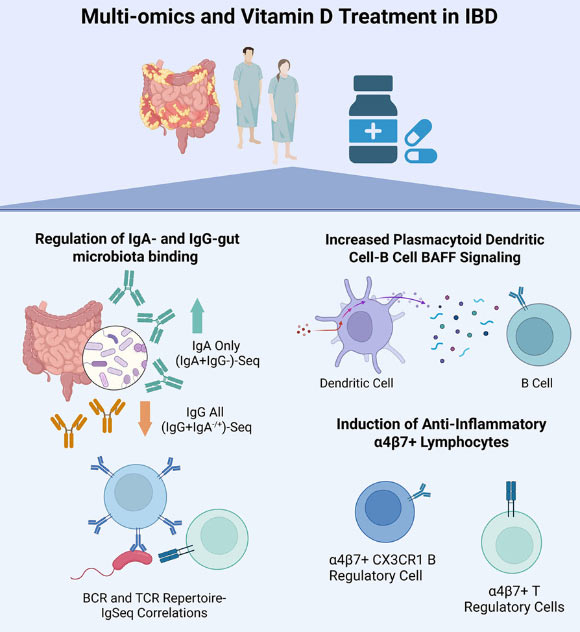
New research suggests that vitamin D supplements can reshape how the immune system responds to gut bacteria in patients with inflammatory bowel disease, potentially nudging the body toward a more protective, less inflammatory state. The…

Barcelona, Spain: Researchers leading a trial of active surveillance for ductal carcinoma in situ (DCIS) have described early results as ‘reassuring’ in a presentation to the 15th European Breast Cancer Conference (EBCC15) in Barcelona…
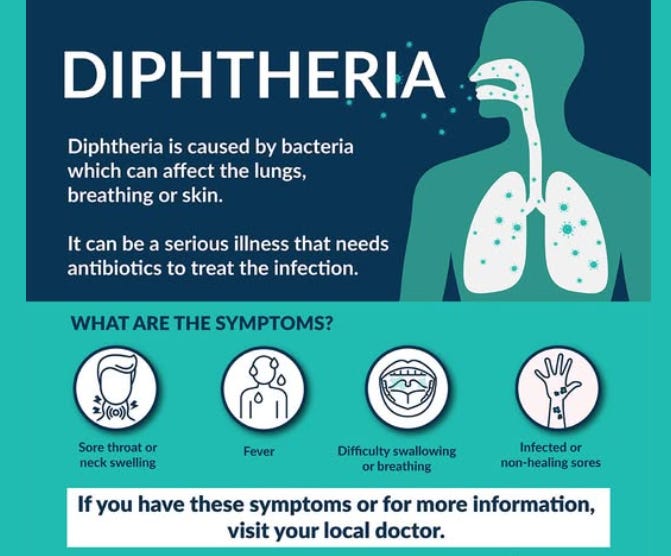
The Northern Territory Centre for Disease Control report investigating an outbreak of diphtheria.
As of Wednesday, there have been four cases of respiratory diphtheria (3 in Darwin, 1 in Alice Springs) notified in the last week and 33 cases of…