– Advertisement –
ISLAMABAD, Nov 8 (APP): Health experts have revealed that taking daily doses of Vitamin D can significantly help lower high cholesterol levels, reduce the risk of hypertension and diabetes, and improve insulin production in the…

– Advertisement –
ISLAMABAD, Nov 8 (APP): Health experts have revealed that taking daily doses of Vitamin D can significantly help lower high cholesterol levels, reduce the risk of hypertension and diabetes, and improve insulin production in the…

Although CHD is the most frequent…
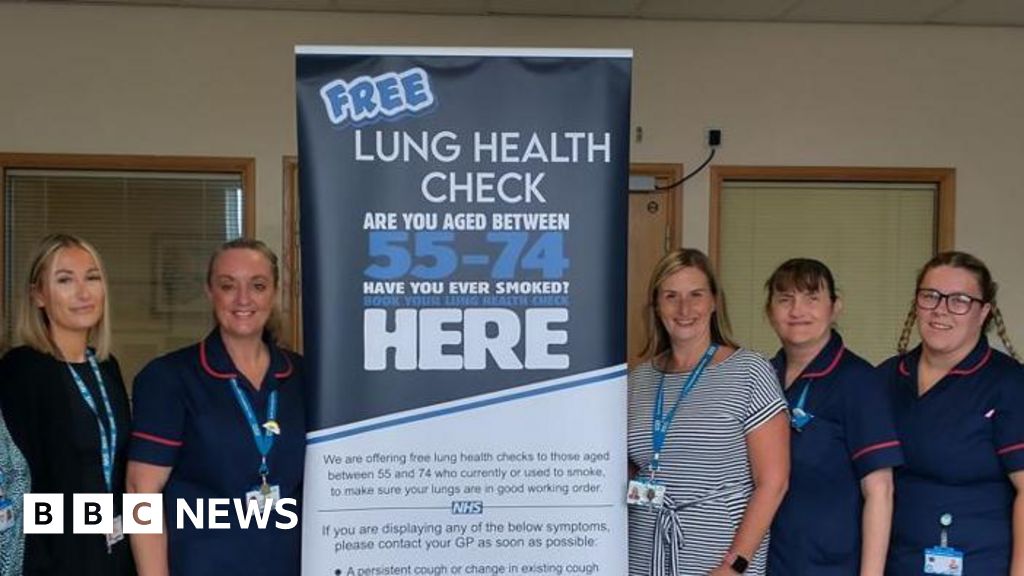
More than 180 cases of lung cancer have been detected thanks to an NHS screening programme.
South Tyneside and Sunderland NHS Foundation Trust launched the Lung Health Check scheme in October 2022 and since then more than 35,000 people have used…
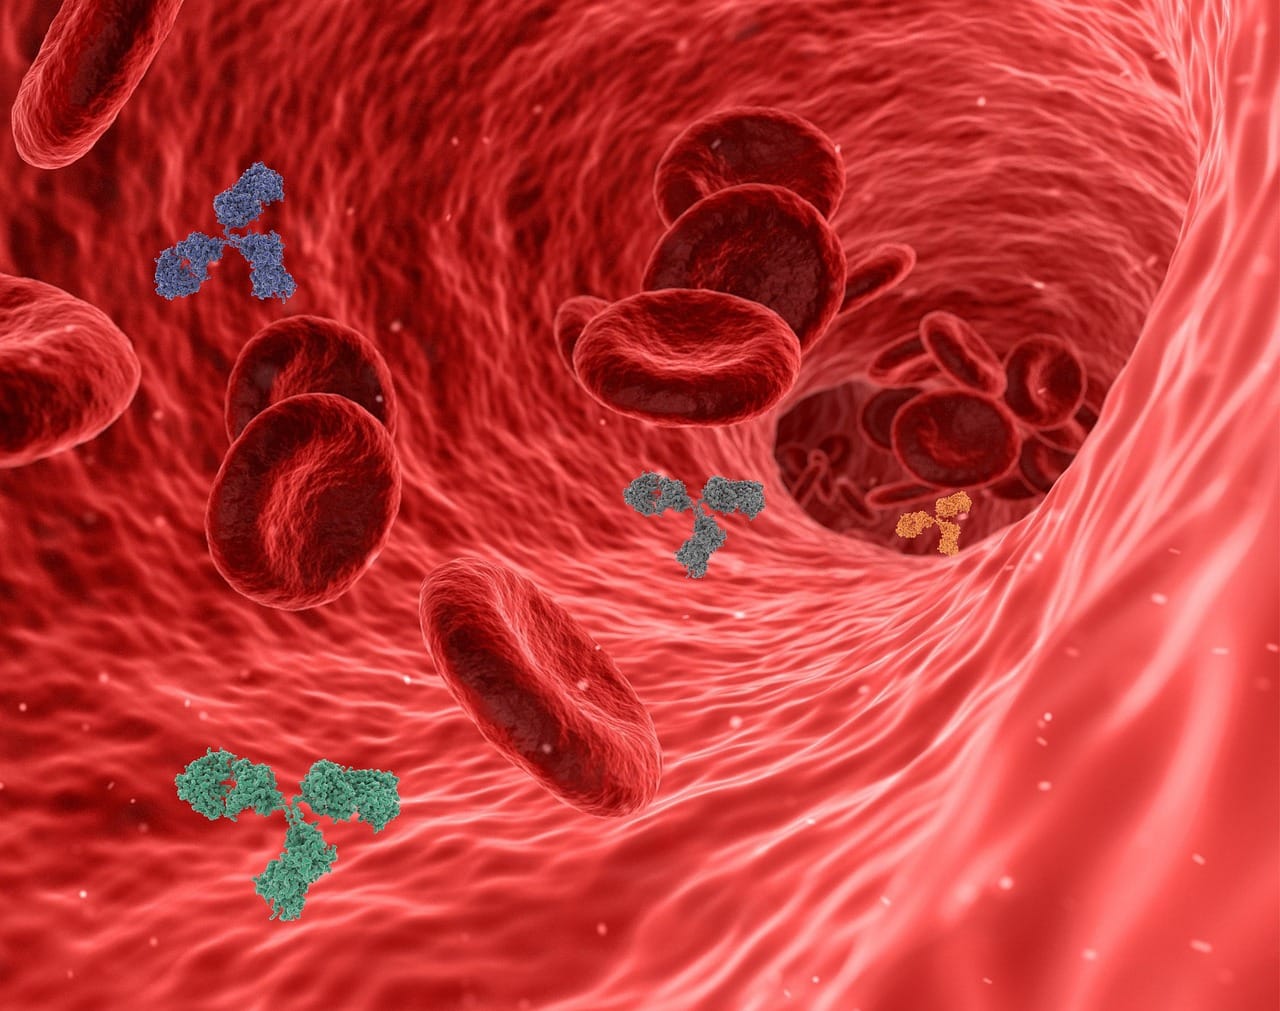
Despite effective HIV medication, the immune system of people with HIV remains disrupted in the long term.
Researchers at Amsterdam UMC investigated whether this dysregulation can be prevented by starting HIV medication immediately after…

There is a growing imperative for cardiology care models and clinical trials to better reflect the realities of aging.
At the

At the

A MAJOR new study has revealed that the COVID-19 infection in children poses a far greater risk of heart and inflammatory complications than the vaccination. Researchers found that heart conditions lasted longer and occurred more frequently…


In Alzheimer’s disease, the most common cause of dementia, microglia (the brain’s immune cells) play a double role. They can protect the brain by clearing harmful debris or, under certain conditions, contribute to damage and inflammation. How…