Faculty Advisor:
Donald Blake, University of California, Irvine
Graduate Mentor:
Oluwaseun Moses Akinola, University of Connecticut
Faculty Advisor:
Donald Blake, University of California, Irvine
Graduate Mentor:
Oluwaseun Moses Akinola, University of Connecticut
Faculty Advisor:
Dom Ciruzzi, William & Mary
Graduate Mentor:
Sarah Payne, University of California, Santa Barbara
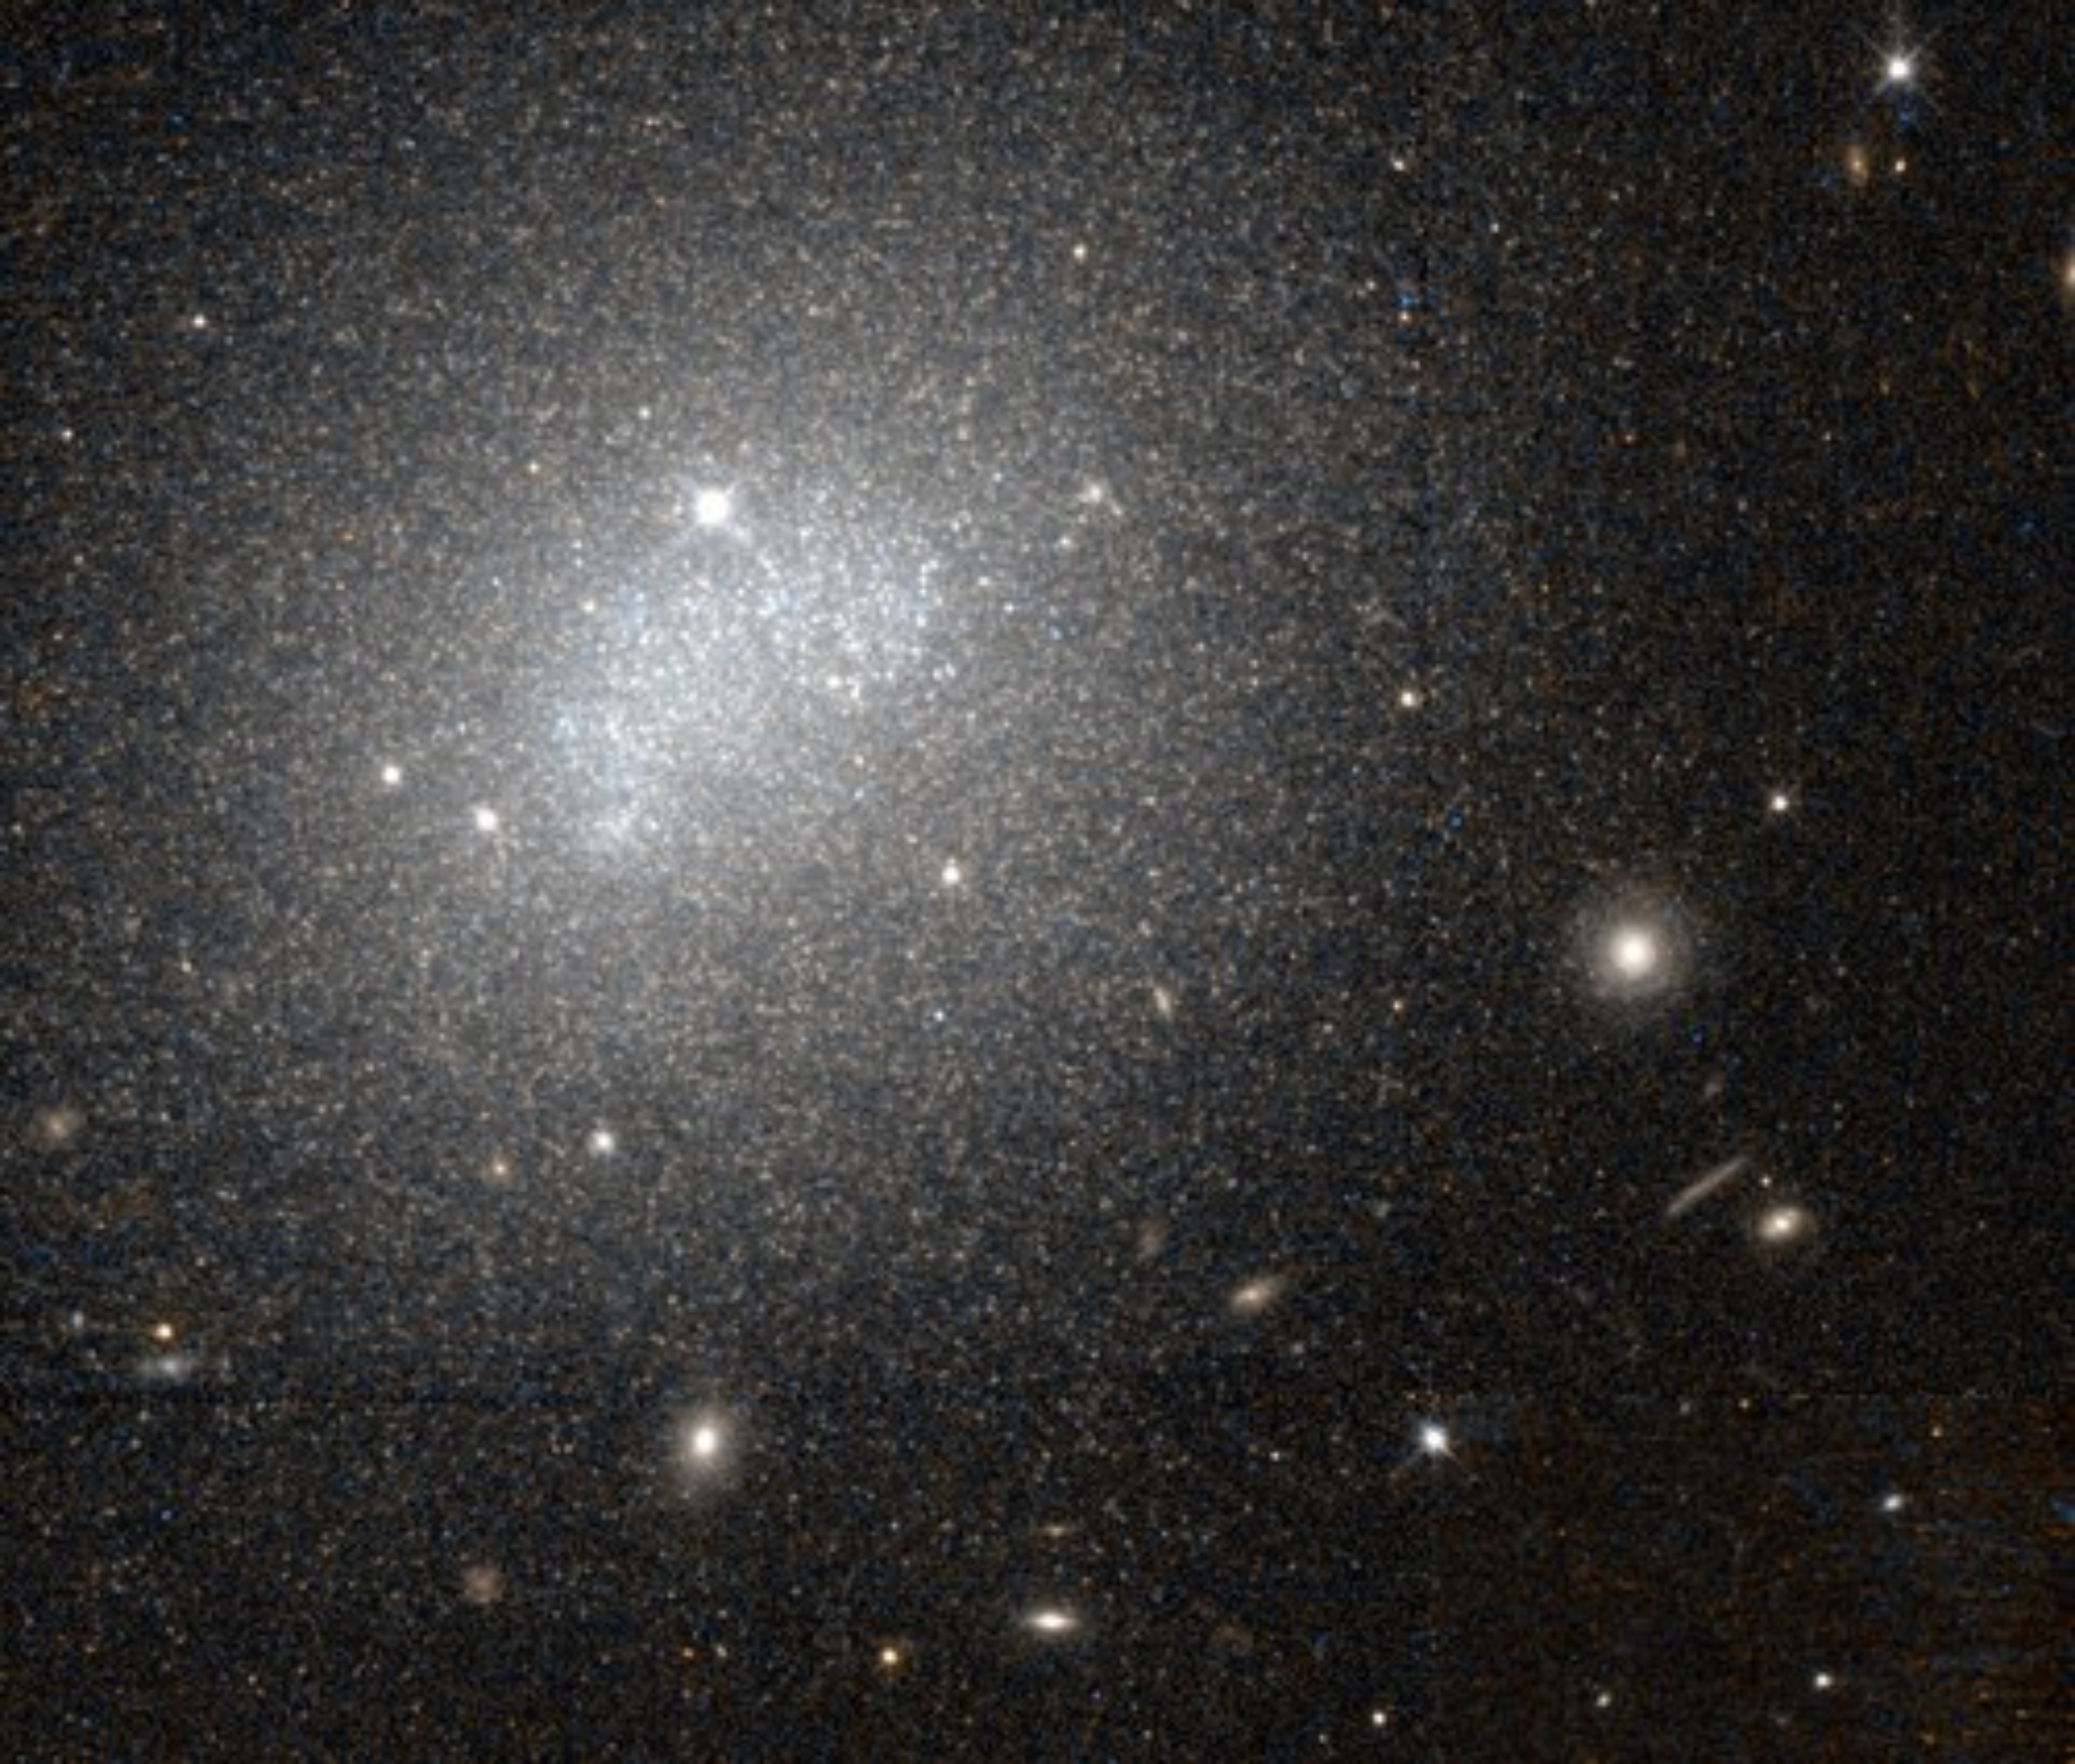
Astronomers have taken a fresh look at NGC 6789, an isolated dwarf galaxy located about 12 million light-years away in the constellation Draco. What they found is a fascinating mystery.
Over the past 600 million years, this dwarf has been steadily…
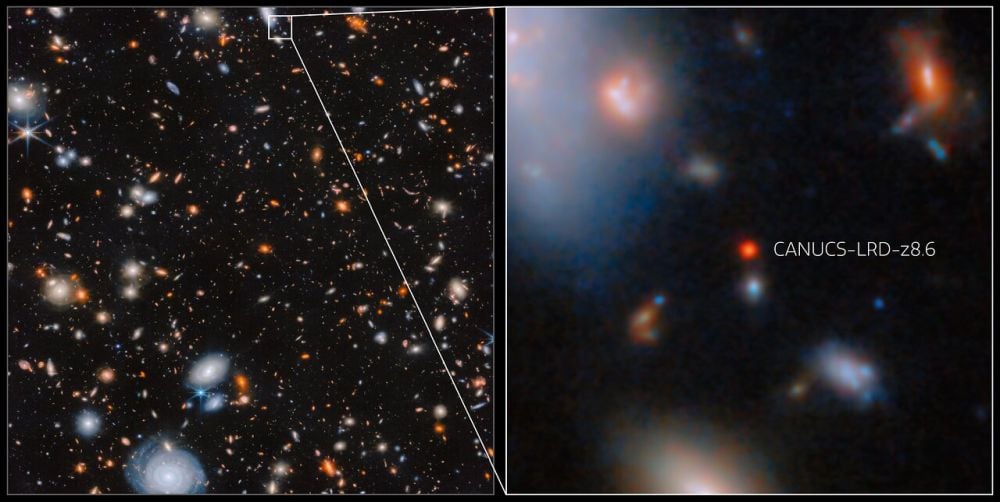
One of the things the James Webb Space Telescope revealed to us is a class of small, distant galaxies in the very early Universe. Their light has been stretched into the red after billions of years travelling in the expanding Universe,…

In recent years, the inclusion of patient voices in the design, communication, and dissemination of medical research has gained prominence as a central tenet of participatory health care. Meaningful involvement of patients and…
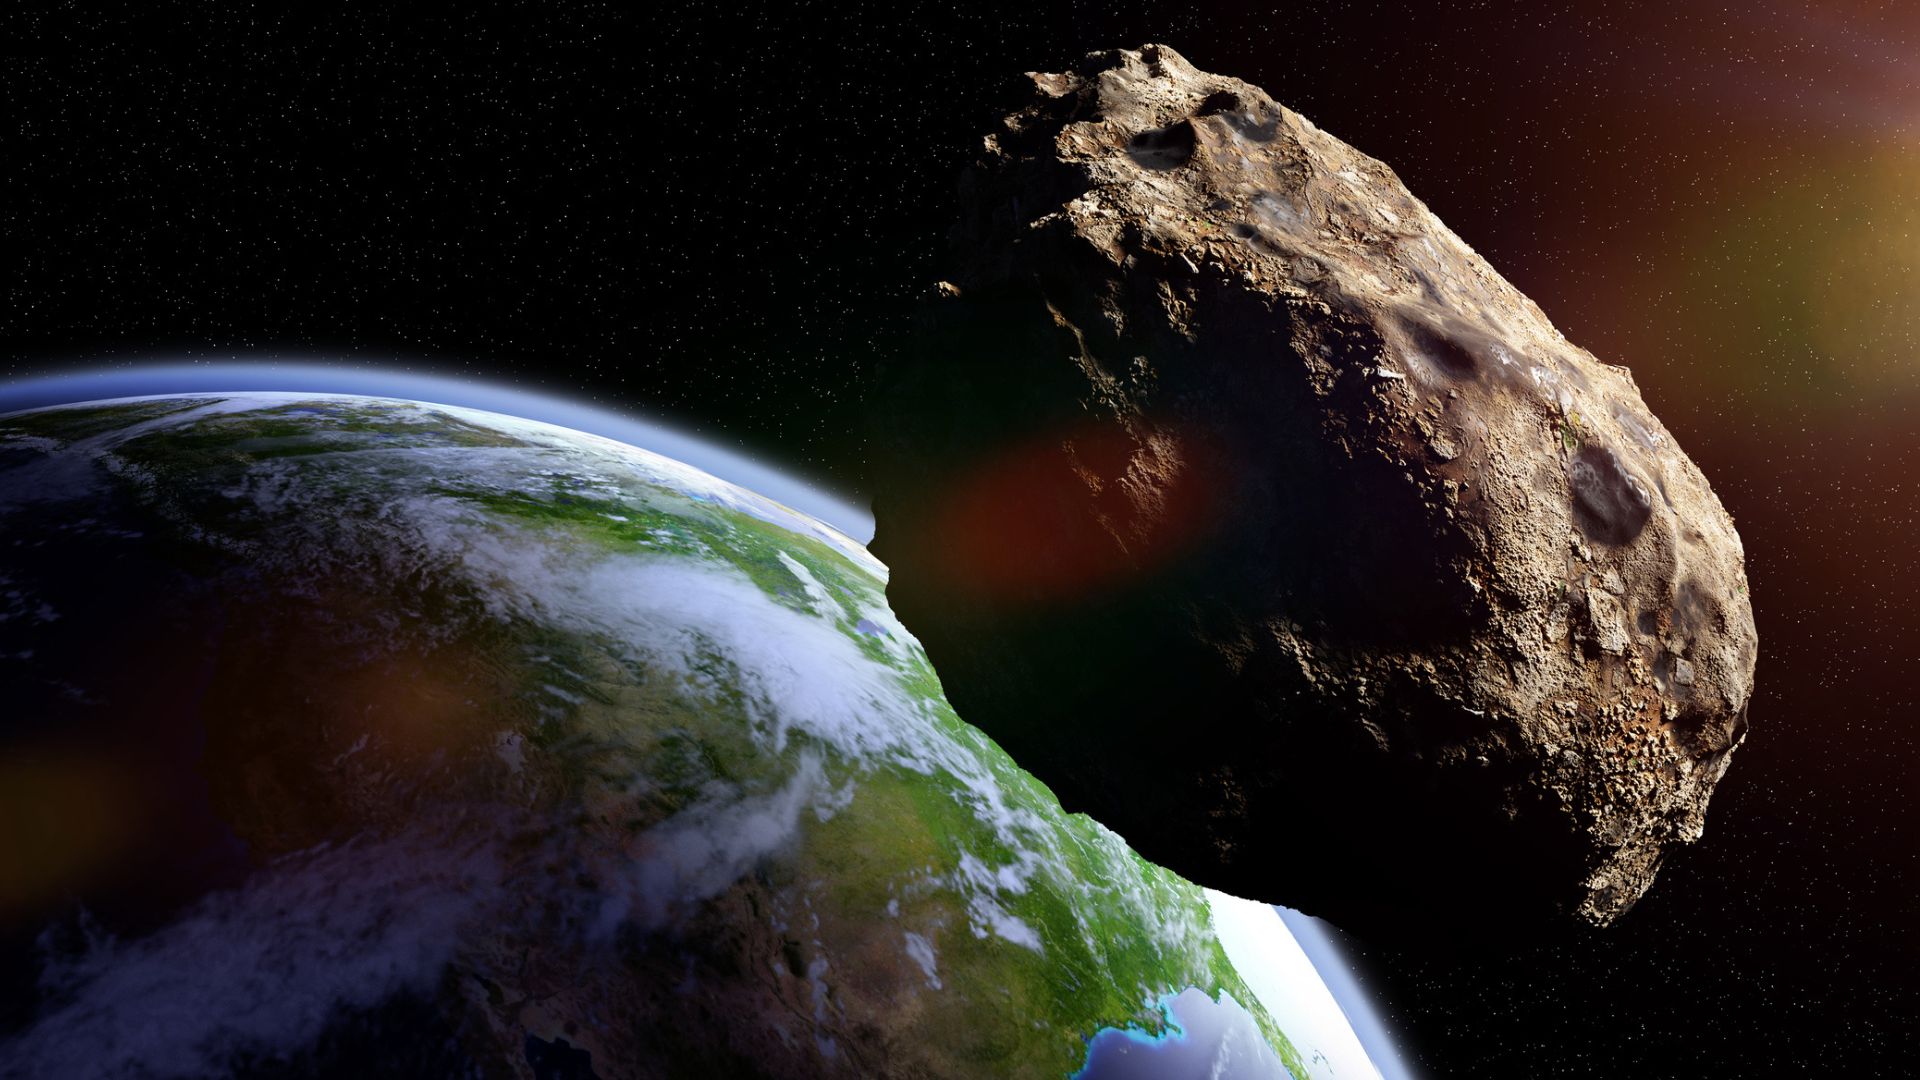
On February 15, 2013, the people of Chelyabinsk, Russia, witnessed something terrifying. A six-story-tall asteroid weighing nearly 10,000 metric tons tore through the atmosphere at more than 64,000 km/h. Just 19 to 24 km above the city, it…
This article was updated to include the full range of dates from the SOHO image.
Lee esta historia en español aquí.
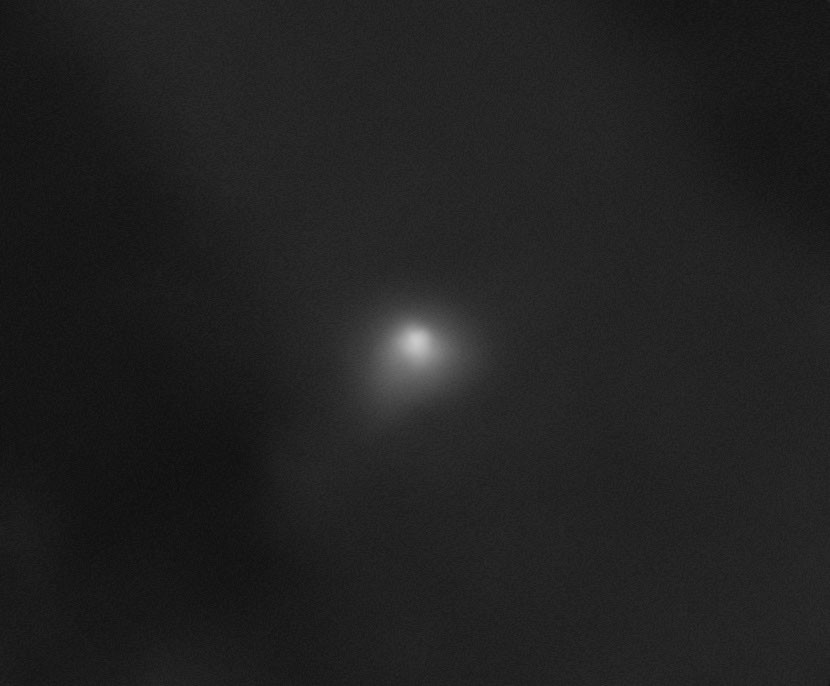
NASA is in the midst of an unprecedented solar system-wide observation campaign, turning its spacecraft and space…
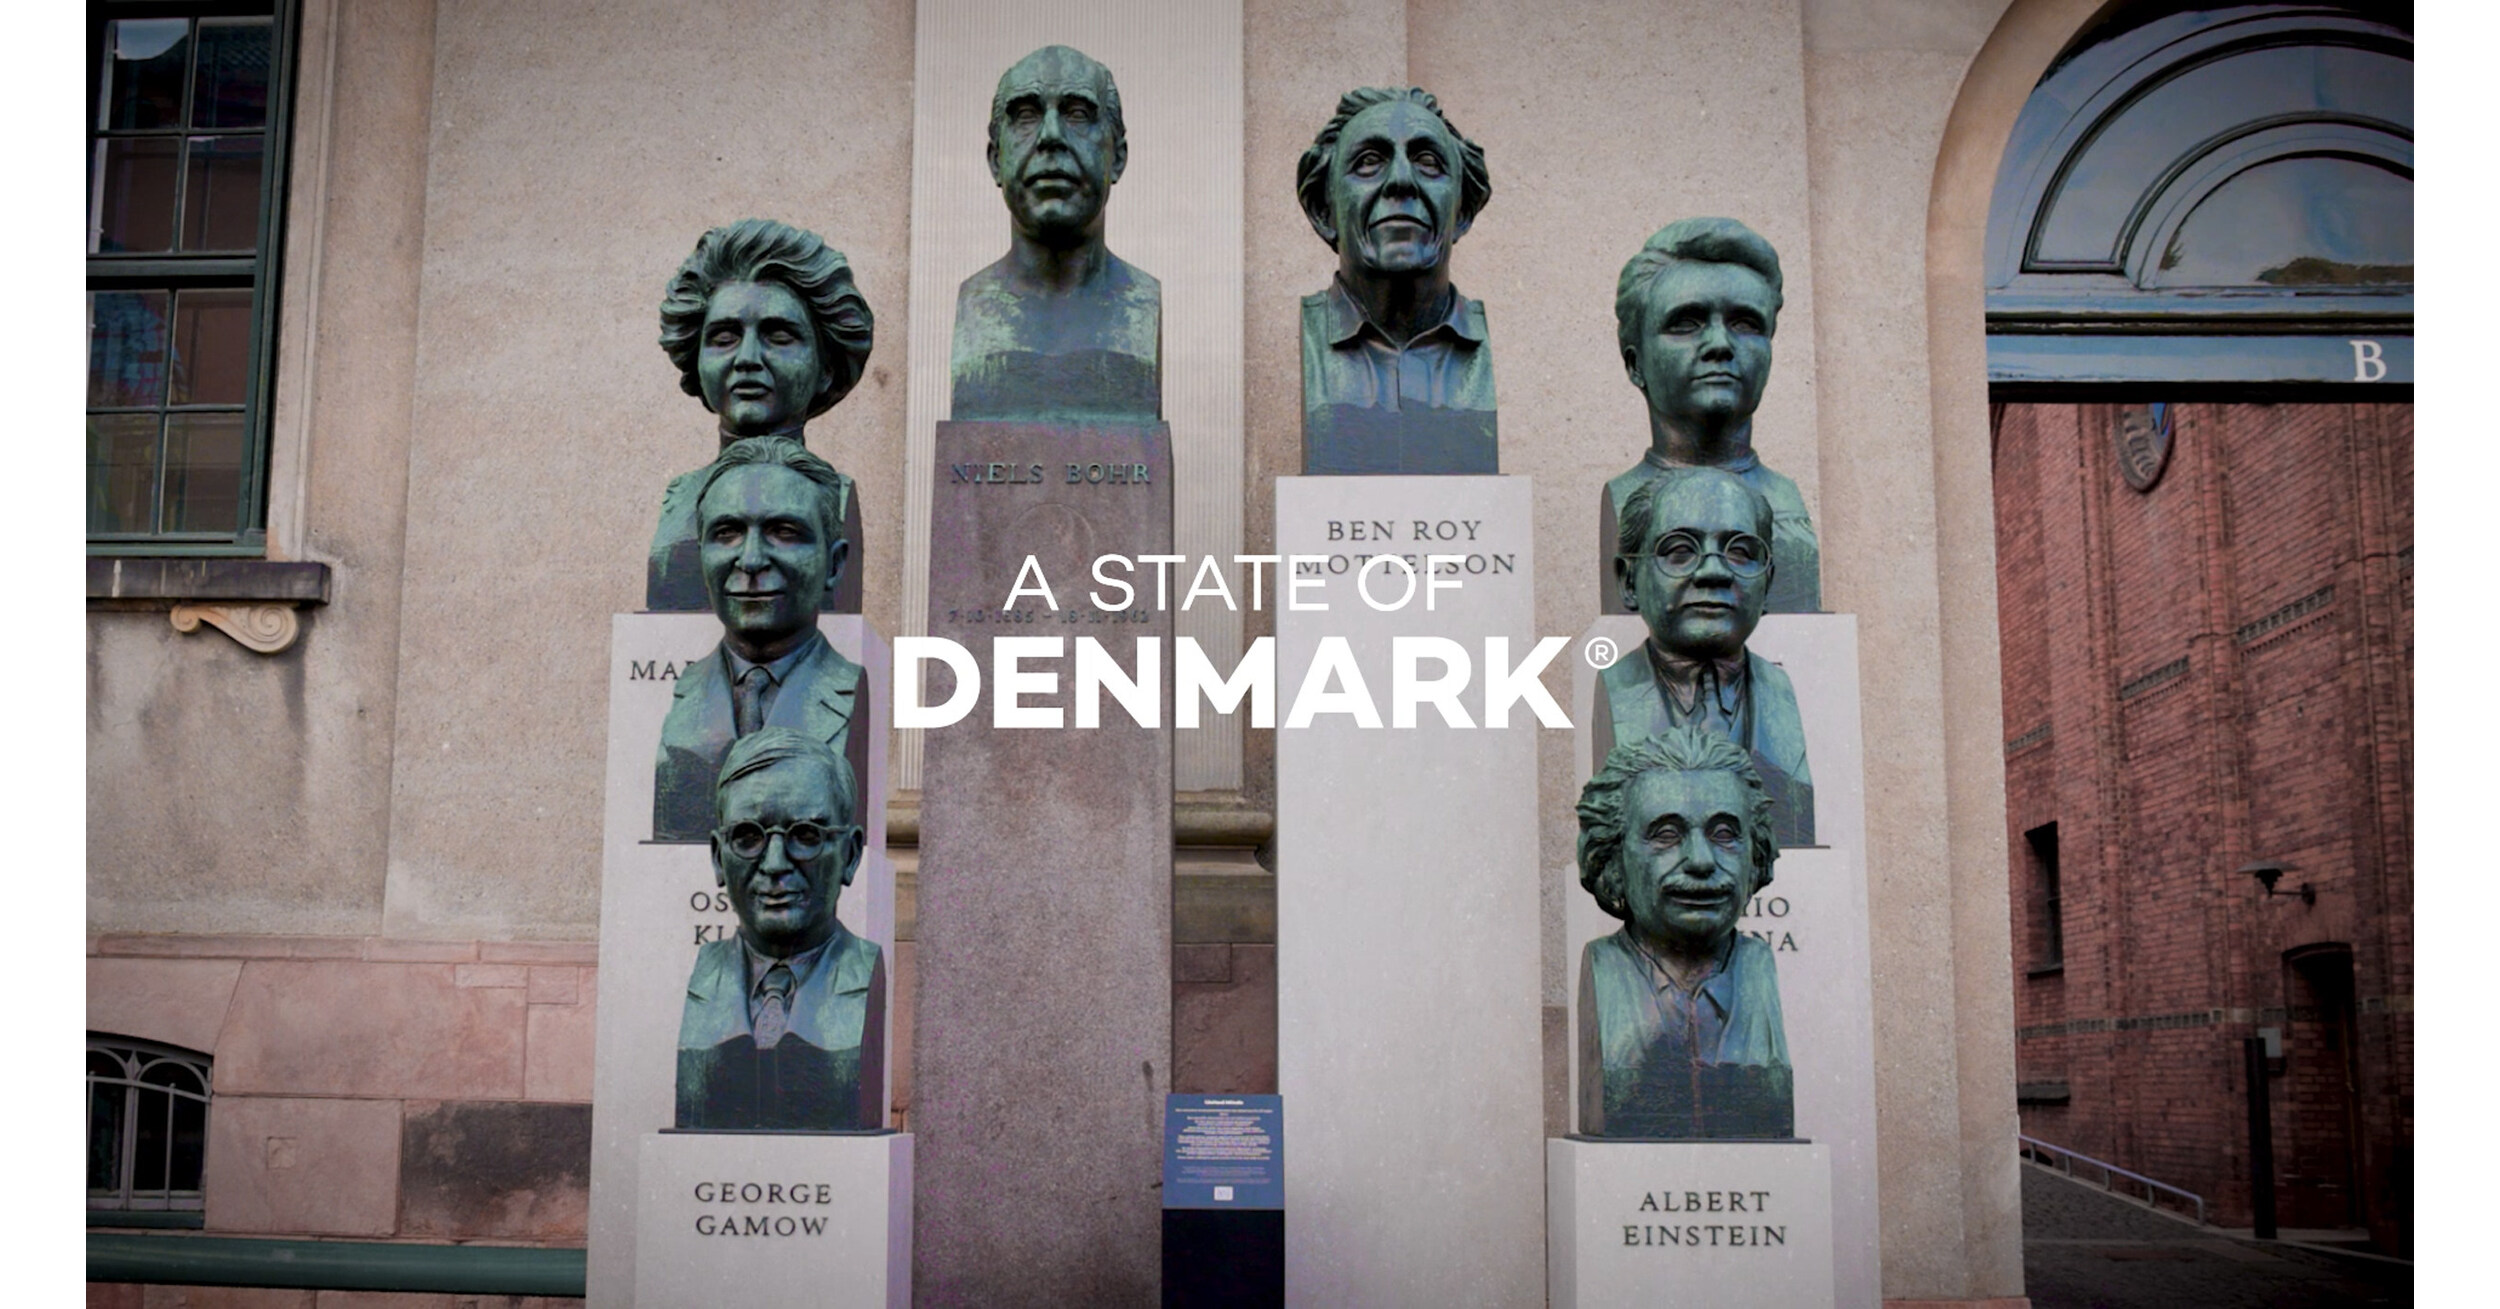
Groundbreaking Art Installation Celebrates the Power of Collective Discovery and Launches Open World Conference 2025
COPENHAGEN, Denmark, Nov. 19, 2025 /PRNewswire/ — A State of Denmark and the University of Copenhagen…
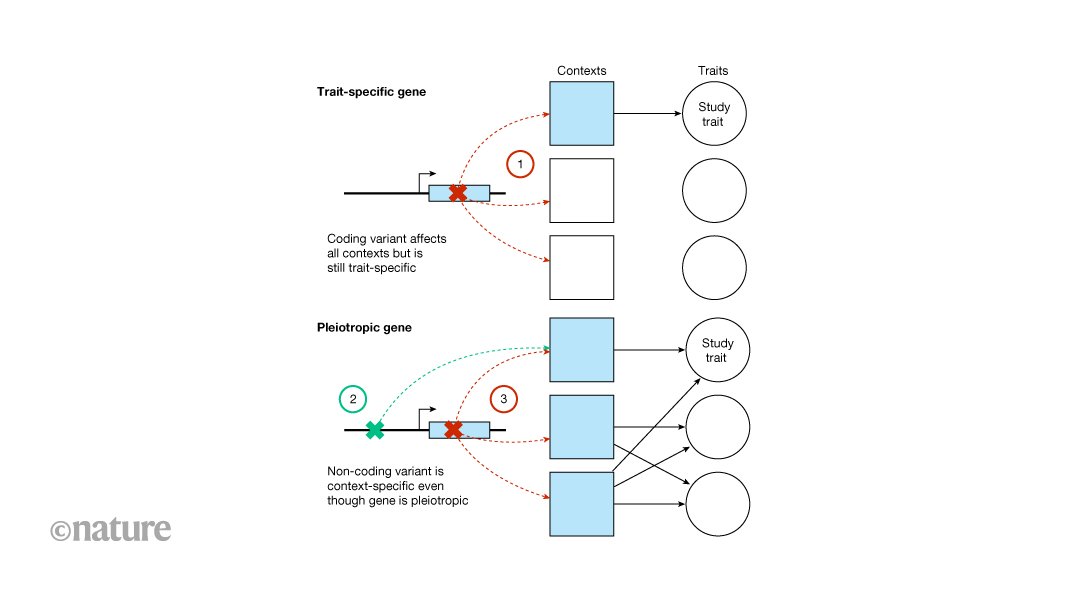
Genome-wide association studies and rare-variant…